
1 Introduction
Fourth-generation wireless (4G) was developed with the aim of providing data rates of up to 20 Mbps with high quality of service (QoS) [1]. Increasing demands for higher data rates and more efficient data transfer have encouraged network providers to allocate more bandwidth to the users [2]. This may introduce non-linear effects in band-limited channels. Hence, the coherence bandwidth becomes smaller than the allocated bandwidth [3]. Thus, receiver complexity increases due to complex equalizers required for compensating the non-linear effects. Therefore, single-carrier modulation is not an ideal solution for high data rates in band limited channels [4].
Hence, researchers have focused on multicarrier modulation techniques in which the given channel bandwidth is divided into sub-bands with smaller bandwidths than the coherence bandwidth [4]. The user data are modulated over the sub-bands and the data are recovered at the receiver with a perfect reconstruction criterion [5]. One of the multicarrier modulation techniques is multicarrier code division multiple access (MC-CDMA).
MC-CDMA is one of the most promising multicarrier modulation techniques in 4G technology [6]. The MC-CDMA system is an efficient combination of code division multiple access (CDMA) and orthogonal frequency division multiplexing (OFDM). In CDMA, the narrow information of the users is spread by using spreading codes. The users are separated by using orthogonal spreading codes. The CDMA technique is seen as an efficient scheme because of its anti interference properties, robustness to fading and ability to support multimedia services in the mobile environment [7]. OFDM increases the overall data rate by splitting the data stream into a number of parallel streams and using different subcarriers for each channel [7]. The merits of MC-CDMA include maximum utilization of the spectrum, easy adjustment to strict channel conditions without complex detection, and high resistance to intersymbol interference (ISI) and fading caused by multipath propagation [7].
One of the major concerns concerning MC-CDMA is its high PAPR [8]. A high PAPR leads to in-band distortion and intermodulation among subcarriers. The PAPR can be reduced in MC-CDMA systems in many ways [9]. Special binary sequences and linear transform techniques can be applied at the MC-CDMA transmitter to reduce the PAPR with improved BER performance.
The most popular sequence used for PAPR reduction in MC-CDMA systems is the Walsh Hadamard (WH) sequence. The problem with this sequence is however that it does not have a single and narrow autocorrelation peak. The WH sequence is not spread over the entire bandwidth. Yang, et al. [10] proposed spreading the code reallocation scheme for PAPR reduction using the WH sequence and a Golay complementary sequence (CS). In fully loaded systems, the WH sequence provides better performance, whereas in lightly loaded systems, the CS provides better performance. The PAPR is reduced as the code is reallocated depending on the load condition; this leads to more system complexity.
The Barker and Kasami sequence was developed for PAPR reduction in MC-CDMA systems. However, the performance of this sequence is not good, because the sequence is short in length and has poor autocorrelation [11]. Hence, spreading sequences such as pseudo noise (PN), Gold and 3 term sequences are chosen for efficient PAPR reduction because of their good randomness property. The PN sequence is generated by single shift register but does not have a good correlation property and it is not suitable for CDMA systems [12]. Gao, et al. [13] proposed a 3-term binary sequence to reduce
PAPR in MC-CDMA systems. The Gold and 3-term sequences have a length that depends on the number of users and the linearity between the codes is poor.
Peak power control using a special binary sequence achieves better PAPR reduction. However, it also leads to heavy computational complexity due to the large sequence length of the binary code used for spreading the data symbol of a particular user. Therefore, peak power control using a special binary sequence is not suitable for high data rates and large capacity systems.
Thus, a linear transform approach must be used to reduce PAPR for high data rates and large capacity systems. Li, et al. [14] proposed a number of linear transform approaches such as clipping and filtering techniques for PAPR reduction and system performance improvement. The deliberate clipping technique is a simple technique to reduce the PAPR. However, clipping is a non-linear process and it causes significant in-band distortion, which degrades BER performance, and out-band distortion, which reduces spectral efficiency. To improve BER performance and spectral efficiency, filtering techniques have been introduced to be applied after clipping, so that the loss in spectral efficiency can be compensated. However, this causes regrowth of peaks in some cases and so a trade-off must be made between clipping and filtering.
A peak windowing technique has been proposed by Richard van Nee and Arnout de Wild [15] to reduce the PAPR. The regrowth of peaks can be reduced by multiplying large signal peaks by a window function, such as the Kaiser, Cosine and Hamming window. In the windowing technique, out-band distortion is reduced with loss of side information (SI) [16]. Wang, et al. [17] proposed a companding technique to reduce the PAPR in multicarrier transmission systems. The companding technique is simple and effectively reduces the PAPR when compared to the clipping technique. When the compressed and original signals are compared, the compressed signal has a large average power level and still exhibits non-uniform distribution.
The most popular techniques for PAPR reduction in multicarrier systems are selective mapping (SLM) and the partial transmit sequence (PTS). Selective mapping is one of the most commonly used distortion-less probabilistic schemes for PAPR reduction [18]. In SLM, finding the phase sequence for multiplication is random and therefore phase search complexity is high.
Wang and Ouyang [19] proposed a new SLM-based low-complexity scheme for PAPR reduction. In this scheme, low complexity is achieved at the expense of degradation in PAPR reduction. Modified SLM schemes with low computational complexity have been proposed by Zhou and Peng [20] and Seok-Joong, et al. [21]. In these schemes, better reduction of peak power is achieved but side information is still required for data recovery. Irukulapati, et al. [22] have proposed a new phase sequence for an SLM-based reduction scheme. In this scheme, phase search complexity is greatly reduced but computational complexity is still high. Wang, et al. [23] proposed a low complexity PAPR estimation scheme and its application to SLM-based reduction schemes. The results showed that reduction of the PAPR was achieved; however, side information is required in this scheme. Park, et al. [24] and Eom and Seung-Sik [25] proposed a low-complexity PAPR reduction scheme without side information requirement, but it leads to a slight degradation in PAPR reduction.
The PTS technique proposed by Muller and Huber [26] requires more IFFT operations for each data block, leading to higher computational complexity. The side information required in this scheme is large, resulting in poor bandwidth efficiency. Kwon and Ha [27] proposed sub optimal PTS for a peak-power reduction scheme. Baxley and Zhou [28] compared the performance of PTS with SLM in terms of computational complexity and probability of error performance. Jayalath and Tellumbura [29] proposed PAPR reduction without side information requirement. However, this scheme increases computational complexity. In multicarrier systems the computational complexity analysis is done in OFDM and Palanivelan, et al. have analyzed its performance [30]. Baxley and Zhou [28] compared SLM and PTS in terms of their PAPR reduction capabilities, computational complexity and side information transmission requirements.
In this study, the NORM technique was used to reduce the PAPR in MC-CDMA systems, with less computational complexity and improved efficiency. NORM-based MC-CDMA was compared with conventionally used PTS and SLM techniques. In addition, unlike SLM and PTS, this technique does not require the transmission of SI to the receiver, which provides better bandwidth utilization and a larger capacity. NORM-based MC-CDMA systems provide a lower PAPR than NORM-based OFDM systems.
2 MC-CDMA Transmitter with NORM Technique
A block diagram of the MC-CDMA transmitter with NORM for PAPR reduction is shown in Figure 1. The NORM-based OFDM system discussed in [30] was extended in the MC-CMDA system. It consists of serial to parallel conversion, followed by multiplication of data with spreading sequences whose length is given as L. Let K be the total number of active users such that \(K \leq L\) and N be the total number of data symbols. The spreading sequence \(c^k\) for the \(k^{th}\) user is represented as \(c^k = [c_1^k, c_2^k, \dots, c_L^k]\). The data symbol \(b^k\) for the \(k^{th}\)
user is given as \(b^k = [b_1^k, b_2^k, \dots, b_N^k]\). The spread data of K users are added and given to a block interleaver before subcarrier mapping and then IFFT is performed. The total number of subcarriers P is computed as \(P = N \times L\).
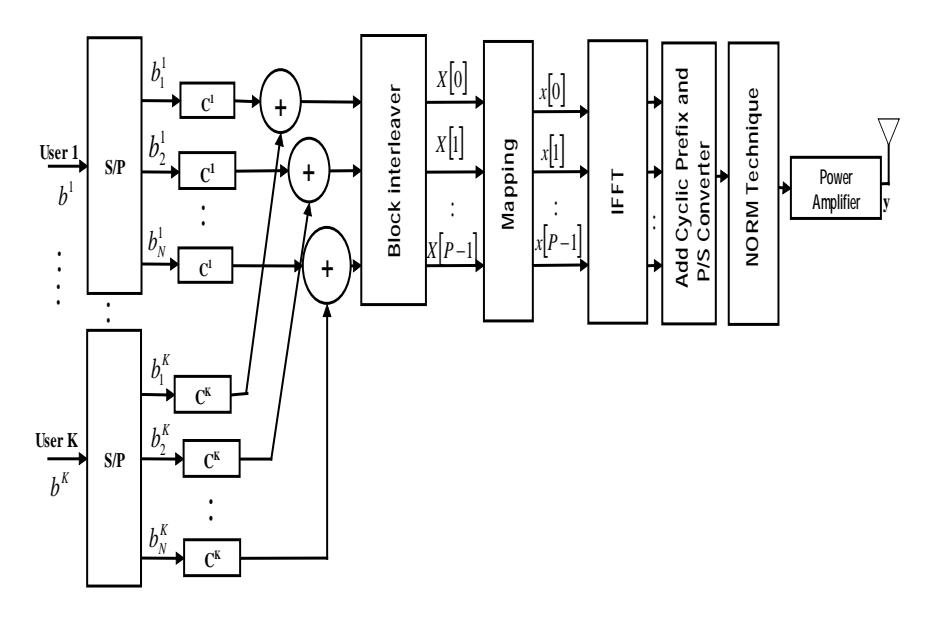
Figure 1 MC-CDMA transmitter with NORM technique.
The interleaved output is mapped with a quadrature amplitude modulation (QAM) constellation and given to IFFT. Then, the IFFT output is given as x(t), as shown in Eq. (1) and Eq. (2)
\[x(t) = \sum_{n=1}^{N} \sum_{m=1}^{L} \sum_{k=1}^{K} b_n^k c_m^k e^{j2\pi[N(m-1) + (n-1]t/T_s}\] (1)
\[x(t) = \sum_{p=1}^{p} \sum_{k=1}^{K} b_n^k c_m^k e^{j2\pi pt/T_s}\] (2)
\[0 \le t < T_s\] & \(k = 1, 2, \dots, K\)
where \(T_s\) is the symbol period.
The PAPR of x(t) is given in Eq. (3) as,
\[PAPR = \frac{\max_{0 \le t < T_S} |x(t)|^2}{\frac{1}{T_S} \int_0^{T_S} |x(t)|^2 dt}\] (3)
where R(.) represents the real part of x(t).
MC-CDMA with NORM involves the following steps for PAPR reduction at the transmitter.
Step 1: IFFT is calculated for the mapped data stream x = IFFT(X).
Step 2: Parallel data from IFFT are then arranged serially using a parallel to serial (P/S) converter and cyclically extended to eliminate ICI.
Step 3: The maximum value from the IFFT output is found in Eq. (4) and Eq. (5) as,
\[x_{max} = \max (x_1, x_2, x_3 \dots x_i, \dots x_p);\] (4)
\[x_{max} = x_i (5)\]
Step 4: The parametric form of the maximum norm is defined by introducing the parameter β. is multiplied with the value of β given in Eq. (6) and is given in Eq. (7),
\[\beta . x_{max} = \beta . max(x_1, x_2, x_3 \dots x_i, \dots x_P)\] (6)
\[x_{max} = \beta . x_i \tag{7}\] where 'β' is a parameter that adjusts the PAPR of the transformed output.
Step 5: The output transformed using NORM is given in Eq. (10) and the intermediate steps are given in Eq. (8) and Eq. (9)
\[y = x - \beta \cdot x_i \tag{8}\]
\[y = ((x_1 - \beta. x_i), (x_2 - \beta. x_i), ..., (x_i - \beta. x_i), ..., (x_P - \beta. x_i))\](9)
\[y = ((x_1 - \beta.x_i), (x_2 - \beta.x_i), ..., (1 - \beta). x_i, ..., (x_P - \beta.x_i))\] (10)
The transformed output, which offers a low PAPR in Step 4, is transmitted.
2.1 Selection of β
To determine the practical value of 'β', it is important to examine the appropriate range of average output power, power saving gain and required BER. The Federal Communications Commission (FCC), which is the regulatory body for wireless communications, specifies that the appropriate range of average power that the PA should produce is 63 mw < Pout,ave < 250 mw. The average signal power obtained for various values of β in NORM is listed in Table 1, while the data symbols from [30] were used in the MC CDMA system. It can be seen from the table that for the values of 'β' ranging from 0.2 to 0.9 the required average power for transmission was obtained. Figure 2 shows the performance of NORM with varying 'β'. It can be seen that this method offers better PAPR reduction at β = 0.7 and above.
| Average Signal Power (Watts) | |||||
|---|---|---|---|---|---|
| Data symbol block | β= 0.2 | β= 0.5 | β= 0.7 | β= 0.9 | |
| 11111111111-1-1-1-11 | 0.025 | 0.0606 | 0.1918 | 0.5097 | |
| 1-11-11-11-11-11-11-11-1 | 0.2136 | 0.05786 | 0.1766 | 0.4890 | |
| -1-11-1-11-1-11-1-11-1-11-1 | 0.0134 | 0.0309 | 0.0956 | 0.3532 | |
| 1111-1-1-1-1 1111-1-1-1-1 | 0.0188 | 0.0456 | 0.1434 | 0.4130 | |
| 111-1-1-1-11-1-1-1-111-1-1 | 0.0062 | 0.0346 | 0.1078 | 0.3233 | |
Table 1 Data Symbols with Average Power for Different Values of β
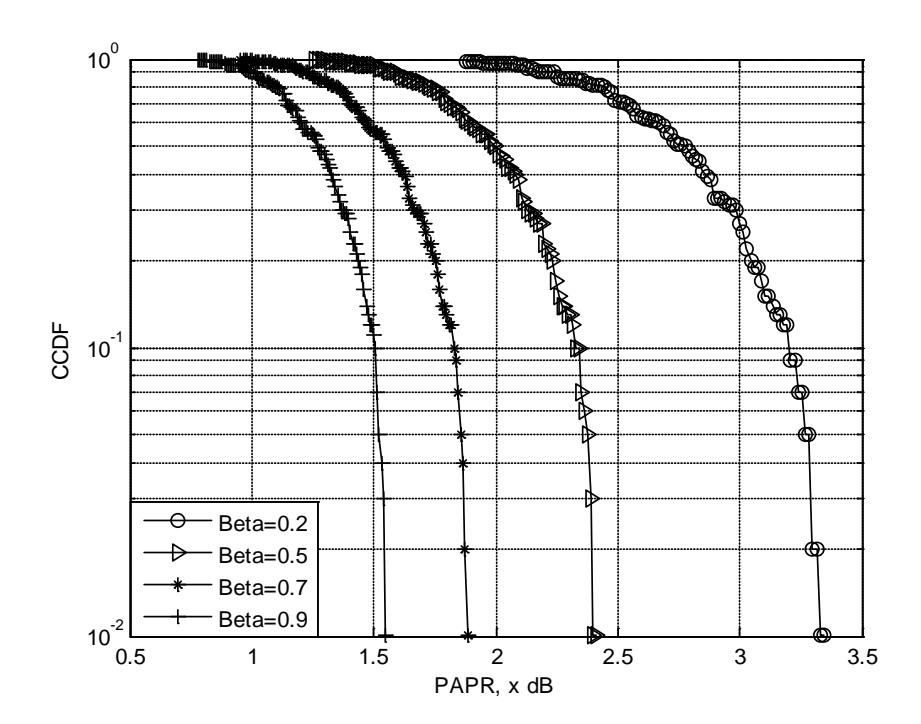
Figure 2 Performance of NORM technique with varying β.
3 MC-CDMA Receiver with Inverse NORM Technique
The MC-CDMA receiver with inverse NORM technique is shown in Figure 3.
The data signal picks up additive noise during its transmission over the wireless medium. The received signal is therefore down-converted and filtered to remove high-frequency components.
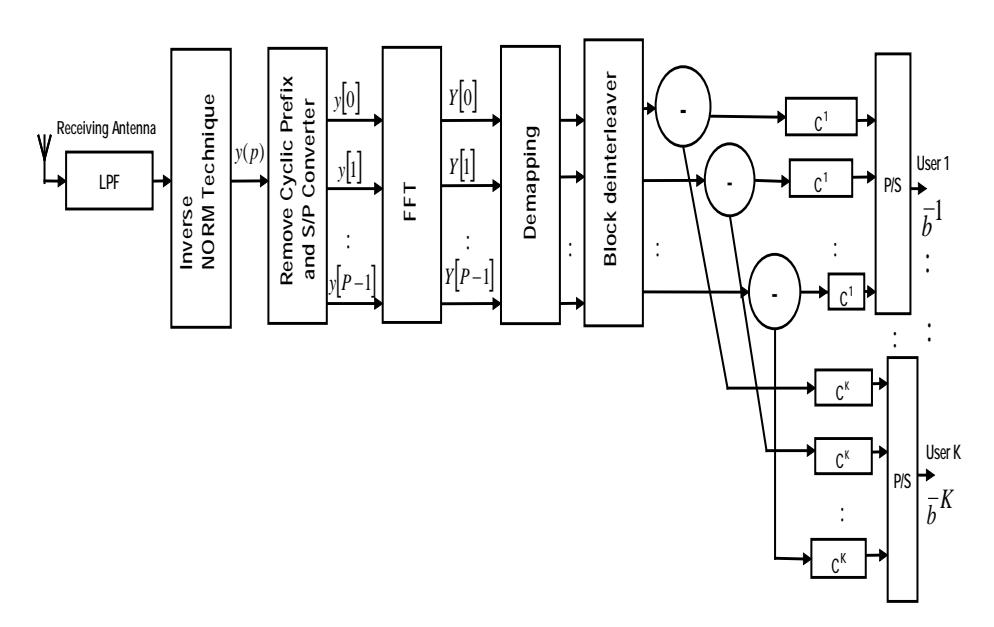
Figure 3 MC-CDMA receiver with inverse NORM technique.
The steps involved in the MC-CDMA receiver with inverse NORM technique are as follows:
Step 6: Receive the transmitted data block y.
Step 7: From the received data block, the minimum value 'min(y)' is found in Eq. (11) and Eq. (12) as,
\[min(y) = min(x_1 - \beta. x_i), (x_2 - \beta. x_i), ..., (1 - \beta). x_i, ..., (x_P - \beta. x_i))\](11)
\[min(y) = (1 - \beta). x_i\](12)
Step 8: The minimum value obtained in Step 2 is divided by (1 − ) to obtain xi in Eq. (13) as,
\[\frac{x_i \min(y)}{(1-\beta)} = x_i \tag{13}\]
Step 9: The value of 'x' is obtained by adding (. ) with y. From Eq. (10),
\[x = y + \beta . x_i \tag{14}\]
Using Eq. (10) and substituting in Eq. (14) we get x, as shown in Eq. (15) and Eq. (16)
\[x = ((x_1 - \beta.x_i + \beta.x_i), (x_2 - \beta.x_i + \beta.x_i), ..., (x_i - \beta.x_i + \beta.x_i), ..., (x_i - \beta.x_i + \beta.x_i))\] (15)
\[x = (x_1, x_2, ..., x_i, ..., x_P)\] (16)
Step 10: Cyclically extended data are removed. Serial data are then converted into parallel using serial to parallel (S/P) conversion.
Step 11: FFT accepts parallel data for its operation. The actual data block X is obtained by performing FFT for the data block in Step 9. Parallel output data from FFT are converted into serial. Demapping is performed over the serial data, after which they are de-spread for original data recovery.
The inverse transformation technique at the receiver effectively recovers the original data blocks without SI. Hence, data rate loss caused by the transmission of additional bits of SI is avoided. It can also be seen that this method reduces the PAPR with less computational complexity. The algorithm satisfies the property of one-to-one transformation necessary for reconstruction at the receiver.
4 Reconstruction Proof for NORM Technique
Reconstruction of the receive vector is possible only if the transform is one to one. The IFFT sequence is as follows
\[x = (x_1, x_2, \dots x_p) \tag{17}\]
The transform sequence is represented in vector form as follows
\[x' = (x_1', x_2', \dots, x_p') \tag{18}\]
Using NORM, the maximum value in Eq. (17) is \(x_i\). Similarly in Eq. (18), the maximum value is \(x_j'\). The f(x) and f(x') are expressed in Eq. (19) and Eq. (21).
\[f(x) = x(P) - \beta. x_i \tag{19}\]
\[f(x) = (x_1 - \beta. x_i, x_2 - \beta. x_i, \dots x_P - \beta. x_i)\] (20)
\[f(x') = x'(P) - \beta . x_i' \tag{21}\]
\[f(x') == (x'_1 - \beta . x'_j, x'_2 - \beta . x'_j, \dots \dots x'_P - \beta . x'_j)\] (22)
The one-to-one relationship is f(x) = f(x') if x = x' by Eq. (20) and Eq. (22). Eq. (23), Eq. (24) and Eq. (25) are as follows,
\[x(P) - \beta . x_i = x'(P)\beta . x_i' \tag{23}\]
\[(x_{1} - \beta. x_{i}, x_{2} - \beta. x_{i}, ... x_{P} - \beta x_{i}) = (x'_{1} - \beta. x'_{j}, x'_{2} - \beta. x'_{j}, ... x'_{P} - \beta. x'_{j})\] \[(i.e) \quad x_{1} - \beta. x_{i} = x'_{1} - \beta. x'_{j}\] \[x_{2} - \beta. x_{i} = x'_{2} - \beta. x'_{j}\] \[x_{P} - \beta. x_{i} = x'_{P} - \beta. x'_{i}\] \[(25)\]
Case 1: If f(x) is the minimum value occurring at position i and f(x') occurs at position j, then f(x) = f(x') if i = j
\[x_{i} - \beta.x_{i} = x'_{i} - \beta.x'_{i}\] \[x_{i} - x'_{i} = \beta.x_{i} - \beta.x_{i}\] \[x_{i} - x'_{i} = \beta (x_{i} - x'_{i})\] \[(1 - \beta)(x_{i} - x'_{i}) = 0\] (26)
The \(\beta\) value lies in the optimum range from 0.1 to 0.9. So in Eq. (27), (1-\(\beta\)) is not equal to zero. Hence \(x_i - x_i' = 0\), Eq. (28) gives,
\[x_i = x_i' \tag{28}\]
Case 2: If \(x_i = x_j'\), assume that the maximum ranges of values are equal so Eq. (26) becomes,
\[x_{i} - \beta.x_{i} = x'_{i} - \beta.x'_{j}\] \[x_{i} - x'_{i} = \beta(x_{i} - x_{j})\] \[x_{i} - x'_{i} = 0\] \[x_{i} = x'_{i}\] (30)
This is the proof for the reconstruction procedure, which is shown in Eq. (29) and Eq. (30).
5 Power Saving and Amplifier Efficiency
Amplifier efficiency performance in the NORM technique was analyzed with a linear class A power amplifier (PA). In practical multicarrier systems, the linear amplifier imposes a nonlinear distortion if excited by a large input. Nonlinear distortion causes out-of-band radiation that affects the signals in adjacent bands and in-band distortion that results in attenuation and offset on the received signal [31].
The efficiency of the class A power amplifier is defined in Eq. (31),
\[\eta_{PA} = \frac{\bar{P}_{out}}{P_{DC}} \tag{31}\] where \(\bar{P}_{out}\) is the average output power and \(P_{DC}\) is the total DC power consumed by the PA (in Watts). The PA's efficiency in terms of PAPR is given as.
\[\eta_{PA} = \frac{0.5}{PAPR} \tag{32}\]
From Eq. (32), the overall DC power consumed by the PA is as follows,
\[P_{DC} = 2 \times \bar{P}_{out} \times PAPR \tag{33}\]
The significance of PAPR reduction is shown in Eq. (33). If PAPR is reduced, then consumed DC power \(P_{DC}\) is reduced for the same average power level of \(\bar{P}_{out}\). Then from Eq. (33), power saving is given as,
\[P_{saving} = 2 \times \bar{P}_{out}(PAPR_b - PAPR_a) \tag{34}\]
From Eq. (34), \(PAPR_b\) is the DC power consumed by the PA before PAPR reduction and \(PAPR_a\) is the DC power consumed by the PA after PAPR reduction. The power saving gain is as follows,
\[G_{saving} = \frac{P_{saving}}{\bar{P}_{out}} \tag{35}\]
\[G_{saving} = 2(PAPR_b - PAPR_a) \tag{36}\] where \(PAPR_b\) and \(PAPR_a\) are in linear scale.
6 Performance Analysis of NORM in MC-CDMA System
Many factors were considered for a performance analysis of PAPR reduction. These factors include PAPR reduction capability, power saving gain, amplifier efficiency, BER, computational complexity, and side information. The performance of the NORM technique was tested with random data. The simulation parameters are summarized in Table 2.
Table 2 Simulation Parameters.
| Parameters | Specification | ||
|---|---|---|---|
| Spreading code and code length L | WH & 32 | ||
| Number of users K | 16 | ||
| Channel bandwidth | 20 MHz | ||
| Carrier frequency | 2.4 GHz | ||
| Total number of subcarriers P | 128 | ||
| Modulation scheme | QAM | ||
6.1 PAPR Reduction Capability
Figure 4 shows the CCDF performance of the NORM technique compared with PTS and the conventional technique without PAPR reduction in the MC-CDMA system. It was observed that, for a CCDF of 10-3 , NORM had a PAPR of 6.8 dB, whereas PTS and the conventional technique without PAPR reduction had a PAPR of 9 dB and 9.8 dB respectively. Thus, the NORM technique had better PAPR reduction than PTS and the conventional technique without PAPR reduction due to the optimized value of β.
Figure 5 shows the CCDF performance of the NORM technique compared with SLM and the conventional technique without PAPR reduction in the MC-CDMA system. It was observed that, for a CCDF of 10-3 , the NORM technique had a PAPR of 6.8 dB, whereas SLM and the conventional technique without PAPR reduction had a PAPR of 8.4 dB and 9.8 dB respectively. Thus, the NORM technique had better PAPR reduction than SLM and the conventional technique without PAPR reduction due to the optimized value of β.
It was observed that, for a CCDF of 10-3 , the NORM-based MC-CDMA had a PAPR of 6.8 dB, whereas the OFDM-based system [30] had a PAPR of 8.1 dB. Hence, it was proved that the NORM-based MC-CDMA system had a 21.25% PAPR reduction when compared to the OFDM-based system.
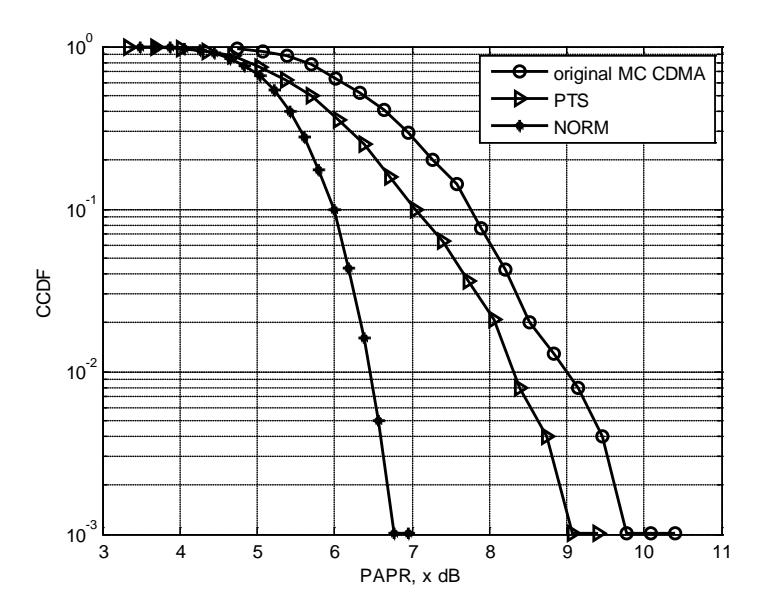
Figure 4 CCDF performance of NORM technique with PTS and conventional technique without PAPR reduction in MC CDMA system.
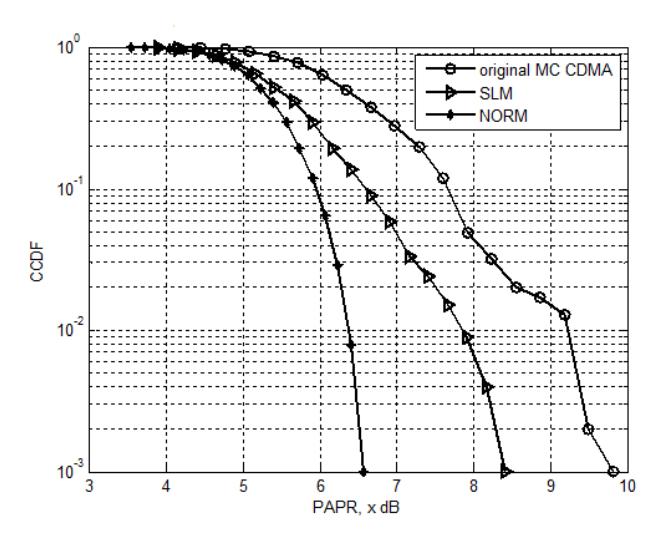
Figure 5 CCDF performance of NORM technique compared with SLM and conventional technique without PAPR reduction.
6.2 Power Saving Gain and Amplifier Efficiency
The power saving gain of the NORM technique was computed using (36) and the required PAPR values were obtained from Figure 4 and 5, at a clipping probability level of 10-3 . Power saving gain values were compared with results from the existing PTS and SLM, as shown in Figure 6. It can be noted that the NORM technique offered a better power saving gain than the other techniques due to the smaller number of iterations and reduced computational complexity.
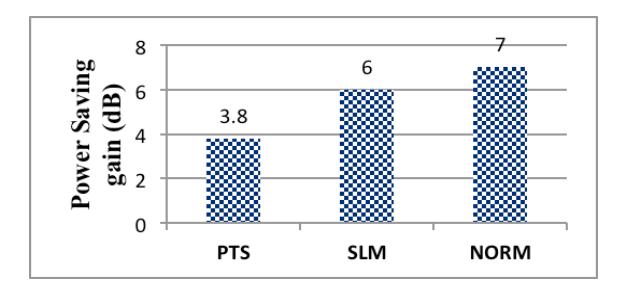
Figure 6 Power saving gain analysis of NORM compared with PTS and SLM techniques.
The amplifier efficiency of the NORM technique was computed using (32) and the required PAPR values were obtained from Figure 4 and 5, at a clipping probability level of 10-3 . The amplifier efficiency values were compared with conventional PTS and SLM, and the conventional technique without PAPR reduction in the MC-CDMA system, as shown in Figure 7. It can be seen that the NORM technique improved amplifier efficiency greatly when compared to conventional PTS and SLM, and the conventional technique without PAPR reduction in the MC-CDMA system.
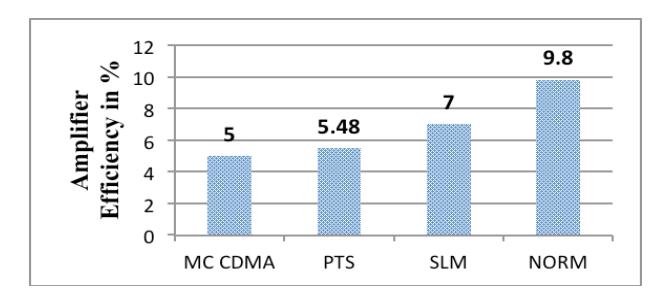
Figure 7 Amplifier efficiency analysis of NORM compared with PTS, SLM and conventional technique without PAPR reduction.
6.3 BER Evaluation
Figure 8 shows the BER performance of the NORM, PTS and SLM techniques in the MC-CDMA system. It was observed that the NORM technique required an SNR of 8 dB, whereas SLM and PTS required an SNR of 10 dB and 13 dB respectively to achieve a BER of 10-2 . Thus, the NORM technique provided better BER performance than PTS and SLM due to less computation with the NORM technique.
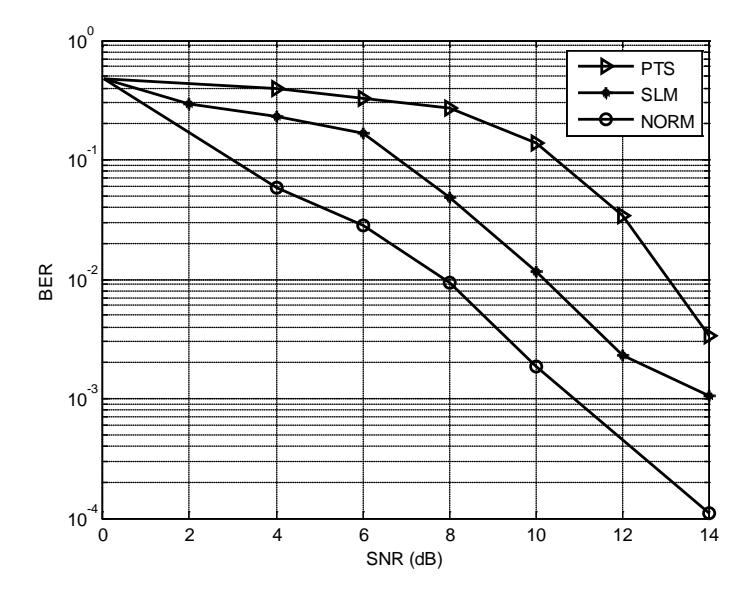
Figure 8 BER performance of NORM, PTS and SLM.
6.4 Computational Complexity
Computation complexity is expressed in terms of complex multiplication and complex addition involved in IFFT operation. The number of subcarriers used was P = 2, where n is the number of bits. The total number of IFFTs is represented as T. The complex multiplication and additions required for T IFFTs are (P/2)nT and TnP respectively. The NORM technique needed (2P+1) additional operations for finding the maximum value. One IFFT block was used in the NORM technique, whereas SLM and PTS techniques required T IFFT blocks.
The computational complexity reduction ratio (CCRR) for the NORM technique over conventional techniques (PTS or SLM) is given in Eq. (37) as,
\[CCRR = 1 - \frac{Cmoplexity of the NORM Technique}{Complexity of the conventional Technique}\](37)
Table 3 shows the computational complexity for NORM and the conventional techniques (PTS and SLM). The CCRR of the NORM technique over the conventional techniques was evaluated in terms of its complex multiplications and complex additions.
| Table 3 | Computational Complexity for NORM and Conventional Techniques. |
|---|
| Conventional Technique (PTS and SLM) | NORM Technique | CCRR (in percentage) | ||
|---|---|---|---|---|
| Number of IFFT's | 8 | 1 | ||
| Multiplication | P=16 | 256 | 65 | 74.60 |
| P= 64 | 1536 | 321 | 79.10 | |
| P=256 | 8192 | 1537 | 81.23 | |
| P=512 | 18432 | 3329 | 81.93 | |
| P=1024 | 40960 | 7169 | 82.49 | |
| Addition | P=16 | 512 | 97 | 81.05 |
| P=64 | 3072 | 513 | 83.30 | |
| P=256 | 16384 | 2561 | 84.36 | |
| P=512 | 36864 | 5633 | 84.72 | |
| P=1024 | 81920 | 12289 | 85.00 |
Figure 9 shows the CCRR performance of the NORM technique for varying number of subcarriers. It can be noted that greater reduction in complexity was achieved in the NORM technique over the conventional techniques (PTS and SLM). CCRR performances showed that the NORM technique is best suited for large subcarrier systems.
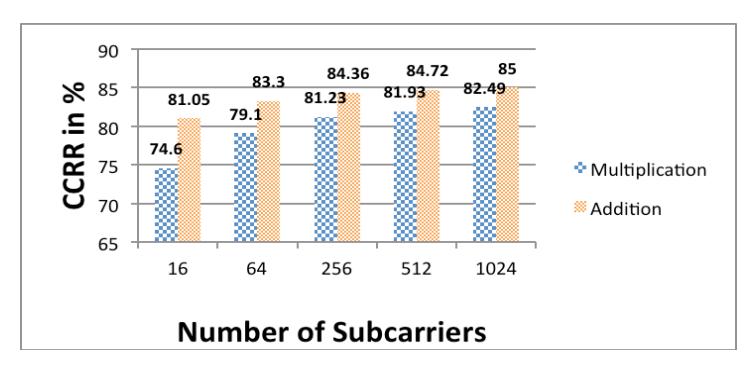
Figure 9 Computational complexities of NORM and conventional PTS and SLM techniques.
6.5 Side Information
An important parameter in the PAPR reduction scheme to be analyzed is side information (SI), which is transmitted to the receiver to extract the original information. The NORM technique satisfied the property of one-to-one transformation, which is necessary to extract the original information at the receiver. Thus, the NORM technique did not require any side information. Therefore, the NORM technique increased bandwidth efficiency and reduces the data rate loss.
7 Conclusions
In this study, an efficient PAPR reduction technique for MC-CDMA systems, the NORM technique, was analyzed. Simulation results showed that NORM outperformed PTS and SLM for PAPR reduction in an MC-CDMA system with NORM. It was observed that NORM improved PAPR reduction and provided a better power saving gain and amplifier efficiency, with less BER. The MC-CDMA system with NORM had low computational complexity due to a smaller number of iterations. The NORM technique satisfies the property of one-to-one transformation, which is necessary for reconstruction of the original information at the receiver. Hence, the NORM technique does not require any side information.