
1 Introduction
According to the United Nations (UN) [1], e-government is the use of information and communication technology (ICT) and its application by a government in providing information and public services to the people. A broader concept refers to it as the use and application of information technologies in public administration to streamline and integrate workflows and processes, to effectively manage data and information, enhance public service delivery, as well as expand communication channels for the engagement and empowerment of the people [2]. The UN has developed a four-stage maturity
model of e-government, i.e. emerging, enhanced, transactional and connected/ networked [3]. At least 25 other models of e-government maturity have been proposed [4], comprising 3 stages, as defined by Howard, up to 6 stages, as defined by Wescott. E-government can be seen as having three dimensions [5], i.e. the democratic dimension, the service dimension and the administrative dimension, while the stakeholder relationship can be classified into four types [6] namely G2C (government to citizen), G2E (government to employee), G2B (government to business), and G2G (government to government).
ICT was officially introduced as public administration service support in Indonesia through Presidential Directive No. 6/2001 [7]. It states that all Indonesian government levels have to use ICT as a prerequisite for achieving good governance. As of June 2014, Indonesia had 542 local governments, comprising 34 provinces, 415 regencies and 93 cities [8]. Prior studies found that most local governments in the country were still at the lowest stages of egovernment development. Only less than 20% of local governments was at the second stage (interact), while most of them were still at the first stage (publish) [9].
There is an agreement that the ultimate goal of e-government is to attain good government governance (GGG). The term "governance" is defined by the World Bank as the manner in which power is exercised in the management of a country's economic and social resources for development [10]. The World Bank, from its lending experience in many developing countries came to realize that "good governance" is central to creating and sustaining an environment that fosters strong and equitable development and that it is an essential component for sound economic policies. Okot-Uma [11] defines good governance as the processes and structures that guide political and socio-economic relationships, with particular reference to "commitment to democratic values, norms and practices; trusted services; and to just and honest business". According to the UN, there are 8 (eight) principles of good governance [12], i.e. participation, rule of law, transparency, responsiveness, consensus oriented, equity and inclusiveness, effectiveness and efficiency, and accountability.
The definition of e-government itself implies the support of good governance. As an example, the European Union (EU) interprets e-government as "… the use of Information and Communication Technologies in public administrations and the associated processes of organizational change and skills development to enhance democratic processes and contribute to good governance and policy making…" [13]. Also, the World Bank states about e-government, "… The resulting benefits can be less corruption, increased transparency, greater convenience, revenue growth, and/or cost reductions…" [14]. Therefore, the function of e-government is not only to support the improvement of service
functionality and service delivery but also to promote good governance values, such as encouraging democratization, reducing corruption, increasing efficiency and supporting government transparency.
While e-government supports and promotes good governance, the progress and advancement of e-government are actually determined by the principles of good governance, such as law enforcement, state administration efficiency and effectiveness, public participation, and fairness. Several researches have been conducted in Indonesia to examine the impact of e-government implementation on good governance [15-18]. These researches only examined good governance achievement after e-government implementation, while the achievement of egovernment implementation itself was not studied. Likewise, the mutual relationship between e-government and good governance was not studied.
Massive amounts of funding and resources have been spent on e-government initiatives in Indonesia. The Ministry of Communication and Informatics allocates at least 150 million dollars to it each year in its annual budget. The ± 500 local governments (provinces, regencies, and municipalities) have also spent large funds on the implementation of e-government for many years. Still, good governance in the country has not achieved satisfactory results. A survey by the World Bank from 2013 [19] ranked Indonesia in a position below 100 from 190 countries studied, for almost all good governance indicators. For example, in government effectiveness, Indonesia was ranked 103, below its neighbors in South East Asia like Singapore (2), Malaysia (35), Thailand (72) and Philippines (79). Likewise in terms of control of corruption, Indonesia was only positioned at number 130. In the context of Indonesia's regions, many corruption cases have actually been discovered in local governments that have received an e-government award.
The objective of this study was to examine whether high achievement in egovernment, as indicated by a high ranking in e-government assessments, ensures a good reputation in terms of good governance by the Indonesian government. Hence, it could be measured if the assessments have been appropriate for the final aim of e-government itself viz. good governance. Conversely, this study also explored if a high ranking in good governance assessment resulted in a good achievement of e-government.
2 Literature Review
According to Heeks [20], information and communication technologies can make a significant contribution to the achievement of good governance goals where the governance will be more efficient and more effective. His paper outlines the three main advantages of e-government, i.e. improving government
processes (e-administration), connecting citizens (e-citizens and e-services), and building external interactions (e-society). Kalsi, et al. [21] affirm that egovernment initiatives have a direct impact on citizens, in which the citizens derive benefit through direct transactions with governmental services. Another study, by Islam [22], has shown that countries with better information flows have better governance quality. In addition, Saidi and Yared [23] have provided a model in which better information for citizens improves the efficiency of the political market process, which will generate greater and a more effective representation and participation, leading to better governance and democracy.
A clear rationale of e-government as a vehicle for the promotion of good governance is provided by Haldenwang [24]. The reason lies in its dualistic approach of state modernization: it combines an internal focus on administrative reform with an external focus on state – citizen (or state – customer) relations. E-government is seen as a tool to simultaneously increase public administration efficiency, improve public service delivery, and strengthen the political process' openness and transparency. Table 1 presents papers about good governance as an implication of e-government implementation.
Table 1 Research Publications on Good Governance as an Implication of e-Government.
| Study | Views/Findings |
|---|---|
| Alaaraj and | E-government practices have a positive and significant influence on good |
| Ibrahim (2014) | governance. Particularly, good governance is positively and significantly |
| influenced by e-service but not by e-administration and e-procurement [25]. | |
| Ali and Mujahid | E-government is a tool of practice in the re-invention of governance and as |
| (2015) | a mechanism for promotion of good governance. The objectives of e |
| governance and good governance are quite similar to each other, making | |
| government accountable, transparent, responsive, effective and efficient | |
| [26]. | |
| Basu (2004) | In e-governance, 'electronic' means to support and stimulate good |
| governance. Therefore, the objectives of e-governance are similar to the | |
| objectives of good governance [27]. | |
| Bertot, et al. | E-government and social media have potential impacts on cultural attitudes |
| (2010) | about transparency [28]. |
| Fang (2002) | E-government provides citizens and businesses with more convenient |
| access to government information and services, improves the quality of the | |
| services, and provides greater opportunities to participate in democratic | |
| institutions and processes [29]. | |
| Haldenwang | E-government is a vehicle for the promotion of good governance. It is seen |
| (2002) | as a tool to simultaneously increase public administration efficiency, |
| improve public service delivery, and strengthen the openness and | |
| transparency of political processes [24]. | |
| Heeks (2001) | Information and communication technologies have significant contribution |
| in achieving good governance goals, make governance more efficient and | |
| effective [20]. | |
| Islam (2003) | Countries with better information flows also have better quality governance |
| Study | Views/Findings |
|---|---|
| [22]. | |
| Jansen (2012) | Efficiency, effectiveness and strengthening democratic functions are the |
| visions and goals for the use of ICT in the public sector [30] | |
| Kalsi et al. (2009) | E-government initiatives have a direct impact on citizens. Transformation |
| from traditional governance to e-governance leads to good governance [21]. | |
| Madzova et al. | The ultimate goal of the e-government is to be able to offer the public |
| (2013) | services to citizens in an efficient and effective manner, which is also the |
| good governance maxim [31]. | |
| Okot-Uma (2000) | E-governance is a mode of practice in the re-invention of good governance |
| [32]. | |
| Saidi & Yared | Citizens with more and better information improve the efficiency of the |
| (2002) | political market process, generates greater and a more effective |
| representation and participation, leading to better governance and | |
| democracy [23]. |
Alaaraj and Ibrahim [25] in their theoretical framework research show four hypotheses they used to study the influence of e-government practices on good governance in Lebanon. Using the causal relationship model, they proposed that e-government and each of its selected parts, i.e. e-service, e-administration and e-procurement, have a significant and positive influence on good governance. The main research outcomes indicated that in general, e-government practices have a positive and significant influence on good governance. Good governance is positively and significantly influenced by e-service in particular, but not by eadministration and e-procurement.
Conversely, success stories of e-government also need good governance practices. Heeks [20] and Alpar [33] state that the laws, regulations and legal framework must be in place to permit and support e-government. Also, collaboration and cooperation at local, regional and national levels, as well as between public and private organizations, are important elements in the egovernment development process [34]. Schuppan [35] highlights e-government implementation in sub-Saharan Africa, which needs efficient and effective state administration as a necessary prerequisite. The implementation still faces some challenging conditions such as low level of democratization, overstaffing and clientelism. Therefore, the development potential of e-government can only be realized if certain minimum preconditions exist in the country in question, or if they are taken into consideration during implementation. Another challenge for implementing e-government [36] is opportunism by vendors and other external actors. Countries that are willing to implement e-government following best practices should have a strong efficient state ex ante, as e-government may not be sufficient to improve state capacity per se.
Therefore, it can be concluded that on the one hand, e-government promotes good government governance, while on the other hand successful e-government
implementation requires pre-conditions for good governance practices. While it seems obvious that these two concepts influence each other, there is still only a limited number of studies that have quantitatively measured the correlation of the two.
To measure the success of a single program or activity, an assessment must be performed, which can be approached using a logic model. For a logic model that explains how a program activity can successfully lead to a desired outcome, five elements have been proposed in [37], i.e. resources or inputs, program activities, outputs, outcomes and impacts. The last component is the fundamental intended or unintended change occurring within the organizations, communities or system as a result of the program activities. This logic model can be implemented in all fields of research including ICT. A logic model for an e-government implementation framework has been built by Millard, et al. [38] in order to analyze e-government policy objectives. The framework consists of four levels: inputs, operational objectives (outputs), specific objectives (outcomes), and general objectives (impacts). Heeks [39] has developed a value chain model as a summary of the way in which e-government can turn inputs into outcomes. Readiness, availability, uptake, and impact are the four levels of activity in Heek's model and their indicators are determined by several stages: precursors, inputs, intermediates, outputs, impacts, and outcomes.
In measuring specific accomplishments of e-government implementation in countries worldwide, the United Nations of Public Administration Network (UNPAN) regularly conducts assessments and publishes reports such as the E-Government Development Index. The last assessment was held in 2014 for 193 countries. Developed countries still led the ranking, while most of the developing countries, like Indonesia, were still far behind. The Republic of Korea was positioned at the top of the list in 2014, as in 2012, followed by Australia and Singapore [2].
E-government assessment has been performed regularly in Indonesia since around a decade ago, particularly at city/regency level. These assessments are: e-Government Ranking Indonesia, or Pemeringkatan e-Government Indonesia (PeGI) [40], Information and Communication Technology (ICT) Pura [41], e-Government Award (e-GovAward) [42] and Indonesia Digital Society Award (IDSA) [43]. Table 2 provides a summary of each assessment.
Generally, similar results were obtained from these assessments. For example, in the year 2011-2013, the top 10 (ten) cities/regencies in one e-government achievement also won in other assessments.
Table 2 Comparison of E-Government Assessment in Indonesia.
| Name | Organizers | Goals | Dimension | Assessment System |
|---|---|---|---|---|
| E-Government Ranking Indonesia (PeGI) | Department of Communication and Information | • Providing a reference for ICT development and use • Giving Impetus to ICT improvement • Looking at the map of ICT environmental conditions | • Policy • Infrastructure • Institutional • Application • Planning | Summing up all of values obtained from all dimensions, in which the weight of all dimensions is the same. |
| ICT Pura | Department of Communication and Information | • Knowing the level of readiness • Measuring gap between target and actual conditions • Providing motivation, support, appreciation, and incentives for cities and regencies | • Needs and harmony • Process and implementati on in governance •Communities and community groups • Technology resources • Output and benefits | ICT Pura Index = NRIU*40% + NRIR*20% + NRIC*25% + NRII*15% NRIU = average of component ICT (ACI) usage NRIR = ACI readiness NRIC = ACI capability NRII = ACI impact |
| E-Government Award (e-Gov Award) | Warta Ekonomi Media Group and SWA | •Rewarding government agencies that have implemented IT in their public service • Providing encouragement to government agencies | • Website • Implementati on • Infrastructure | • Website (weight 10%). • E-government implementation assessment (weighted 45%) • E-government infrastructure assessment (weighted 45%) |
| Indonesian Digital Society Award (IDSA) | Telkom and IMA | • Mapping, measuring and appreciating cities and regencies related to readiness to enter digital age • Increasing the use of ICT in each city / district | • Initiative • Leadership • Usership •Benefit | • Initiative (weighted 10%) • Leader-ship (weighted 10%) • Usership (weighted 60%) • Benefit (weighted 20%) |
In terms of good government governance, assessments were performed by either governmental or non-governmental organizations (NGOs). The assessments are the Indonesian Governance Index (IGI) by the Partnership, the Performance Local Economic Governance (TKED) by Regional Autonomy Watch, Public Disclosure by the Central Commission of Information, the Ranking of Local Government Performance Accountability by the Ministry of Administrative Reform, the Corruption Perception Index (CPI) of Indonesia arranged by the Transparency International Indonesia (TII), and the Budget Disclosure Index Indonesia Forum by the Budget Transparency (FITRA), see Table 3.
Table 3 Comparison of Good Governance Assessment in Indonesia.
| Assessment Name Indonesian Governance Index (IGI) | Organizers Partnership | Category Four areas: • Government (30.2%) • Bureaucracy (32.3%) • Civil society (20.8%) • Economic society (16.7%) Six governance principles: • Participation (12%) • Fairness (18.9%) • Accountability (25.9%) • Transparency (19%) • Efficiency (11.7%) |
| Public Disclosure (PD) | Central Commission of Information | • Effectiveness (12.4%) Indicators: • Information announcement (40%) • Information availability (30%) • Information service (30%) |
| Assessment steps: • Step 1: Self assessment questioner and website verification (60%) • Step 2: Visitation by interview and direct verification (40%) | ||
| Local Economic Governance (TKED) | Regional Autonomy Watch (KPPOD) | Indicators: • Access to land • Local infrastructure • Business licenses • Local laws of regulations • Transaction costs • Capacity and integrity of regent / mayors • Local government interaction with business • Private business development programs • Security and conflict resolution |
| Budget Information Disclosure Index | Indonesian Forum for Budget Transparency (FITRA) | Two main criteria: • Budget information availability • Budget information accessibility |
| Assessment Name | Organizers | Category |
|---|---|---|
| Corruption Perception Index (CPI) | Transparency International Indonesia (TII) | • An aggregate indicator that combines the data over the last 2 years of the published surveys by various independent agencies • These sources measure the entire spectrum of corruption (frequency and/or size of bribes) in the public sector and politics, and all these sources generate city / regency indexes • Assessment of the level of corruption in each region carried out by two groups: 1) a group of experts, 2) private sector |
In the Indonesian context, Presidential Instruction No. 6/2001 declares that the government of Indonesia must use ICT to support good governance. ICT can promote accountability and public participation. According to Kurniawan [15] these instruments are important to eradicate bureaucratic corruption. Retnowati and Retnowati [16] also have stated that e-government implementation provides several advantages, such as transparency, accountability, and efficiency. Unfortunately, the paper only provides qualitative descriptions and results. Meanwhile, a study by Kurniasih, et al. [17] measured that the implementation of e-government policies contributes as much as 54.85% to the government's official performance in Cimahi Municipality, based on the structural equation modeling method. A study by Afriani and Wahid in Jambi municipality [18] measured the impact of e-government on the business sector viewed from good governance principles. It used the t-test method, which compares the quality of public services before e-government implementation with the quality after implementation based on the view of businessman using the services. The research provided empirical evidence that e-government implementation improves concern for the stakeholders, effectiveness and efficiency, citizen participation, accountability and transparency. However, the studies in Cimahi and Jambi only examined e-government implementation as a whole and did not consider individual dimensions of e-government or dissect the e-government implementation into detailed aspects.
Several studies have been done in Indonesia for investigating direct impacts of e-government implementation to good governance principles, but these studies did not incorporate e-government implementation achievement measures. Our research tries to fill this gap by finding the measurement of e-government implementation achievement that has impacts on GGG. This study evaluated existing measurements provided by e-government implementation achievement and good government governance assessment institutions, in trying to determine
whether e-government implementation achievement has a correlation with good government governance achievement.
3 Methodology
This research used a correlational model as depicted in Figure 2. In this model, e-government achievement influences on GGG, and vice versa, are examined. The relation is denoted with bidirectional arrows between the two concepts. In contrast to the causal model (see Figure 1), which can see the impact or effect, the correlational model only gives the strength of the relationship, either positive or negative.
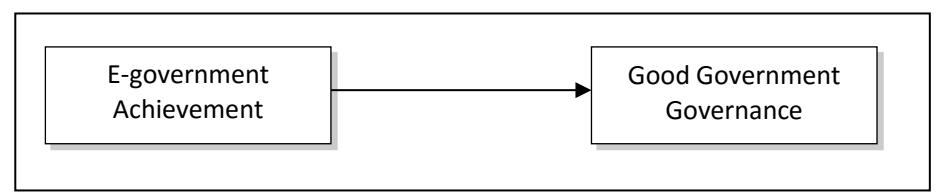
The causal model, in which e-government achievement influences good government governance.
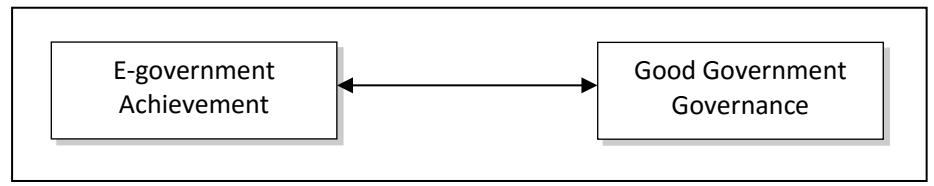
The conceptual model of the correlation between e-government achievement and good government governance. This model gives the strength of the relationship between the two entities.
Figure 1 Causal model and conceptual model.
A conceptual model is shown in Figure 2 based on e-government assessment (PeGI) and good government governance assessment (IGI), in which each of the e-government dimensions and good governance dimensions relate to each component within their own group and influence other components in the other group.
Secondary data were collected from institutions that have conducted egovernment implementation and good governance assessment. The collected data were then compared to each other to determine their relationship's strength. To simplify the analysis, a provincial level unit analysis was selected, and the Indonesian E-Government Rankings (PeGI) was selected to represent egovernment achievement, while for GGG, the selected assessments were the Indonesian Governance Index (IGI) and Public Disclosure (PD). The PD assessment measures good governance only on the dimension of transparency.
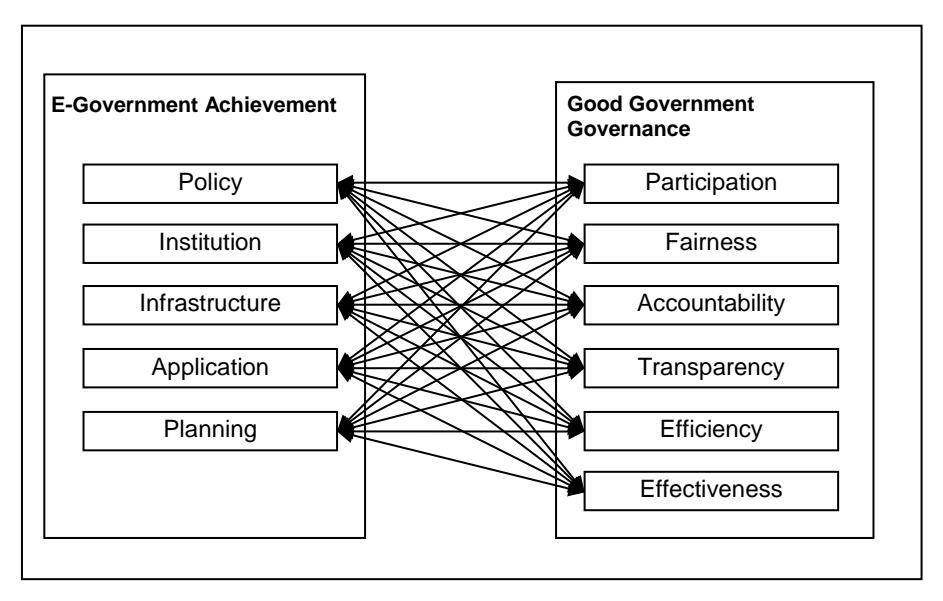
Figure 2 The detailed conceptual model 1: correlations between e-government achievement and good government governance based on PeGI and IGI assessment.
The conceptual model was operationalized with a clear and precise value for each indicator to avoid misinterpretation or measurement errors. E-government achievement and GGG achievement were split into their variables, as shown in Table 4.
To determine the relationships, a Spearman's rank correlation coefficient (r) was calculated. The coefficient was used to measure the degree of association between two variables with a non-normal distribution (not realistic), or in a condition that the data are in the form of ranks or are otherwise on an ordinal scale [44]. The use of this coefficient assumes that neither variable is functionally dependent upon the other. It is commonly used in nonparametric correlations [45].
Table 4 Operational Variables.
| Variable | Definition | Dimension/Indicator | Scale |
|---|---|---|---|
| E-government | Degree of | PeGI: | PeGI: |
| achievement | successful e | • Policy | • 1 - 4 |
| government | • Infrastructure | • 1 - 4 |
| Variable | Definition | Dimension/Indicator | Scale |
|---|---|---|---|
| implementation on national or | • Institutional • Application | • 1 - 4 • 1 - 4 | |
| provincial level | • Planning | • 1 – 4 | |
| Good government governance (GGG) achievement | Degree of successful governance practice on national or provincial level | IGI: • Participation • Fairness • Accountability • Transparency • Efficiency • Effectiveness | IGI: • 1 - 10 • 1 - 10 • 1 - 10 • 1 - 10 • 1 - 10 • 1 – 10 |
| Public Disclosure (PD): • Information announcement • Information availability • Information service | PD: • 1 – 100 • 1 - 100 • 1 – 100 |
In calculating the Spearman correlation coefficient, we ranked all the values of one variable within them from the smallest to the largest and then we independently ranked the observation of the second variable from the smallest to the largest. The Spearman rank correlation coefficient (assuming no ties) was computed from the following equation:
\[r_{\rm S} = 1 - \frac{6\sum_{i=1}^{n} d_i^2}{n(n^2 - 1)} \tag{1}\] where di, i =1, …, n, are the differences in the ranks of xi and yi; di = R(xi) – R(yi).
The value of rs is constrained by design as -1 ≤ rs ≤ 1 and if the value is:
- 1. 1 = variables X and Y are perfectly positively related (meaning that X increases whenever X does, and vice versa)
- 2. -1 = variable X and Y are perfectly negatively related (meaning that X increases whenever Y decreases)
- 3. 0 = there is no relation between X and Y
The strength of the correlation can be described by the following guide, and for the absolute value of rs it can be attributed to the following description:
- 1. 0.00 0.19 = very weak;
- 2. 0.20 0.39 = weak;
- 3. 0.40 0.59 = moderate;
- 4. 0.60 0.70 = strong;
- 5. 0.80 1.00 = very strong.
The sampling design for the entire statistical analysis of the study is summarized in Table 5 and detailed data are included in the appendices (Appendix 1 to Appendix 5). The population of Indonesian governmental institutions is 33 at the provincial level and 34 at the ministry level, but the assessment was not performed equally on all government units. Therefore, the amount of available data was determined by a pair of similar sets of institutions.
The correlation was computed not only for one-to-one assessment as a whole, but also for each indicator of the assessments separately, in order to know the strength of the correlations among them. PeGI 2012 and IGI 2012/2013 were selected in this computed partial correlation as a case.
| E-Gove Assess | Good Governance Assessment Government | D | No. of | |||
|---|---|---|---|---|---|---|
| Name | Assessed Institu- tions | Name | Assessed Institu- tions | Government Level | Popu- lation | Computed Pairs |
| PeGI 2011 | 25 | IGI 2012/2013 | 33 | Province | 33 | 25 |
| PeGI 2012 | 24 | IGI 2012/2013 | 33 | Province | 33 | 24 |
| PeGI 2013 | 21 | IGI 2012/2013 | 33 | Province | 33 | 21 |
| PeGI 2013 | 33 | PD 2014 | 22 | Ministry | 34 | 22 |
| PeGI 2013 | 21 | PD 2014 | 20 | Province | 33 | 13 |
| PeGI 2014 | 22 | PD 2014 | 20 | Province | 33 | 16 |
Table 5 Sampling Design.
4 Results and Discussion
According to the study, there were various correlations between e-government achievement and good governance achievement, as presented in the Table 6.
Table 6 reports that for six correlations examined, only four correlations were categorized as "positive and moderate" and none of the listed correlations could be classified as "positive and strong" or "positive and very strong". The remaining two positive correlations only had a weak-link or very-weak-link correlation. The average value of five Spearman correlation coefficients was 0.32, which means that e-government performance does not have much correlation with the achievement of good governance.
Governance Achievement. No. Correlation Spearman Rank Correlation Interpretation
Table 6 Correlation between e-Government Achievement and Good
1. PeGI 2011 vs. IGI 2012/2013 0.50 There is a positive and moderate correlation between e-government achievement and good governance achievement. 2. PeGI 2012 vs. IGI 2012/2013 0.41 There is a positive and moderate correlation between e-government achievement and good governance achievement. 3. PeGI 2013 vs. IGI 2012/2013 0.18 There is a positive and very weak correlation between e-government achievement and good governance achievement. 4. PeGI 2013 vs. PD 2014 (Ministry) 0.32 There is a positive and weak correlation between e-government achievement and good governance achievement. 5. PeGI 2013 vs. PD 2014 (Province) 0.50 There is a positive and moderate correlation between e-government achievement and good governance achievement. 6. PeGI 2014 vs. PD 2014 0.46 There is a positive and moderate correlation between e-government achievement and good governance achievement.
Correlation 1: PeGI 2011vs. IGI 2012/2013
This case shows a fair and positive correlation between e-government and good governance at a rate of 0.5. While some provinces (East Java, DKI Jakarta and D.I. Yogyakarta) were listed at the top five ranking in both PeGI 2011 and IGI 2012/2013 (see Appendix 3), others were not. West Java Province, which won first place in PeGI 2011, was placed fifteenth in the later assessment. A similar situation happened with Aceh Province, which ranked third in the 2011 e-Government assessment but only eighteenth in IGI 2012/2013.
Correlation 2: PeGI 2012 vs. IGI 2012/2013
This case gave slightly less correlation strength (0.09) than the previous one but still provided a positive mediocre link between e-government and good governan to those from the previous year. With a correlation coefficient of 0.41, this result has little distinction from the prior case, which can be explained as we still used IGI 2012/2013 for good governance assessment, while the PeGI 2012 result is not very different from the PeGI 2011 result (see Appendix 1).
Correlation 3: PeGI 2013 vs. IGI 2012/2013
The weak positive connection (0.18) provided by this case is not surprising if we compare the result of PeGI 2013 with the result of IGI 2012/2013. For example, while in the first case there were 6 provinces listed in both the top ten of e-government assessment and good governance assessment, in this case only 3 provinces were listed in the top ten of both these assessments.
Correlation 4: PeGI 2013 vs. PD 2014 (Ministry)
Having a correlation coefficient of only 0.32, this case along with the third case (PeGI 2013 vs. IGI 2012/2013) are the cases in which the relationship strength was below moderate. The Ministry of Finance confirms its good reputation by placing in top position in both PeGI 2013 and PD 2014 at ministry level (see Appendix 2 and Appendix 5). However, the other five ministries included in the top ten of PeGI 2013 are not listed in the top ten of PD 2014. The Ministry of Education and Culture for example, despite its second position in the egovernment assessment, could only achieve nineteenth position in the good governance assessment.
Correlation 5: PeGI 2013 vs. PD 2014 (Province)
This case has the same assessments as the previous case, except that it is organized on provincial level. Providing a positive moderate connection with a correlation coefficient of 0.50, there were five provinces that managed to reach the top ten of PeGI 2013 but were not included in the ten top positions of PD 2014 (see Appendix 1 and Appendix 4). Yet, its correlation was stronger than the one at the ministerial level because the difference in ranking between the egovernment assessment and the good governance assessment was not too great.
Correlation 6: PeGI 2014 vs. PD 2014
The last case also gave a positive moderate correlation between e-government and good governance (0.46), as in most of the other cases. Even though some of the differences in the province's ranks were small, some were not. For instance, West Nusa Tenggara as the number one in PD 2014, only ranked thirteenth in PeGI 2014 (see Appendix 1 and Appendix 4).
Table 7 reports partial correlation coefficients between governance dimensions (IGI) and e-government implementation dimensions (PeGI). Except for accountability, which had a medium significant relationship with application, there was no significant relationship in most of the partial correlation coefficients. The remaining correlations were categorized as weak (12 correlations) and even very weak (17 correlations). This is likely due to the lack of synchronization between the indicators of PeGI dimensions with the indicators of good governance principles. Nevertheless, it can be seen that transparency and effectiveness had relatively stronger correlations than the other indicators in IGI.
Table 7 Partial Correlation Coefficients between e-Government Assessment Dimensions (PeGI 2012) and Good Governance Assessment Dimensions (IGI 2012/2013).
| Indonesia e-Government Rank (PeGI) 2012 | ||||||||
|---|---|---|---|---|---|---|---|---|
| Correlation | Policy | Institution | Infra- structure | Application | Planning | Average | ||
| nce 13 | Participation | 0.068 | 0.063 | 0.077 | 0.155 | -0.084 | 0.056 | |
| Governance .) 2012/2013 | Fairness | 0.165 | 0.294 | 0.145 | 0.174 | 0.176 | 0.191 | |
| 30ve 201 | Accountability | 0.110 | -0.051 | -0.085 | 0.036 | -0.143 | -0.027 | |
| Transparency | 0.365 | 0.289 | 0.332 | 0.499 | 0.351 | 0.367 | ||
| Indonesia Index (IG | Efficiency | 0.009 | 0.277 | 0.239 | 0.081 | 0.040 | 0.129 | |
| In | Effectiveness | 0.287 | 0.349 | 0.367 | 0.267 | 0.205 | 0.295 | |
| Average | 0.167 | 0.204 | 0.179 | 0.202 | 0.091 | |||
There are peculiarities in the results, such as several negative correlations between the dimensions of e-government and good governance indicators. For instance, planning had a negative correlation with accountability, which means that if the quality of planning was good, then it can be predicted that the accountability was low, even though their correlation, as all the negative correlations, was very weak.
Despite the results with a positive moderate correlation between e-government implementation and good governance, in theory, e-government implementation should have a strong correlation with good governance. Some experimental studies have supported this premise. Ali [26] and Basu [27] state that the objectives of e-government and good governance are quite similar to each other. Previous researches have shown that e-government implementation has a positive and significant influence on good governance [15,21,22,25,39] or that the success of e-government implementation demands good governance practices [20,33-36].
As e-government and good governance goals are alike, they must also have similar principles and their assessments should have corresponding measurements. E-government assessment in Indonesia, in this case PeGI, has five dimensions, i.e. policy, institution, infrastructure, application, and planning. By applying the assessment dimensions to Heek's logic model, it can be seen that the policy, institution and planning indicators can be included in precursors-stage, the infrastructure indicator belongs to inputs-stage, while the application indicator comes under the intermediates-stage. All of the PeGI indicators come from the resources-inputs step and activities step only, and none of the e-government assessment dimensions cover the outputs, outcomes or impacts aspects. This analysis explains why both concepts do not seem too correlated.
This study revealed the cause of the weak correlation between e-government implementation achievement and good governance accomplishment in Indonesia. The correlation was determined by applying the Spearman rank correlation coefficient to the assessment results of both entities. The weak connection exists due to e-government assessment indicators that emphasize readiness aspects rather than goals achievement. It is therefore suggested to improve the evaluation dimensions with emphasis on outputs, outcomes or impacts of e-government practices in order to provide stronger correlations between e-government performance and good governance attainment.
This study provides two contributions to the concept of e-government and good government, especially in Indonesia. First, it explored the relationship between e-government achievement and good government governance, since previous researches only examined the good governance aspect after e-government implementation, but the achievement of e-government implementation itself was not studied. Second, it found that the correlation between both entities is not strong enough and revealed that this is caused by e-government assessment indicators that do not cover e-government implementation on the whole.
A limitation of this research was the focus on local government institutions, specifically on the provincial level. Other types of governmental institutions, i.e. local government on the municipality/regency level and central government on the national level also need to be considered. Likewise, only three assessments were used during the analysis, from nine assessments available. Thus, to obtain a more comprehensive picture of the correlation between egovernment and good governance, a wider range of data is required from both assessment types and government levels.
5 Conclusion
E-government can be seen as a tool for promoting and stimulating good governance principles. However, good governance principles are also required as a precondition for successful e-government application. Both entities influence each other, where an improvement of one of them will positively affect the other. A statistical analysis was performed to examine the correlation between e-government and good governance by using secondary data from various institutions in Indonesia that organize assessments. The results from several studied cases showed that the strength of most relationships was moderately positive, while not showing a significant correlation. This means that e-government performance and good governance achievement in Indonesia are still two separate concepts without strong linkage. While some studies in Indonesia found an improvement after e-government was implemented, promoting the values of good governance, e-government achievement did not align with good governance performance.
Examining the assessment of an activity, including e-government implementation, can be approached with a logic model. The logic model is a management framework that has been developed in recent decades, especially for program planning and evaluation. This study has shown that in Indonesia, good achievement in e-government implementation does not guarantee the same result in good governance, and vice versa. Measurements used in assessing egovernment could not answer how e-government could lead to the ultimate goal, i.e. good governance. By applying a logic model framework, in this case Heek's model, the cause was found to be minimal consideration of objective aspects in e-government assessment. Consequently, goal aspects such as outputs, outcomes and impacts must be included in the evaluation process to encompass the good governance principles. These principles are required in the assessment, not only for achieving e-government's final goals but also for providing an appropriate environment for the promotion of e-government practice.
A more comprehensive result will be gained if goals achievement is measured during e-government assessment, as the assessment will evaluate the process in a more holistic way from the beginning to the end of the e-government system. This new form of assessment will probably be harder to operationalize and will require primary data gathering, such as interviews with citizens or overall evaluations of the organization's efforts. Therefore, there are many international e-government benchmarkings that avoid this type of assessment in which the impact or effect indicators are involved. However, conducting the assessment surely will strengthen the conformity of e-government and good government.
A suggestion for further research is the development of an e-government assessment framework for Indonesia based on a logic model. The proposed framework should be designed for a more holistic approach and include all steps in the logic model, especially goals achievement, so that e-government implementation will be in accordance with good governance principles.