
1 Introduction
Application of ultrasound in food quality assessment and biomedical applications is widely conducted. It is used to measure the fat content of animals and humans non-invasively by analyzing the ultrasonic properties of the material. Continuous improvement of ultrasound technology has spread the application of ultrasound not only to the medical field but also to manufacturing industries and food industries [1-6]. Ultrasound technology is now widely
acknowledged as a tool that can be used as a non-invasive technology to enable the assessment of carcass and live animal quality without damaging the samples. The focus here is to assess the quality of meat by measuring the fat content [7-12].
1.1 Background of Research
Ultrasound analysis has three modes: amplitude modulation (A-mode), brightness modulation (B-mode), and motion modulation (M-mode) [7]. The difference between these three modes is the representation of the interaction between the ultrasonic waves and the medium. In this research, only A-mode and B-mode ultrasound were used. There are two issues that have arisen in the measurement of fat using ultrasound. First, the effect of the transducer's protective layer on the accuracy of the ultrasonic velocity measurement using A-mode analysis, and secondly, B-mode image positioning accuracy due to the application of a predetermined ultrasonic velocity for B-mode imaging [8].
Table 1 Summary of weaknesses and improvements of A-mode and B-mode imaging as discussed in this research.
| Type of Analysis | Weakness | Improvement |
|---|---|---|
| A-mode: Changes in density are represented by changes in velocity | - Measurement of ultrasonic velocity is less accurate due to the presence of a protective layer in the transducer | - Measurement of protective layer thickness is carried out and considered during the measurement of ultrasonic velocity |
| B-mode: Changes in density are represented by the brightness of grayscale image pixels | - The implementation of predetermined ultrasonic velocity during the B-mode imaging process affects the positioning accuracy of the B mode image - This problem occurs due to inaccurate estimation of the actual ultrasonic velocity in the particular tissue composition | - The actual ultrasonic velocity for the particular tissue is determined using A-mode analysis with consideration of the protective layer - The measured ultrasonic velocity is then used for B mode imaging |
In this paper, we present a preliminary study to increase the positioning accuracy of B-mode images using adapted time of flight measured by A-mode analysis. Adapted B-mode imaging uses the individual ultrasonic velocity of each sample to obtain the B-mode image rather than a predetermined velocity for biological tissues. A new approach is introduced to perform the measurement of ultrasonic velocity and B-mode imaging. To increase the accuracy of the ultrasonic velocity measurement, the thickness of the transducer's protective layer is determined before use in the velocity equation. To increase the positioning accuracy of the B-mode image, the actual velocity is used rather than a predetermined velocity. This method was used to measure the intramuscular fat content of chicken fillets. A comparison between the adapted B-mode imaging and conventional B-mode imaging was done for two types of applications: determination of the material (sample) thickness to test the positional accuracy and measurement of chicken intramuscular fat content using B-mode image properties. Table 1 summarizes the research work presented in this paper. It details the weaknesses of both A- and B-mode analysis and the changes carried out to overcome their weaknesses.
1.2 Ultrasound B-Mode Imaging for Fat Measurement
The quality and accuracy of B-mode images are evaluated based on several characteristics such as the image resolution (lateral and axial), image sensitivity and positioning accuracy. In the common procedure of conventional ultrasound B-mode imaging, a velocity of 1540 ms<sup>-1</sup> is used as predetermined ultrasonic velocity of the tissue. The application of this predetermined velocity may lead to a so-called phase error since the ultrasonic velocity varies depending on the tissue density. There are several types of phase error corrections that have been proposed: using speckle analysis [9], focusing quality, using the computed minimum average sum of the absolute difference (MASAD) [10], and automatic image registration [11]. These methods achieve improvement in image resolution and are successful in providing a better image. However, they require comprehensive and complex computational algorithms [8].
The B-mode image pixel contrast depends on the amplitude of the reflected ultrasonic wave due to the impedance mismatch (difference) between two types of tissues. The higher the amplitude of the reflected wave, the higher the pixel contrast. Typical velocities for tissue components are 1448 ms<sup>-1</sup> for fat, 1547 ms<sup>-1</sup> for soft tissue and 1613 ms<sup>-1</sup> for muscle. Since the acoustical impedance is proportional to the ultrasonic velocity, fat has the highest impedance mismatch in biological tissue compared to other tissue types. Thus, in B-mode images, fat will appear as bright white pixels [12].
2 Literature Review
Fat measurement is a measurement of fat content in a material, such as food, animal or human. Fat measurement started with the measurement of body composition in the livestock and poultry industry for breeding and meat grading purposes [13]. Nowadays, fat measurement is not only applied to animals but also to the human body as a means of assessing the body's condition, such as health status, body shape and weight [14]. Fat measurement methods can be categorized into two groups: invasive and non-invasive methods [15-16].
2.1 Invasive Fat Measurement
Invasive fat measurement is the determination of the total fat content extracted from a sample, which requires destruction of the sample. The process of drying, grinding and chemically extracting involved in this method destroys the sample [17]. For invasive fat measurement, solvent-based extraction methods such as ethyl acetate extraction are often used. Other examples of invasive fat measurement methods are the Soxhlet method, the Caviezel method and the Supercritical CO2 Extraction method.
2.1.1 Soxhlet Method
The Soxhlet method was invented by Franz von Soxhlet in 1879. It consists of four basic processes: drying, grinding, extracting and weighing. It was designed for lipid extraction from solid objects. A study by Manirakiza, et al. [18] in 2001 showed that the Soxhlet method is only suitable for solid samples. This conclusion was based on a comparative study between the Soxhlet method and a number of other destructive lipid extraction methods. Extraction of lipid from non-solid samples should be avoided.
2.2 Non Invasive Method
Non-invasive fat measurement is the determination of total fat content extracted from a sample without requiring the destruction of the sample. Destruction of the sample in invasive methods has motivated the introduction of nondestructive fat measurement methods. Examples are: Total Body Electrical Conductivity (TOBEC), Bioelectrical Impedance Analysis (BIA), Infrared spectrometry, and Ultrasound.
2.2.1 Total Body Electrical Conductivity (TOBEC) and Near Infrared Spectrometry (NIR)
Table 2 Summary of principle, advantages and disadvantages of TOBEC and NIR.
| Method | Principle | Advantages | Disadvantages |
|---|---|---|---|
| TOBEC | Measures the amount of electrical energy absorbed by a sample from an electromagnetic field | Non-invasive, safe and convenient in estimating body composition [20] | Sensitive to the water content in the sample [19] |
| NIR | Measures the absorbance of infrared light while propagated through a medium | Non-destructive measurement with reliable accuracy [21-22] | Sensitive to the thickness of the sample |
TOBEC is a non-invasive method for fat measurement. The fat content is measured based on the different levels of conductivity of lean and fat tissue [19]. This method is based on the principle that the electrical conductivity of lean tissue is greater than the conductivity of fat. The NIR method is based on absorbance of infrared light while it propagates through a medium. Table 2 summarizes the principles, advantages and disadvantages of both methods.
2.2.2 Ultrasound
The introduction of ultrasound technology in the early 1950s gave motivation to researchers to replace human judgment with reliable automated composition measurement. The improvement of ultrasound devices provided more opportunities to researchers in realizing their vision. Houghton and Turlington [23] state that the improvement of ultrasound devices has expanded the application not only to beef but also to several other types of animals, such as swine, sheep and beef cattle. The industry's acceptance of the use of ultrasound in determining the fat content of live animals and carcasses has resulted in the production of commercial ultrasound instruments in order to fulfill the demand [10]. Initially, the involvement of ultrasound in the livestock industry was to identify the intramuscular fat content, also known as 'marbling' in beef. The non-invasive characteristic of ultrasound measurement enables the technology to perform as a tool for live animal marbling prediction. Although the ultrasound marbling measurement technique was first developed in the 1950s, it took about 30 years for it to be acknowledged by the livestock industry as a non-invasive marbling measurement technique, where previously this was done using a conventional method called 'manual visualization process'. Measurement of marbling is very important and should be done accurately since the process will determine the quality of the meat and also the price for the meat [21].
Ultrasound velocity not only varies with the composition of the medium but also with temperature. Chanamai and McClements [21] in 1999 found that at higher temperature, the ultrasound velocity used for measuring fat content increases, while it decreases when the temperature is lowered. It is important to avoid the measurement of fat at critical temperature since the ultrasound velocity is independent of fat content at that temperature [21]. However, Chanamai and McClements have suggested that ultrasound has the potential to be used as a non-invasive fat measurement method because it is simple, reliable, fast and non-destructive. The difference in propagation characteristics of ultrasound at low and high temperature is related to the kinetic energy in the molecules. The molecules have higher kinetic energy in a higher temperature state, so the sound is transferred faster compared to a lower temperature state.
Thus, in order to perform accurate fat measurement, the temperature of the samples must be standardized.
Subsequently, both Shannon, et al. [24] and Abdul Halim, et al. [6] found that ultrasound velocity through a sample is inversely proportional to the fat content in the sample. The findings from both researchers satisfy the relationship between the speed of sound and medium density as shown in Eq. (1), where the speed of sound, C, is inversely proportional to medium density, .
Ultrasound Speed, \[C = \sqrt{\frac{c}{\rho}}\] (1)
For several numbers of the same type of samples, such as chicken fillets, the stiffness coefficient, c, for all samples is the same and at the same temperature and water content, the density of the sample will only vary with the fat content in the sample. Then, the only variable that varies with the ultrasound speed in the sample is the fat content in the sample. Unfortunately, both researchers faced a low-correlation problem, where Shannon [24] could only differentiate the samples into three groups of fat, i.e. high fat, medium fat and low fat content. This problem occurs due to the natural variation of tissue in the samples. The natural tissue variation effect may be reduced by using a larger number of samples and studying the natural variation of the relationship between tissue and ultrasound velocity by the application of ultrasound B-mode imaging.
In 1992, Whittaker, et al. [25] used ultrasound analysis and a signal-processing technique to determine intramuscular fat in beef. The three techniques they used in determining intramuscular fat were: A-mode analysis, B-mode analysis and frequency analysis. The researchers concluded that live animals produce a larger ultrasound pulse scattering effect compared to slaughtered animals due to the presence of capillary blood. In live animals, the capillaries contain blood and have a different acoustical impedance than soft tissue. The difference is represented in B-mode images as brighter pixels. Bright pixels may be wrongly interpreted as intramuscular fat or marble in meat. This finding shows that the samples with a lower liquid or water content will contribute to a more accurate B-mode image.
The idea of obtaining images for diagnosis has spread to the imaging of fat content in beef carcasses. With implementation of image processing, the speckle noise from B-mode imaging can be minimized and thus improve the process of determining fat content from images [26]. It has been proven that ultrasound Bmode imaging can be used to visualize components of beef, lamb and chicken, i.e. fat, bone and muscle [15]. The images can be enhanced using a MATLAB image-processing program such as Histeq, Adapthisteq or Imadjust. The purpose of image enhancement is to remove speckle noise and also to classify the pixel brightness of a composite group. From the result, it can be seen that the fat in meat appears as brighter pixels compared to lean muscle or meat.
3 Experimental Set-up
The objective of the integration of A-mode and B-mode imaging is to increase the accuracy of intramuscular fat measurement. For B-mode imaging it is essential to determine the region of interest. The important parameters within the region of interest are thickness and penetration depth, which affect the ultrasonic wave. An error in this determination could lead to overestimation or underestimation of the location of gray pixels (depth) in the B-mode image that represents the structure and composition of the sample. To accurately determine the position of gray pixels, the ultrasonic velocity in the sample should be measured. Thus, an additional A-mode scan is carried out and integrated into the measurement process.
The measured ultrasonic velocity using A-mode will then be inserted into Bmode software in order to produce accurate 2D B-mode images. B-mode then consists of 4 phases: data capture; preprocessing of the B-mode image; segmentation; and measurement of the gray intensity value. The data capture process is done by ultrasound B-mode analysis. The image is than preprocessed to enhance it in order to minimize the effect of speckle (noise) by an image processing method such as image transform, segmentation and feature extraction during data evaluation [12,15]. The ultrasonic velocity can be calculated using Eq. (2).
Ultrasonic velocity, \[c = \frac{k \times Thickness \text{ of sample,d}}{Time \text{ of flight,} \mu s}\] (2)
where:
k = 1 if A-mode analysis is performed using Continuous wave
k = 2 if A-mode analysis is performed using Pulse-echo
3.1 Samples and Equipment
For the preliminary study, 144 pieces of chicken breast meat from commercially bred chickens (gallus gallus domesticus) were used in this study. The samples were obtained from 5 different suppliers and cut to a random thickness of 0.8 mm to 10.3 mm (10±0.3 mm). All of the samples were frozen prior to the experiment, then left to thaw for approximately three hours before the experiment. The chicken meat was thawed on a sponge to prevent the water from accumulating on the surface of the sample. All experiments were conducted at room temperature (21°C) to avoid the independency of ultrasonic
velocity with the intramuscular fat content, which occurs in chicken meat at 15 °C [11]. This temperature is known as the critical temperature. The visualization is in Figure 1.
Figure 1 (A) Chicken breast, (B) cut into a sample, and (C) position of the sample held by the ultrasonic transducer in the fat measurement rig.
Figure 2 shows the fat measurement rig set-up, which consisted of Ultrasonic Echoscope GAMPT-Scan for generating and receiving the ultrasonic wave, a 4- MHz ultrasound transducer with a diameter of 27 mm, a fat measurement rig, and a computer. Two software applications were used in the experiments: A-Scan and MATLAB software. A-scan was used to visualize the processed signal from the Ultrasonic Echoscope GAMPT-Scan. MATLAB was used to process the image from the B-mode analysis.
Figure 2 Set-up for intramuscular fat measurement: (A) computer, (B) Ultrasonic Echoscope GAMPT-Scan, (C) ultrasonic transducer, and (D) fat measurement rig.
The fat measurement rig was constructed to enable the ultrasonic wave to enter and travel through the fillet. This is done in two stages: a stationary and a moveable stage. One of the transducers is mounted in the stationary stage and the other one in the movable stage. The measurement rig was able to hold a sample with maximum thickness of 50 mm and a size of 50 mm x 50 mm. To ensure that the sample thickness was accurately measured, a Vernier caliper with an accuracy of up to 0.01 mm was used. The sample temperature was observed with a infrared thermometer.
4 Experiments
Two experiments were executed for this research. The first one was designed to study the effect of poor estimation of ultrasound velocity on phase errors in Bmode images. The second experiment was done to evaluate the accuracy of the measurement of intramuscular fat content by applying improvements to the Bmode imaging method.
4.1 Assessing Phase Errors in B-mode Images due to Poor Estimation of Ultrasonic Velocity: Preliminary Study
In this preliminary study, the phase error in B-mode images due to inappropriate estimation of ultrasonic velocity was assessed by measuring its positioning accuracy. Measurement of the thickness of 144 chicken fillets was carried out using a Vernier caliper and then using two ultrasound techniques, i.e. a) adapted B-mode, b) conventional B-mode. The difference between the two is that for the adapted B-mode, the actual ultrasonic velocity of each sample was first determined and then used in the B-mode image calculations, whereas the conventional method used the same predetermined ultrasonic velocity of 1540 ms-1 for all samples in the calculation.
4.2 Adapted B-mode Imaging
Adapted B-mode imaging requires the measurement of ultrasonic velocity for every sample using A-mode analysis. The measurement of the ultrasonic velocity was done using the Corrected Continuous Wave (CCW) equation based on an earlier study on the influence of the protective layer of the transducer on measurement of the ultrasonic velocity. The CCW equation takes into account the thickness of the protective layer of the transducer. The protective layer was coated on the surface of the ultrasound transducer to protect the piezoelectric layer. Since the ultrasonic velocity is related to the distance of travelled wave, an unknown protective layer thickness will contribute to inaccurate estimation of the actual travelled distance. A study was carried out to measure the protective layer's thickness. Based on the measurement, the thickness of the protective layer coated on the transducer was 0.5625 mm. However, on different
transducers it may have different thicknesses. To validate whether the protective layer affects the accuracy of the ultrasonic velocity measurement, an experiment was conducted (not explained in this paper). The result showed that CCW is the most accurate method for ultrasonic velocity measurement using B-mode analysis among the studied methods [16]. The CCW equation is formulated as following Eq. (3):
Ultrasonic velocity, \[c = \frac{d \times 1.125}{t}\] (3)
Where d is the fillet thickness measured in millimeter (mm), 1.125 mm is the protective layer thickness for the transducer used in this experiment, and t is the time of flight measured between the starting point (ultrasound wave transmits) and the first peak of the received ultrasonic wave. The measured ultrasonic velocity and the predetermined ultrasonic velocity (1540 ms-1) were used to obtain the B-mode image. By performing boundary detection using MATLAB, the thickness of the fillet represented in the B-mode image could be calculated.
4.3 Determining Intramuscular Fat Percentage
In biological tissue, fat has the highest impedance mismatch compared to other tissue types. Thus, in B-mode images, fat will appear as brighter white pixels. This characteristic enables the measurement of intramuscular fat content using B-mode image properties.
Two B-mode image properties used in measuring the intramuscular fat content of chicken fillet in this research are the histogram mean and the percentage of fat pixels. The histogram mean is a measurement of the average pixel contrast of a grayscale image. The sample with the highest histogram mean is assumed to have the highest fat content. The percentage of fat pixels is a measurement of the ratio between the number of pixels that represent fat and the total the number of pixels in the image. A higher fat content will contribute to a higher percentage of fat pixels. Figure 3 shows the experimental flowchart for chicken fillet intramuscular fat measurement using B-mode imaging. The experimental process for intramuscular fat measurement then is described into the following phases:
- 1. Data capture phase: Measurements of chicken fillet intramuscular fat were carried out using two methods: B-mode imaging and the Soxhlet method (standard method). For B-mode imaging, the fillet was measured using both the adapted and the conventional B-mode imaging method.
- 2. Image Preprocessing: An image enhancement technique called image averaging was performed to remove noise known as speckle. To perform the image averaging technique, grayscale images of all 30 chicken fillets
- 3. Segmentation Phase: The fat region was delineated from the grayscale image using Otsu's thresholding method. According to a previous study by Ng, et al. [26], the fat content will appear as brighter pixels in a grayscale image compared to other components due to its higher impedance mismatch with muscle tissue.
- 4. Data Analysis: Data in various graphical forms was analyzed.
4.3.1 Calculating Fat Content using Histogram Mean and Percentage of Fat Pixels
In image processing, the histogram of an image usually refers to the histogram of the intensity values of the pixels. The histogram mean for a 256 grayscale-level B-mode image can be calculated by Eq. (4).
\[Histogram mean = \frac{\sum_{i=0}^{n=255} x_i y_i}{256}\] (4)
In this research, the calculation of the histogram mean was carried out using MATLAB image processing tools. Segmentation was performed using Otsu's thresholding method to convert the B-mode image into a binary image with only two levels of pixel intensity, 1 and 0. Pixels with intensity 1 are identified as fat and pixels with intensity 0 are identified as background (non-fat substance). The percentage of fat pixels is then calculated using Eq. (5).
Percentage of fat pixels, % fat pixels = \[\frac{\text{Number of fat pixels}}{\text{Total Num. of fat pixels}} \times 100\%(5)\]
4.4 Validation Using Soxhlet Method
The measurement of the fat percentage using the B-mode analysis method was validated using a proven method of fat measurement. The Soxhlet method is a proven method recognized by the Association of Official Analytical Chemists (AOAC). Using this method, the total fat content in the sample was measured using a chemical extraction process. The four main steps are: drying, grinding, extraction and weighing. For each sample, approximately 48 hours were required to complete the fat measurement process. Eq. (6) shows how the fat percentage is calculated.
% of fat content = \[\frac{\text{Weight}_{RBF2} - \text{Weight}_{RBF1}}{\text{Weight}_{Sample}} \times 100\%\] (6)
where:
Weight_RBF2: Weight of round bottom flask after extraction of fat content Weight_RBF1: Weight of round bottom flask before extraction of fat content
Weight sample: Weight of sample used for extraction
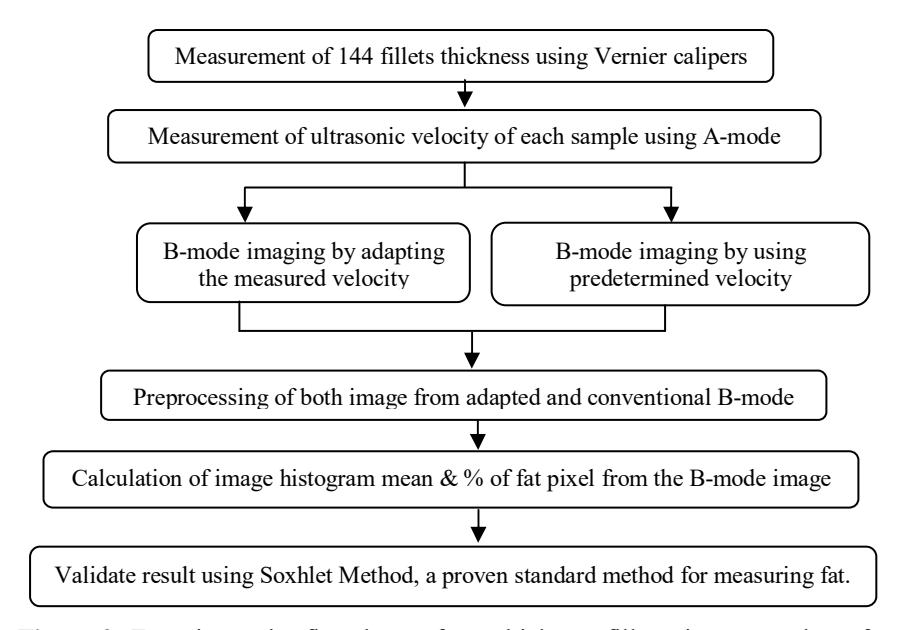
Figure 3 Experimental flowchart for chicken fillet intramuscular fat measurement using B-mode imaging.
5 Results and Discussion
The data collected from both experiments were analyzed using graphs and correlation values were calculated.
5.1 Preliminary Experiment – Thickness Measurement
Figures 4 and 5 show graphs of the linear relationship between the measured and the actual thickness of the chicken fillets calculated with Pearson's linear correlation: r = 0.962 and 0.997 for Adapted B-mode and Conventional Bmode. 'Actual thickness' refers to the thickness measured using the Vernier caliper. The dotted line shown in the graphs is a one-to-one relationship line for measured and actual thickness. The best-fitted line being closer to the dotted line means better accuracy in determining the chicken fillet's thickness. As can be seen, the graphs indicate that the measurement of thickness using Adapted B-Mode imaging was more accurate than using conventional B-mode imaging.
Table 3 Mean difference between measured and actual chicken fillet thickness.
| Method | Mean difference ± SD (mm) |
|---|---|
| Adapted B-mode Imaging | 0.036 ± 0.034 |
| Conventional B-mode Imaging | 0.113 ± 0.010 |
Table 3 shows the result from a paired t-test. Adapted B-mode imaging had a smaller mean difference compared to Conventional B-mode imaging (0.036±0.034 vs. 0.113±0.010). According to the paired t-test, Adapted B-mode imaging was more accurate in representing the thickness of 144 chicken fillets compared to Conventional B-mode imaging.
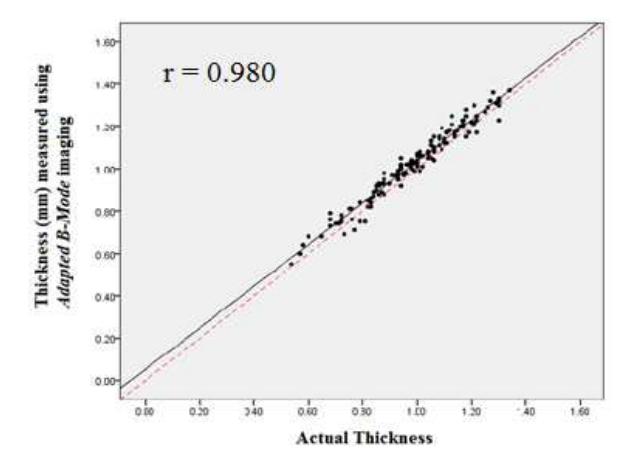
Figure 4 Correlation between measured thicknesses calculated using Adapted B-mode imaging and actual thickness of the chicken fillets.
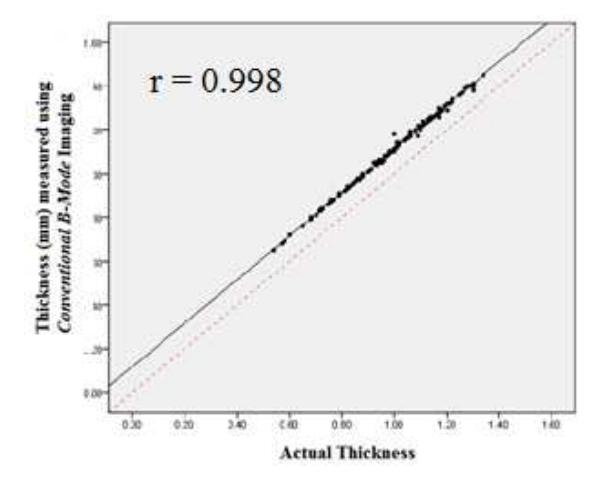
Figure 5 Correlation between measured thicknesses calculated using conventional B-mode imaging and actual thickness of the chicken fillets.
The accuracy of ultrasonic velocity measurement depends on how accurately the distance the ultrasonic wave has travelled is measured and the time of flight is calculated. The time of flight measured from the A-mode analysis is the actual time of flight from the first piezoelectric sensor (transmitting the wave) to the second piezoelectric sensor (receiving the wave). However, accurate measurement of the distance travelled by the wave must be done considering the thickness of the protective layer. Failing to do this could lead to underestimation of the real distance and cause inaccurate measurement of the ultrasonic velocity since information about the protective layer thickness is not provided by the equipment provider. Figure 6 illustrates how mistakes occur during measurement of the distance traveled by the ultrasonic wave for continuouswave and pulse-echo-wave propagation mode.
The figure illustrates the difference between the usually measured distance and the real distance. The accuracy of ultrasonic measurement is improved when the thickness of the protective layer is determined and taken into account during measurement.
5.2 Intramuscular Fat Measurement Using B-mode Imaging
Intramuscular fat measurement was done by obtaining the histogram mean and the percentage of fat pixels for both the Adapted and the Conventional B-mode imaging. Figure 7 shows a linear relationship between the histogram mean and the percentages of fat measured using Adapted B-mode imaging. Figure 8 shows the linear relationship graph between the percentage of fat pixels and the percentages of fat measured with Conventional B-mode imaging.
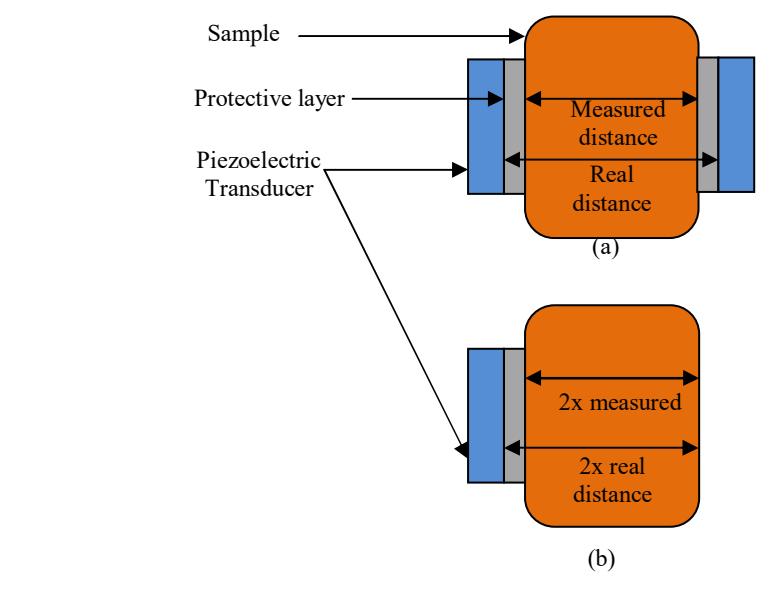
Figure 6 Measurement of distance travelled by ultrasonic wave: (a) Continuous wave and (b) Pulse-echo.
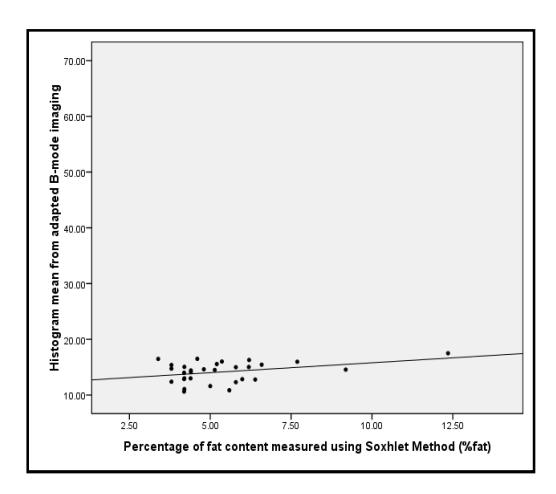
Figure 7 Graph of linear relationship between histogram mean and percentages of fat measured using Adapted B-mode imaging.
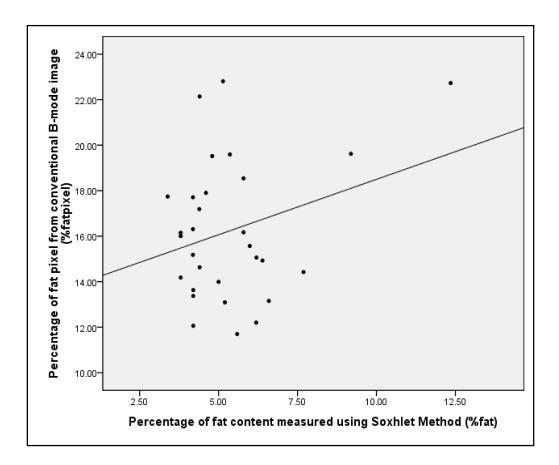
Figure 8 Graph of linear relationship between percentage of fat pixels and percentages of fat measured using Conventional B-mode imaging.
The correlation value is the calculated fat percentage measured using the ultrasound method compared to the percentage of fat obtained using the proven Soxhlet method. As depicted in Table 4, Adapted B-mode imaging improves the correlation between measurement of chicken intramuscular fat compared with measurement by Conventional B-mode imaging. The measurement of fat content using the percentage of fat pixels has better accuracy compared to the histogram mean method since it has a higher correlation with the fat content as measured using the Soxhlet method. However, the correlation is not strong enough to result in acceptable accuracy in fat content measurement.
| Pearson correlation (r-value) | |||
|---|---|---|---|
| Method of calculating fat percentage | Conventional B-mode imaging | Adapted B-mode imaging | |
| Histogram mean | 0.129 | 0.357 | |
| Percentage of fat pixels | 0.289 | 0.406 | |
Table 4 Correlation of measured fat percentage compared to fat percentage obtained using soxhlet method.
With respect to the approximate density and ultrasonic velocity for water, soft tissue, muscle tissue and fat as shown in Table 5, the acoustical impedance mismatch between fat and other components is the highest after the mismatch between muscle tissue and water as shown Table 6. Thus, in most conditions, the interface between fat and other components appears as brighter pixels compared to other interfaces.
Table 5 Approximate density and ultrasonic velocity for water, soft tissue, muscle tissue and fat.
| Composition | Density (kg/m3 ) | Ultrasonic velocity (ms-1 ) |
|---|---|---|
| Water | 1000 | 1484 |
| Soft tissue | 1000 | 1547 |
| Muscle tissue | 1060 | 1613 |
| Fat | 909 | 1448 |
Table 6 Comparison of acoustical impedance mismatch between water, soft tissue, muscle tissue and fat.
| Water | Soft tissue | Muscle tissue | Fat | |
|---|---|---|---|---|
| Water | – | 63 k | 225.78 k | 167.768 k |
| Soft tissue | 63 k | – | 162.780 k | 230.768 k |
| Muscle tissue | 225.780 k | 162.78 k | – | 393.548 k |
| Fat | 167.768 k | 230.768 k | 393.548 k | – |
The intramuscular fat content in chicken fillet should contribute the same characteristic (brighter pixels representing fat) in B-mode images. Thus, calculation of fat content in chicken fillets can be carried out by analyzing Bmode images.
Lack of fat content variability and lack of usability of the simple time gain compensation (TGC) setting in solving the tissue attenuation effect are the factors that caused the low correlations. Figure 9 shows the percentages of fat content measured by the Soxhlet method for 30 chicken fillets. The graph shows that the chicken fillets used in this experiment had low fat content variability with 27 of the samples having about 2.5% to 7.5% of fat content. This lack of variability may lead to underestimation of the correlation between the B-mode
image properties and the percentages of fat content [20]. In future experiments, the chicken breast samples will be varied by collecting pieces of chicken breast from commercial and non-commercial grown chickens, such as organic chickens, kampung chickens (free-range chickens bred by villagers in Malaysia, which are usually very low in fat).
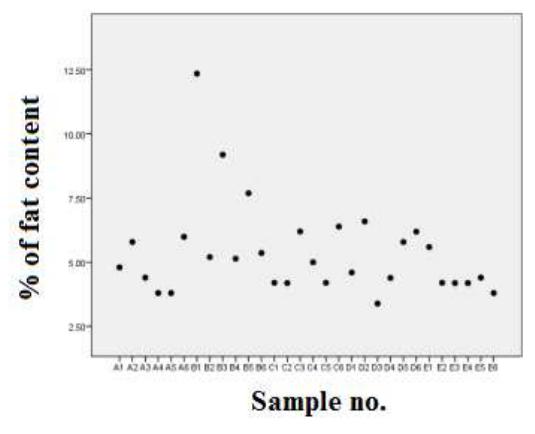
Figure 9 Percentage of fat content in 30 samples of chicken fillet measured using Soxhlet method.
Ultrasonic wave attenuation is directly proportional to the thickness of a sample. This is known as the tissue attenuation effect. To minimize the effect, the TGC setting was applied. However, there are some issues in the application of TGC in this experiment that contribute to errors in the acquisition of the B-mode image in the first place. The first issue is the usability of a simple gain function for all scan depths in an image of an inhomogeneous sample, and the second issue is the level of expertise possessed by the operator to find the appropriate gain setting.
6 Conclusion
The results from this study suggest that the use of the actual ultrasonic velocity (obtained using A-mode analysis) in B-mode imaging analysis (Adapted Bmode imaging) increases the positioning accuracy of the B-mode image instead of using a predetermined ultrasonic velocity (Conventional B-mode imaging). Since the proposed improvements showed positive results, the measurement of intramuscular fat content was performed by the implementation of these enhancements. The results from the measurements of fat content using ultrasound suggest that:
- 1. Improvement of the ultrasonic velocity measurement accuracy and positioning accuracy of B-mode images increases the capability of ultrasound to measure intramuscular fat content.
- 2. In this work, calculating fat content from B-mode images gave better results when the percentage of fat pixels method was used rather than the histogram mean method.
This research showed that there is a relationship between B-mode image properties and intramuscular fat content in chicken meat. Although the correlation is insufficient to ensure accurate measurement of chicken intramuscular fat content, the relationship indicates that there is potential in using ultrasound B-mode imaging to evaluate chicken intramuscular fat.
Further work is needed to study the application of an adaptive TGC technique for different types of meat and compositions, including a more advanced study of the influence of non-fat components such as water, protein and lean muscle in chicken meat on B-mode image pixel intensity.
Acknowledgements
The authors gratefully acknowledge and thank Universiti Teknologi MARA (UiTM) for awarding a Research Intensive Faculty (RIF) grant (600- RMI/DANA/5/3/RIF (368/2012).