
1 Introduction
High-quality software systems cannot be completed without developing rigorous testing methodologies [1,2]. With the rise in size and complexity of recent software system products, regression testing is becoming ever more important. In the field of software system development, considering the character of software system quality and growing stress on software system products, test suit prioritization is of great importance and relevance to business.
The whole testing process consumes 30-50% of the development cost. It is tough for the tester to create the product 100 percent bug-free in the limited given time [3]. Additionally, as 365-day functionality of a product is commonly used, the tester is required to target creating such functionality bug-free [4,5]. To undertake this, because of resource constraints, the application of all sets of test cases is impractical. So a limited number of test cases are selected, which may find most of the faults in the given version of the software system [6]. Such a choice can amount to minimization of the number of test cases but may not
always be effective in finishing the method of finding faults. Test cases ought to be prioritized according to code coverage and execution time. Test case prioritization [7-9] orders test cases in such a way that the test cases with the highest priority according to some fitness metric are executed first.
Rothermel, et al. [8] outline the test case prioritization problem and describe many problems relevant to its solution. They define the problem as follows.
1.1 Test Case Prioritization (TCP) Problem
Given: T, a test suite; PT, the set of permutations of T; f, a function from PT to real numbers.
Problem: Find T' ∈ PT such that (∀ T'' (T'' ∈ PT) (T'' ≠ T') [f (T'') ≥ (T'')])
Here, PT represents the set of all possible prioritization (orderings) of T and f is a function that, applied to any such ordering, yields an award value for that ordering.
Meta-heuristic search techniques [10] are high-level frameworks that utilize the automatic discovery of heuristics in order to search out solutions to combinatorial problems at an inexpensive procedure price. Evolutionary algorithms, of which genetic algorithms (GAs) are a subclass, are a form of meta-heuristic searching that employ a Darwinian evolutionary metaphor to guide the searching by a process of 'survival of the fittest'. In the case of scheduling problems, of which regression test case prioritization is an example, the application of genetic algorithms has been shown to be effective [11]. As such, an empirical study of the effectiveness of those and related meta-heuristic techniques is timely. As a by-product of such a study, it is possible to realize an insight into the character of the search space denoted by test case prioritization and to review the fitness metrics used to guide the search.
This paper focuses on test case prioritization techniques for code coverage as well as execution time. With totally different objective functions, techniques can have totally different complexity and search-space characteristics. Given a function f that assesses the rate of accomplishment of code coverage, an economical answer to the test case prioritization problem would provide an economical answer to the knapsack problem, which is understood to be NP-hard [12]. Thus, prioritization techniques for code coverage are essentially heuristic [13].
Chemical reaction optimization (CRO) is an optimization algorithm that has recently been proposed in [14,15]. CRO includes a smart searching ability that shows glorious operation in 2 necessary options of improvement metaheuristics: intensification and diversification. It conjointly enjoys the benefits of GA by using crossover and mutation operators that are typically utilized in GAs [14]. CRO, by outperforming several existing evolutionary algorithms, has resolved several issues in recent years: it has been successfully applied to the quadratic assignment problem [15], the resource-constrained project programming problem [15], the stock portfolio choice problem [16], artificial neural network training [17], network coding optimization [18], the channel assignment problem in wireless mesh networks [14], and several alternative problems.
2 Related Work
In [19-21], Rothermel, et al. formally outlined the drawbacks of test suite prioritization and investigated six prioritization techniques using experiments. Four of the techniques supported the coverage of either statements or branches for a program and 2 of the techniques supported the calculable ability to reveal faults. In [22], Srivastava and Thiagarajan studied a prioritization technique supporting the changes that are created by the program. Their technique orders the given test cases to maximally cover the affected elements of the program so that defects are likely to be found quickly and inexpensively.
Panigrahi and Mall [23,24] proposed S-RTP and H-RTP, which determine the affected nodes in the ESDG model based on an analysis of control and data dependencies as well as dependencies arising from object relations, and then prioritize regression test cases based on the number of affected nodes exercised by a test case.
The use of greedy algorithms (total and additional) for regression TCP has been widely studied in the literature [25]. However, results obtained from empirical studies carried out by Rothermel, et al. [13] indicate that greedy strategies may not always produce optimal ordering of test cases. To prioritize regression test cases, Li, et al. [26] further proposed other greedy strategies, such as the 2 optimal strategy and two meta-heuristic search strategies (hill-climbing and genetic algorithms).
Jeffrey and Gupta [27] proposed an approach of prioritizing regression test cases based on coverage of a relevant slice of the output of a test case. They defined a relevant slice as the set of statements that influence or can influence the output of a program when running on a regression test case [27]. The main aim of their prioritization technique was to achieve higher rates of fault detection.
Smith, et al. [28] used call tree for TCP. Mohapatra, et al. [29] proposed a GA-based TCP, where the code coverage and severity of the test case are taken into consideration.
3 Understanding Average Percentage of Fault Detected (APFD)
Rothermel, et al. [30] planned APFD to measure the average rate of fault detection of a regression test suite. APFD has been used by many researchers [27, 31] to determine the effectiveness of test prioritization schemes. For test suites, APFD is calculated by taking the weighted average of the quantity of faults detected throughout the execution of the program with the test suite. APFD metric values range from 0-100, where a high APFD value indicates a faster rate of fault detection.
Let a number n of test cases be present in test suite T and the set of faults revealed by T be F. The total number of faults present will be m. In an ordering, let TF<sub>i</sub> be the primary test case that reveals a fault i. Then the average percentage of faults detected with said ordering is obtained using Eq. (1).
APFD=1-\[\frac{TF_1+TF_2+....+TF_n}{n*m}+\frac{1}{2n}\] (1)
To better understand the APFD matrix let us select a program that has 6 test cases and exposes 9 faults, as represented in Table 1. The test cases are labeled as \(T_1,T_2,T_3,T_4,T_5,T_6\). Let us prioritize them in two ordering sequences \(O_0 < T_1,T_2,T_3,T_4,T_5,T_6 >\) and \(O_1 < T_3,T_4,T_5,T_1,T_2,T_6 >\). Figure 1 represents the detection of faults in a fraction of the test cases. The area under the graph represents the average percentage of faults detected. Figure 1(a) shows that in 0.17 percent of the test cases 10% of the faults were detected, whereas in Figure 1(b), in the same 0.17 percent of test cases 50% of the faults were detected. The ordering sequence \(O_1\) represented in Figure 1(b) detects all faults quicker than order \(O_0(A)\).
| T C | Fault | ||||||||
|---|---|---|---|---|---|---|---|---|---|
| Test Case | 1 | 2 | 3 | 4 | 5 | 6 | 7 | 8 | 9 |
| \(T_1\) | |||||||||
| \(T_2\) | |||||||||
| \(T_3\) | |||||||||
| \(T_4\) | |||||||||
| \(T_5\) | |||||||||
| \(T_6\) | |||||||||
Table 1 Test suite and faults detected.
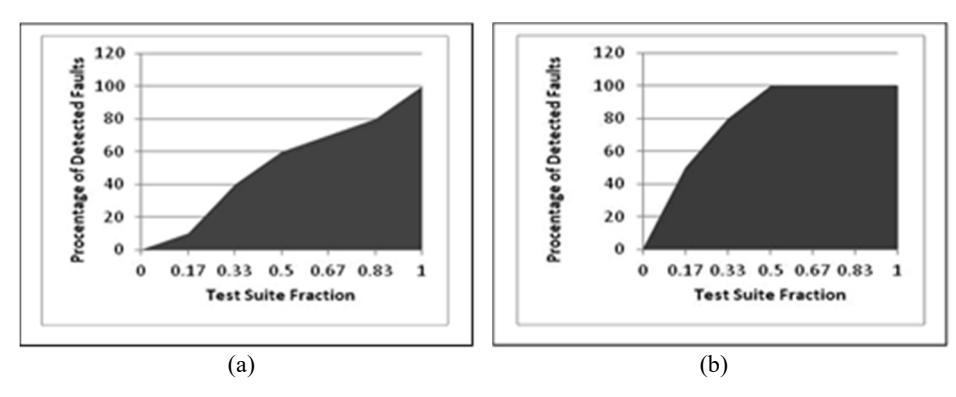
Figure 1 Illustration of APFD measure.
4 Proposed Model
In this section, the procedure of execution of the CRO algorithm is described. Before applying the TCP techniques, we collected the test case-requirement metrics from the previous execution of test case T over program P. In the case of regression testing the test cases, T is prioritized using CRO and give prioritize test case T'. These test cases are run on the modified program P' in the maintenance stage (See Figure 2).
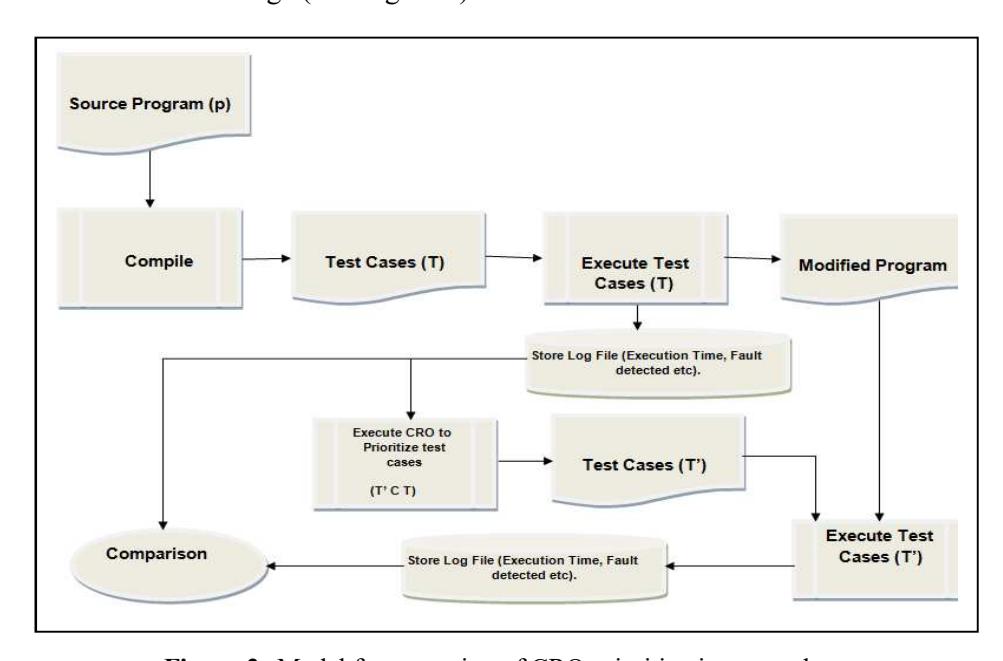
Figure 2 Model for execution of CRO prioritization procedure.
The initial test case T over program P is executed in the development stage. This information of the test case is stored in a log file for future use. After the program is modified (P') some new test case is created and new modules are added to P'. Let this new test case be TNEW. The set of new test cases T' = T U TNEW. Now this TNEW must be executed over P' to test the new functionalities of P'. Then what about T? Is it possible to execute all the test cases present in T or should we take a subset of it? By prioritizing T, we will be able to know the sequence of test cases that exposes the faults more quickly. For this, the log file of T in the development phase is taken into consideration. This information is used in the CRO algorithm, which is implemented using MATLAB. The CRO algorithm gives an optimal sequence of test cases that is used in the testing of P'. The details of the CRO algorithm and a flowchart are shown in Figure 3 and 4 of Section 5 of this paper.
5 Proposed CRO Algorithm for Test Case Prioritization
Begin
      Initialize PopSize, KELossRate, MoleColl, buffer, InitialKE, α and β in the initial
      stage.
InitialSolGen( popSize , n)
Repeat
Calculate PE for each molecule and set InitialKE for each molecule
While (No molecule Left)
Repeat
generate a random number bϵ[0,1]
 if b>MoleColl
 if (number of hits - minimum hit number) > α
 decomposition(W)
 else
                        OnwallIneffectiveCollision(w)
 end if
 else
 if KE≤β
 Synthesis(w1,w2)
 else
 Inter-Molecular Ineffective Collision(w1,w2)
 enf if
 end if
while (PE of molecule remain constant for successive iteration)
End
Figure 3 CRO test case prioritization algorithm and flow chart.
The algorithm represented in Figure 3 starts with the creation of molecules representing a set of randomly selected test cases, as represented in Figure 5. Molecule fitness is calculated using PE. The molecules undergo CRO operations like on-wall ineffective collision, decomposition, inter-molecular
ineffective collision, synthesis to generate new molecules at each iteration. The algorithm will stop when the potential energy (PE) of the molecules does not further optimize in the successive execution of the CRO method. These operations and algorithms are discussed in Section 6.
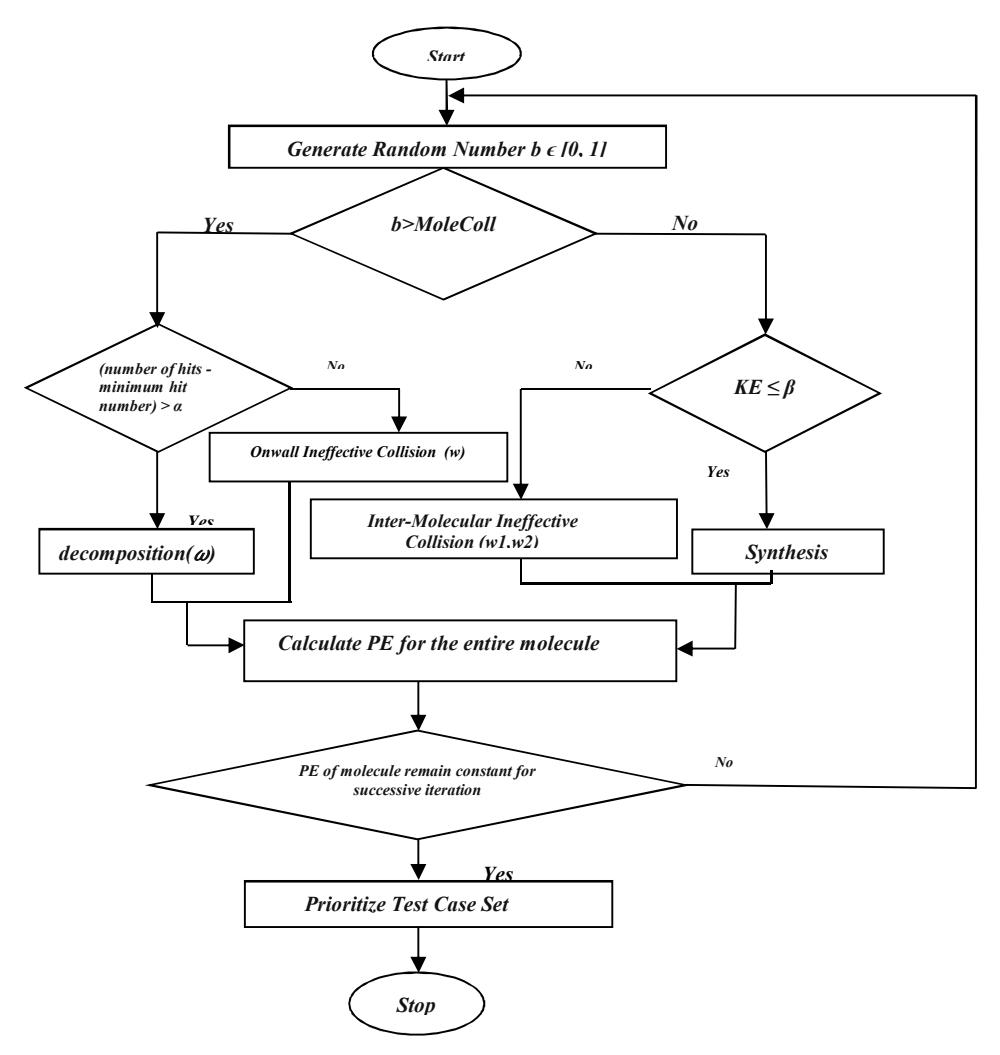
Figure 4 CRO test case prioritization algorithm and flow chart.
6 CRO Operators for Test Case Prioritization
CRO mimics the operation of molecules in a chemical reaction. Low energy gives high stability so the initial reactants create a high-energy and unstable state. They undergo a sequence of collisions and produce a product in a stable
low-energy state. The correspondence between optimization and a chemical reaction can be easily seen. This meta-heuristic algorithm was developed by Lam, et al. [15] in 2010.
A molecule in CRO represents a candidate solution. Each molecule denotes a solution of the specific problem and it also becomes a point in the search space. Like genetic algorithms, where a population contains chromosomes, in this case the population contains molecules. Each molecule's fitness is decided by its potential energy (PE), which is the same as the fitness function of a GA. New molecules in CRO are generated using this potential energy and different CRO operators. In CRO, different collisions occur either between molecules or with the container. These collisions represent different operators or reactions in CRO. The major elementary reactions of CRO are:
- 1. On-wall ineffective collision
- 2. Decomposition
- 3. Inter-molecular ineffective collision
- 4. Synthesis
CRO has been successfully used to solve optimization problems. It is better than other heuristic techniques in both continuous as well as discrete problems. CRO has several advantages over other techniques, as described by Lam [15]. The definitions of the components of CRO for test case prioritization are as follows:
6.1 Potential Energy (PE)
The potential energy, represented by Eq. (6), assigns each test molecule a potential energy based on two major factors:
- 1. Code coverage percentage of the molecule
- 2. Time at which each test covers its associated code in the program
The potential energy is divided into two parts. The first component, PEpri, is used to calculate the code coverage of the entire test molecule ω. It ensures the overall coverage of the molecule, which is more important for test case prioritization than the ordering. PEpri is weighted by multiplying the percentage of code covered by the program coverage weight, W. The selection of W's value should be sufficiently large so that when PEpri and PEsec are added together, PEpri dominates the result. The primary potential energy PEpri for a molecule ωi is given by Eq. (2):
\[PE_{pri} = code\_coverage(P, \omega_i) * W\] (2)
The second component, PEsec, considers the individual coverage of the test case. It uses incremental code coverage of the molecule, giving precedence to test
molecules whose earlier tests had greater coverage. \(PE_{sec}\) is also calculated in two parts. First, \(PE_{sec\text{-actual}}\) is computed by adding the multiplication of the execution time (\(\langle T_j \rangle\)) and the code coverage of the sub-molecules \(\omega_i(1,j) = \langle T_1, T_2, \dots T_j \rangle\) for each test case \(T_j \in \omega_i\). Formally, some molecule \(\omega_i\) contains random test tuples, which are the power set of T (perms(\(2^T\))) as shown in Eq. (3),
\[PE_{\text{sec-actual}}(P, \omega_i) = \sum_{j=1}^{|\omega_i|} time(\langle Tj \rangle) X \ code\_coverage(P, \omega_i(1, j)) \ (3)\]
\(PE_{sec-max}\) represents the possible maximum value that \(PE_{sec-actual}\) can take (i.e. the value of \(PE_{sec-actual}\) if T1 covers 100% of the code covered by T). Some molecule \(\omega_i\) contains random test tuples, which are the power set of T (perms(2<sup>T</sup>)) as shown in Eq. (4),
\[PE_{sec\text{-max}}\left(P,\omega_{i}\right) = code\_coverage(P,\omega_{i}) \ X \ \sum_{j=1}^{|\omega i|} time(< Tj >) \tag{4}\]
Finally, \(PE_{sec-actual}\) and \(PE_{sec-max}\) are used to calculate \(PE_{sec}\). Specifically, some molecule \(\omega_i\) contains random test tuples, which are the power set of T (perms(\(2^T\))) as shown in Eq.(5),
\[PEsec = \frac{PEsec-actual (P,wi)}{PEsec-max(P,wi)}\] (5)
The potential energy is given by following Eq.(6):
\[PE = PE_{pri} + PE_{sec}\] (6)
6.2 Initial Solution Generator
This operator is used to generate molecules for CRO. It creates the molecules with a size of MolSize. Initially, \(\omega_0\) is empty. Test cases are added from the set of available test cases, i.e. \(T = \langle T_1, T_2, \ldots, T_n \rangle\), where \(\omega_i\) contains random test cases that are the power set of T (perms(\(2^T\))). The molecules and algorithm are shown in Figure 5.
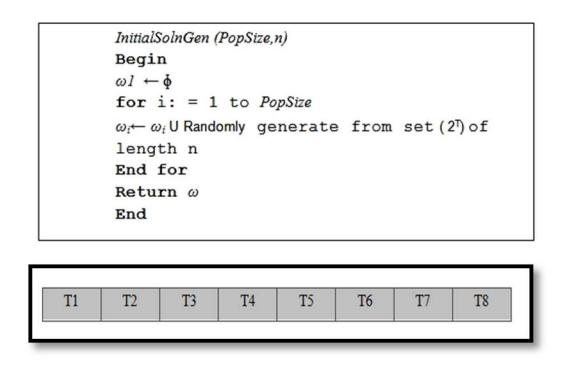
Figure 5 Initial solution generator algorithm and procedure.
6.3 On-Wall Ineffective Collision
In CRO, on-wall ineffective collision is used to find a neighbor of solution ω in search space, as represented in Figure 6. For our problem, the mutation operator of the genetic algorithm was found suitable so it was used for on-wall ineffective collision. In the process of on-wall ineffective collision, one position i in solution ω will be chosen and the value of ωi is replaced with a test case that is not present in the molecule.
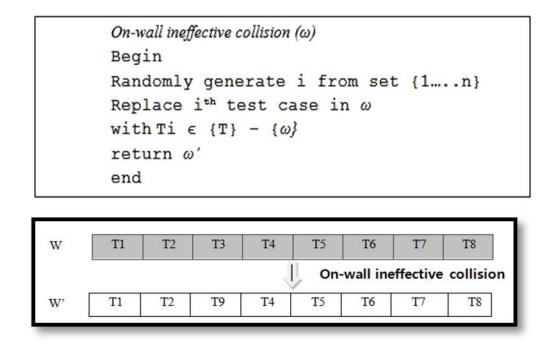
Figure 6 On-wall ineffective collision algorithm and procedure.
6.4 Decomposition
Diversification in CRO is achieved by decomposition. It produces two solutions from one original solution. This is designed according to the half-total-exchange operator that was used to solve the channel assignment problem in [10]. The operator creates two solutions, ω1 and ω2, from solution ω. First, ω is duplicated to generate ω1 and ω2. After that, exchanges for n/2 positions in solutions ω1 and ω2 are made randomly, as shown in Figure 7.
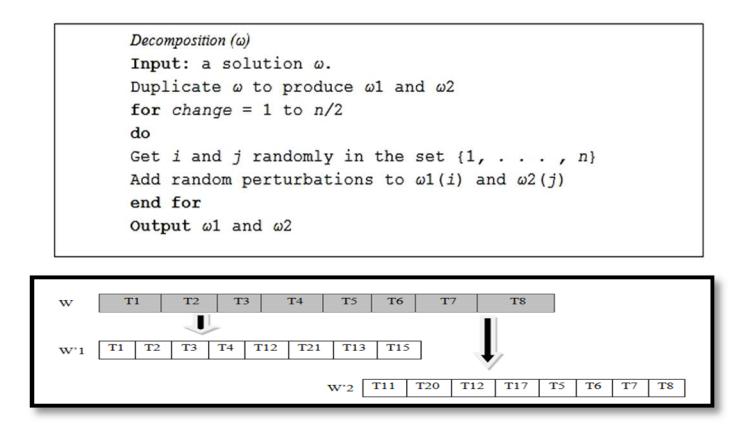
Figure 7 Decomposition algorithm and procedure.
6.5 Synthesis Operator
The synthesis operator employed in [13] was used in this study. The operator produces a molecule, ω, by combining two molecules, ω1 and ω2. Each molecule ω(i) is randomly selected either from ω1(i) or ω2(i). The detailed process and algorithm are represented in Figure 8.
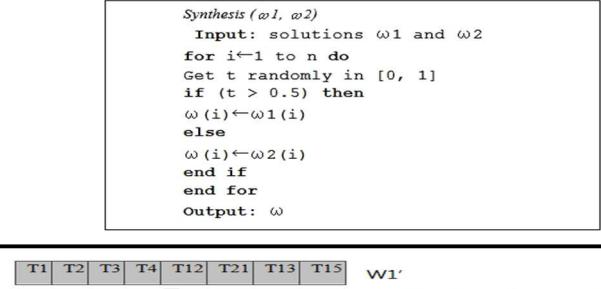
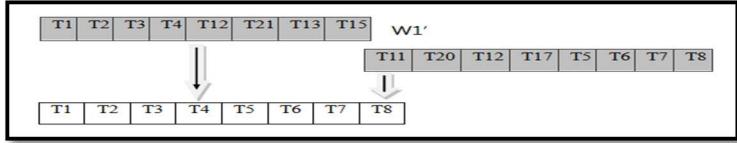
Figure 8 Synthesis algorithm and procedure.
6.6 Inter-Molecular Ineffective Collision
| го1 | T02 | T03 | T04 | T05 | T06 | T07 | T08 |
|---|---|---|---|---|---|---|---|
| T11 | T21 | T13 | T41 | T54 | T61 | T17 | T81 |
| T. | 710° | * | |||||
| T01 | T02 | T13 | T41 | T54 | T61 | T07 | TOS |
| T21 | |||||||
| T11 | T03 | T04 | T05 | T06 | T17 | T81 |
Figure 9 Inter-molecular ineffective collision algorithm and procedure.
Figure 9 represents intermolecular ineffective collision producing two new molecules, ω1 and ω2, from two old molecules, ω1 and ω2. For this, GA's
popular crossover was used in this study. Two-point crossover is best suited, so this was applied. In two-point crossover, two points are randomly selected. These points separate a molecule in three parts. Solution ω1 is created from the even parts of ω1 combined with the odd parts of ω2. Solution ω2 is created from the even parts of ω2 combined with the odd parts of ω1.
7 Experiments
To investigate the effectiveness of our new technique, several empirical studies were performed. The techniques used for comparison were a random technique and the genetic algorithm-based technique of Sudhir, et al. [29]. In the following, we will refer to these techniques as 'Random' and 'GA'.
7.1 Research Questions
- Q1: Can the order sequence technique increase the rate of fault detection more significantly than the two compared techniques?
- Q2: Can the order sequence technique detect bugs in the loop more quickly than the other techniques?
- Q3: Is the order sequence technique efficient in terms of time and space complexity?
7.2 Subject Program and Test Case
Table 2 shows the details of the subject programs and the collected test caserequirement matrixes. Column 1 lists all the subject programs. Column 2 lists the number of lines of code (LOC) of each subject program. Column 3 lists the size of the corresponding subject program's test suit pool, where T denotes the number of all test cases and R denotes the number of test requirements. Three programs were studied, ranging from 1864 to 3095 lines of code (LOC). The three Java programs in our experiment were: Power Equalizer (PEQ), Transmission Control (TC), and Stock Index Prediction (STOCK), developed by students at the Master of Technology of SOA University. The features of these programs are given in Table 2.
| Program | Source file (LOC) | Test suite pool (T X R) | Mutation fault | Total statement coverage |
|---|---|---|---|---|
| PEQ | 1864 | 169 X 98 | 520 | 79.2% |
| TC | 2987 | 228 X 96 | 891 | 58.1 % |
| STOCK | 3095 | 397 X 128 | 993 | 67.2% |
Table 2 Summary of programs used in experiment.
7.3 Acquisition of Useful Information of Test Case
Emma and Ant Tool were used to collect the coverage information of the system under test (SUT). The data collected were the code coverage and the time of execution of the test case; detailed information is given in Table 2. The process consisted of three steps: instrumentation, execution, and reporting. In the instrumentation phase, auxiliary information is added to the source program. Different granularities can be supported in this step. Next, the executable code can be generated. Lastly, the instrumentation code is executed and the coverage measurement is saved in the log. From this log, coverage metrics are calculated for report generation.
7.4 Experimental Setup
The three techniques were implemented using MATLAB. Once program specific information was gathered, the result was used by MATLAB to generate optimal ordering. All the implemented techniques were executed on a PC with an Intel Pentium 2.26 GHz CPU and 512 M memory running the Windows 2000 Professional operating system. Statement-level granularity was used and statement coverage information of the individual programs was collected using Emma. To avoid randomness, 100 replications of each program were run. The effectiveness of the proposed prioritization technique was measured by collecting base version information and subsequently collecting faulty version information. Subsequently, faulty versions were generated by generating mutants using Jumble. The mutant fault information is given in Table 2.
Q1: In order to compare the fault detection rate, the APFD metric was used. A higher APFD value means a faster fault detection rate (APFD was discussed in Section 3 of this paper).
Figure 10 shows box-whisker plots of the three subject programs. It contains the values of all 100 groups of data. Figure 9 clearly shows that the values of the CRO based technique were always higher than those of the other techniques. The mean value of the CRO technique was higher than that of the others. Therefore, we can conclude that the CRO based technique has a higher APFD value than the other two techniques, which indicates a faster rate of fault detection. We also did a T-test to check the consistency of the different APFD values of the above three techniques. The test returned a p-value of less than 0.001. This is sufficient to reject the null hypothesis at 95% significance level.
Q2: In this section, the potential of the algorithm to detect bugs in loops for the above three prioritizations is determined. The reason to choose loops is that this type of bugs has more chance to be relative to the ordered sequence of program
elements measured by execution frequency. The number of bugs present in the loop to be detected was 81, 90 and 778 respectively.
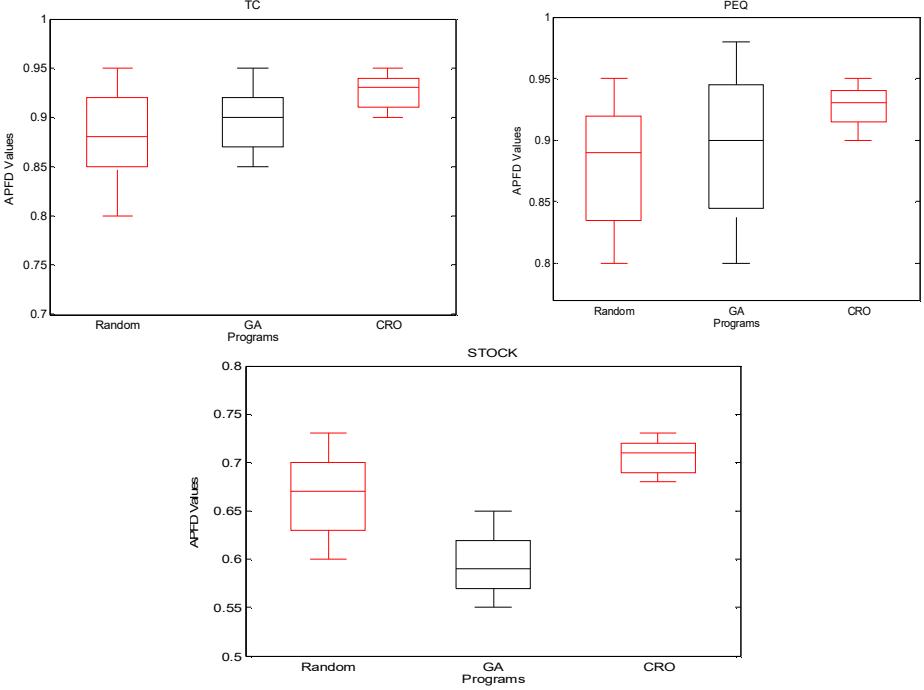
Figure 10Result of APFD on the three subject programs.
The graphs in Figure 11 represent the test case number on the X-axis and bugs in loops on the Y-axis. It can be observed from this figure that for all the test programs, the CRO technique found more bugs at the beginning. Hence, this technique will also be helpful in a situation where regression testing is terminated due to limited resources.
In Figure 12, the X-axis represents (number of generations, population size), while the Y-axis represents the time of execution of the CRO algorithm. The algorithms took a maximum of 11.66 minutes for the STOCK program. The memory requirement was less then 100KB, as found in the MATLAB implementation of the program.
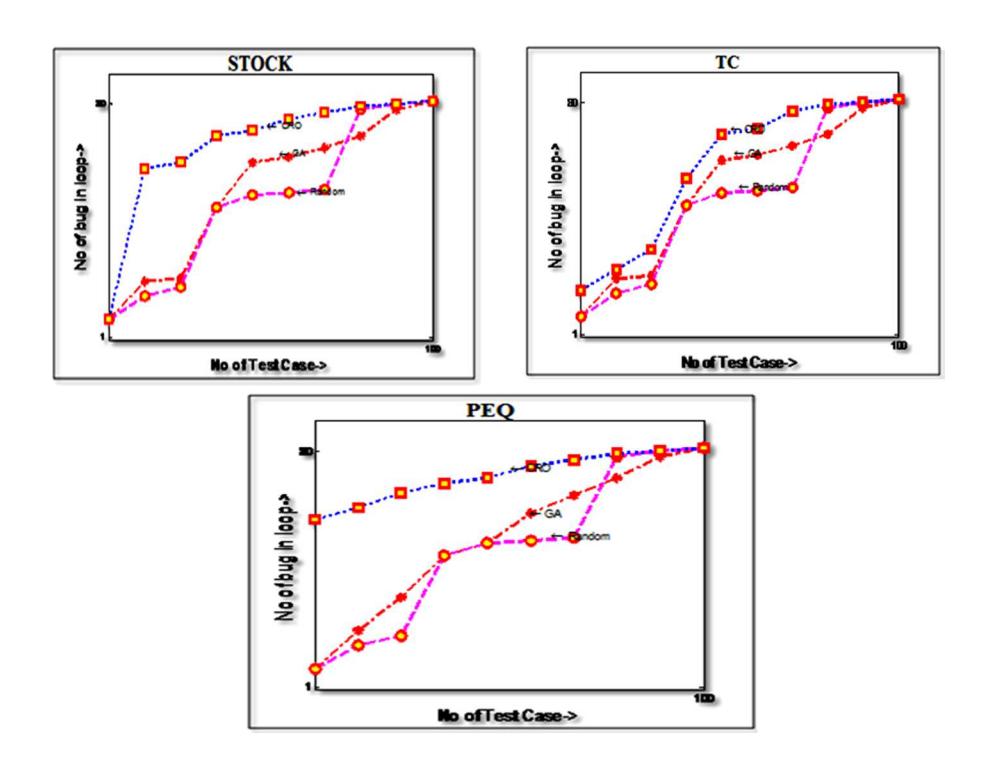
Figure 11 Detection of bugs in loops on three subject programs.
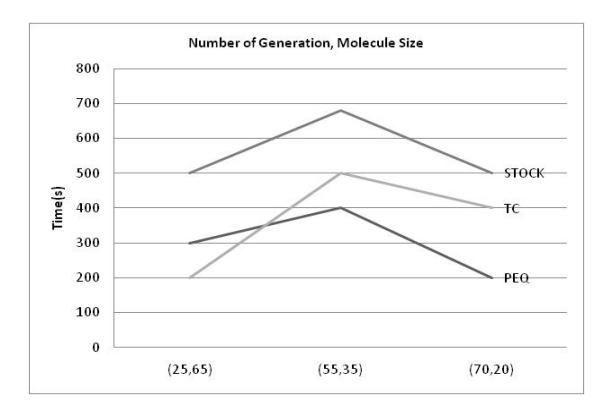
Figure 12 Graph showing the number of generations and the number of molecules per generation.
7.5 Threat to Validity
Our implementation and its correctness are subject to threats to internal validity. To reduce this threat, a thorough check of the programs and results was done
multiple times. Here, the proposed technique was only compared with Random and GA, but in future research it will be compared with more techniques.
8 Conclusions
In this research, the CRO algorithm was implemented to prioritize test cases. The experimental analysis demonstrated that this approach can create an order of test cases with a better APFD value while consuming a reasonable amount of time and memory. This technique is able to detect bugs in the early stages of execution, which can be useful in case of early termination of regression testing due to resource constraints. Future research will include the improvement of performance in real-life, large object-oriented applications. Also, some implementation techniques can be introduced that are commonly used by other test case prioritization techniques and implementing them in parallel.