
1 Introduction
Cancer of the cervix is the 4th most common cancer among women worldwide, with an estimated 527,624 new cases and 265,672 deaths in 2012 (GLOBOCAN). About 20,928 new cervical cancer cases are diagnosed annually in Indonesia (estimations for 2012) [1]. Several methods are used in clinical practice in Indonesia to diagnose cervical cancer. The most popular program, endorsed by the Ministry of Health, is IVA (Inspeksi Visual Asam Asetat in Bahasa Indonesia), which visualizes the changing color of cervical areas in reaction to acid. This method is cheap and available in the primary care facilities across Indonesia. When women are diagnosed positive, they are asked
Received October 28th, 2015, 1st Revision November 9th, 2016, 2nd Revision April 19th, 2017, Accepted for publication July, 31st, 2017.
Copyright © 2017 Published by ITB Journal Publisher, ISSN: 2337-5787, DOI: 10.5614/itbj.ict.res.appl.2017.11.3.1 to get a Pap smear test. Another method of cervical cancer diagnosis is using an HPV-genetic marker, which can indicate whether a woman is prone to HPV. However, this method is not yet available in the primary care facilities across the nation. Also, Raman/FTIR spectroscopy holds some promise as a diagnostic tool of cervical cancer in vivo. However, this method is not yet used in clinical practice in Indonesia.
Pap smearing is a microscopic examination method to detect early symptoms of cervical cancer. Manual interpretation of Pap smears is very complicated and time-consuming. This is because, in general, the image of a Pap smear contains clustered cells, overlapping cells, as well as other problems such as uneven coloring. Malignancies manifest themselves predominantly as abnormalities of individual cells [2]. The overlapping of cell nuclei happens very often and makes the image of a Pap smear hard to analyze accurately, either manually or automatically through computer assistance.
The accuracy of the analysis of Pap smear tests is highly influenced by the general shape of the nuclei area. The nucleus is an important part of the cell that shows significant changes when the cells are affected by the disease. Changes in general form are the initial criteria to find these abnormalities. Anatomical pathology specialists make decisions based on visual inspection of a large number of cells and diagnostic features, such as the ratio between the size of the nucleus and the cytoplasm, or the shape of the nucleus in each cell.
In recent years, several studies have been conducted to help anatomical pathology specialists in the process of Pap smear image interpretation, among others:
- 1. Research in the detection of the number of nuclei [3-5]. These studies focused on detecting the position of the nuclei and counting the number of cells on a Pap smear image automatically. Counting the number of cell nuclei is a standard procedure that should be performed in the determination of eligibility slide preparations to be used.
- 2. Research in segmentation nuclei [6,7]. These studies were aimed at finding the boundaries of the nuclei, as well as extracting features in the nuclei such as color, size, shape, etc. and obtaining important information that can be used to distinguish between normal and abnormal cells.
- 3. Research on the classification of cervical cells based on features of the nuclei [8-12]. These studies were conducted to classify types of cervical cells and differentiate between normal and abnormal cells automatically based on nuclei features.
Figure 1 Illustration of failure in overlapping cell detection. (a) Initial image, (b) results of image segmentation of Pap smear with place marks of nuclei (solid dots, •).
Overlapping cell nuclei are the main obstacle affecting the degree of accuracy of the results of some of the researches above. For example, in detection of the number of nuclei (1), overlapping cells are mostly counted as one cell. This happens because the overlapping cells cannot be separated very well. Figure 1 illustrates failure of the process of cell separation leading to two overlapping cell nuclei being counted as one.
Furthermore, even when nuclei segmentation (2) is able to separate the nuclei of cells that overlap, the result may not adequately represent the actual boundaries of the nuclei. Precision in the separation of cell nuclei is essential. Separation of nuclei that is imprecise affects the result of the classification of cervical cells (3). In the classification of cervical cells (3), imprecise segmentation results will be classified as abnormal cells. This is because one of the criteria for normal cells is unchanged shape (resembling an elliptical shape). Figure 2 illustrates imprecise separation of cells.
Figure 2 Illustration of imprecise separation of cell nuclei. (a) Result of Pap smear segmentation image, (b) result of imprecise separation, (c) expected result.
A radial-based cell formation method for separating overlapping cells has been proposed by Kanafiah, et al.[13]. The radius ratio between any predetermined point within the overlapping cells and all the perimeter pixels is evaluated until a certain value of α is reached. This approach is computationally more expensive than the method proposed in this paper.
This study discusses the process of automatically splitting the nuclei of cells that overlap with precision using watershed transformation and an elliptical approach. Several methods to separate overlapping nuclei have been investigated, such as Deformable Contours [14] and Level Sets [15], which introduced the functional energy of the algorithm to prevent the contours of the cell nucleus (nuclei) to overlap. Wu, et al. [16] obtained the boundaries of nuclei by solving the optimal thresholding problem. H-minima Transform-Based Marker Extraction and Contour Parameterization [17] uses H-minima transformation to obtain optimal segmentation results from a distance map. However, all these methods take a lot of computing time with many parameters that must be adjusted when using a different dataset. Concavity Points [18] separates overlapping cells using two or more concavity points that have been detected earlier, but segmentation of nucleus concavities usually does not produce only one point, so that the overlapping cell separation process cannot be done. Figure 3 shows that not all segmentation results produce two or more concavity points.
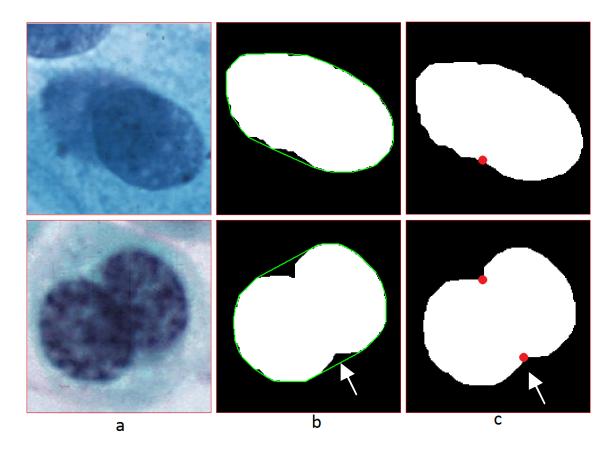
Figure 3 Illustration of concavity points: (a) image of overlapping cells, (b) result of nuclei segmentation (blobs) and convex hull (line curves), (c) 1 concavity point (dot) detected (picture above), and 2 concavity points detected (image below).
The present study focused on the process of automatic separation of overlapping cells. This is an important step for the interpretation of Pap smear images, where cell overlap is a common phenomenon. The proposed model was evaluated in terms of computing time efficiency and accuracy of the separation of the boundaries of the nuclei. The computing time efficiency of the proposed method was compared with that of similar studies and evaluation of separation accuracy was performed by comparing the segmentation results of the proposed
model with manual tracing results by anatomical pathology specialists using Euclidean distance.
Identification of the boundaries of appropriate nuclei is very important in the interpretation of Pap smear images. It needs to be done considering that the nuclei provide important information about cell pathology. The model to separate the overlapping nuclei of cells of the cervix is discussed in the next section. The use of the data and results and discussion of the proposed model are presented in Section 3, while the conclusion is given in Section 4.
2 Method
In this study, two stages are used in the separation of overlapping nuclei, namely: (1) cell nuclei separation using watershed transformation, and (2) refinement of nucleus boundaries using an elliptical approach. For the first stage this study proposes a model for automatically determining the initial seed of the watershed transformation, unlike in the traditional watershed transformation process, where the initial seed is determined manually. Furthermore, the elliptical approach was used to fix the boundaries of overlapping nuclei in the second stage.
The watershed algorithm was used in this study because it is one of the most widely used segmentation techniques [19]. However, this algorithm requires the input of a starting point to be able to run. This study proposes a technique to obtain the initial seed automatically. Watershed transformation generally produces less precise segmentation. The next step is to repair the nucleus area with the elliptical approach because it can represent the nucleus boundaries accurately [20]. Figure 4 shows the results of the separation of overlapping nuclei using watershed transformation.
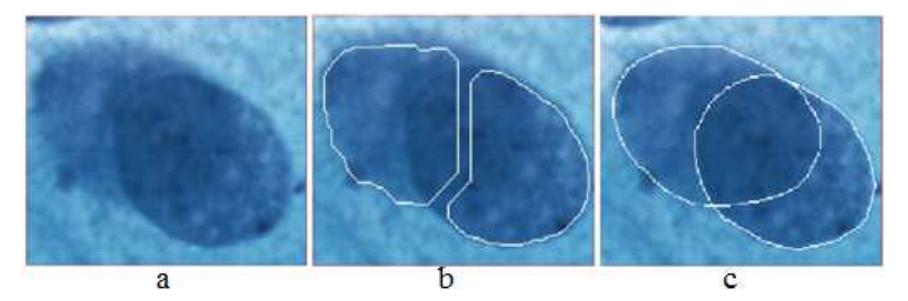
Figure 4 Illustration of cell nuclei separation using the watershed transformation algorithm: (a) image of overlapping cells, (b) result of nuclei segmentation (white) using watershed transformation, (c) result of manual tracing by experts.
Nuclei segmentation in this research is done using a model that has been proposed previously [9] and tested with the same dataset that will be used in the present study. It is noteworthy that the previously proposed method [9] went through a random inspection by experts with very good accuracy.
2.1 Cell Nuclei Separation Using Watershed Transformation
To separate overlapping nuclei using watershed transformation, the first thing to do is to determine the initial seed. In this study, the initial seed is automatically obtained through the local minima of nuclei regions. However, nuclei regions have a color intensity that is not homogeneous. This means that nuclei regions can have more than one region minima. Figure 5 shows the locations of the region minima from the results of nuclei segmentation, which are marked with a dot (•). From Figure 5, the nuclei with labels 10 and 14 have more than one region minima. Meanwhile, the other nuclei have only one region minima.
Figure 5 Nuclei containing several region minima (marked with solid dots (•)).
The expected result of the proposed method is only one region minima per nucleus, which is used as the initial seed in the cell separation process using watershed transformation. In the proposed method, if a nucleus has more than one region minima, the distance to the centroid representing the region minima will be calculated. If the distance between the centroid is less than the value of T (in this study the value of T = 35) the intensity of its color will be compared to the intensity of the color of the second centroid. The centroid with the lowest color intensity will be kept, while the centroid with the highest color intensity will be eliminated.
The following algorithm describes the process that occurs:
Algorithm 1. Finding Region Minima
    1:
         Input images s;
    2: g \leftarrow labels on the image s;
    3: NL \leftarrow number label of the image g
         (step 2);
    4: Cb \leftarrow perform distance transform with
         city-block method from g (step 2);
         Rm \leftarrow region minima from Cb (step 4):
         F \leftarrow XOR(Rm, s);
                            0, F(x, y) = 0
    7:
                      g(x,y), F(x,y) = 1
                           x is the abscissa and y is the
                           ordinate of the pixels in the image;
    8:
        i=1;
        Repeat;
   10:
            Nc←number of centroids
            from Im (step 7), where \exists I(x, y) = i;
   12:
              if Nc > 1;
   13:
             temp = \emptyset;
   14:
                 repeat;
   15:
                 \forall p = (x, y) \in R_c;
   16:
                 exist q = \{(x_q, y_q) | D(p, q) \le T\};
   17:
                   temp=\{temp, p, q | \max\{I(p), I(q)\}\};
   18:
                 until p evaluated;
   19:
                 Utemp = unique(temp);
  20:
                 RcNew = Rc\Delta Utemp;
  21:
               end:
  22:
         i++:
  23:
         until i=NL;
  24:
         Output RcNew:
The first step is to label each area in the image segmentation result (s). The next step is to calculate the number of areas that have been labeled. The distance transform operation is then performed on the image that has been labeled (s) with the city-block method. Furthermore, the process of determining the region minima is performed on the operating results of the distance transform image (Cb). The output image of the region minima is a binary image that is combined with the results of image segmentation s using the XOR operator. In addition, if the output image at step 6 (F) has a value in pixels = 1, it will be converted to the value of the same pixel in image g.
Furthermore, Rc is the set of centroids obtained from image F (step 6), D is the Euclidean distance between the two centroids, T is the threshold value of the minimum distance between the centroids, I (p) is the intensity of the image at centroid P, and temp is a temporary storage variable. The difference in color intensity between centroids at less than the minimum distance is then compared. Centroid pixel coordinates with low intensity will survive and coordinate pixel centroids with high intensity will be stored in temp. In the proposed method, the value of T was obtained from a series of experiments (T = 35). If the value of T is set too high, the centroid may fit in and the nucleus will be lost, i.e. overlapping nuclei are not successfully separated. On the other hand, if the value of T is set too low, many centroids will be labeled as nuclei. In other words, non-overlapping nuclei could be considered as overlap because in the labeled nuclei there is more than one centroid. Utemp is a set that contains the values of temp that are not redundant. RcNew is the symmetry difference (Δ) between Rc and Utemp. RcNew values are the coordinates of new centroids. The algorithm is repeated until the entire p has been evaluated and all centroids have been evaluated by a combination of the q.
The algorithm above generates a point that is used as the initial seed in the watershed transformation process (see Figure 5). The number of points representing the number of nuclei contained in the image is also used. Figure 9(b) shows the result of the stage of cell nuclei separation using watershed transformation.
2.2 Refinement of Nucleus Boundaries Using An Elliptical Approach (Centroid Shifting Stage)
The result of overlapping cell separation using watershed transformation produces a segmentation that does not adequately represent the boundaries of the nuclei. At this stage, the elliptical approach is used to correct the boundaries of the nuclei. For each detected cell nucleus, the semi-major axis and the semiminor axis of the nuclei area needs to be found. To obtain the semi-major axis of the ellipse we need the coordinates of each pixel on the perimeter of the nucleus. To obtain the semi-major axis, the pixel coordinates on the perimeter are required at a distance (Euclidean) farthest from the centroid. Furthermore, to get the coordinates of the minor axis, the coordinates of the pixel that are perpendicular to the semi-major axis can be used. To obtain a point perpendicular to the semi-major axis is done by the following Eq. (1):
\[dx = x_2 - x_1 (1)\]
\[dy = y_2 - y_1;\]
(-dy, dx) and (dy, -dx)
where x1 and y1 are the coordinates of the centroid, and x2 and y2 are the coordinates of the point on the semi-major axis. With these equations, we can find the coordinates that are perpendicular to the semi-major axis. However, the length of the coordinates that are perpendicular to the semi-major axis is equal to the semi-major axis. This causes the coordinates to be positioned outside the nucleus bounds (see Figure 7 (d)). To obtain the coordinates of the pixels that are perpendicular to the semi-major axis and located within the boundaries of the nucleus, the following Eq. (2) can be used:
\[m = (y_2 - y_1)/(x_2 - x_1); y = mx + b\] (2)
where x1 and y1 are the coordinates of the centroid, and x2 and y2 are the coordinates of the point of the semi-major axis.
Furthermore, the two semi-minor axes obtained will be compared in length (Figure 7(e)) with line (b1) and line (b2)). The coordinates with the longest distance from the centroid will be considered the semi-minor axis (Figure 7(f)). After obtaining the semi-major axis and semi-minor axis, an ellipse is produced that can be used as a marker of the boundaries of the nuclei.
Figure 6 Image of nuclei with boundaries of the cell separation result by the proposed method: (a) is a magnification of (b), where A (solid triangle, ▲) is the centroid from the segmentation process at the stage of cell separation with watershed transformation and B (solid squares, □) are the centroid generated in the shifting stage.
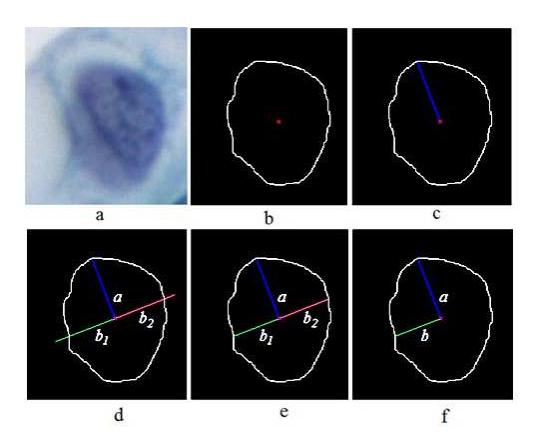
Figure 7 (a) Part of the initial image, (b) nucleus boundaries, (c) nucleus boundaries with semi-major axis, (d) finding 90-degree axis using semi-major axis, (c) nucleus boundaries with minor axis, (e) resulted nucleus boundaries with semi-minor axis (b).
However, in order that the resulting ellipse correctly represents the boundaries of the precise nuclei, it is necessary to shift the centroid coordinates. Figure 8(b) shows that the ellipse formed by the semi-major axis (a) and the semi-minor axis (b) is not eligible to represent the boundaries of the nuclei. After shifting the coordinates of the centroid (Figure 8(d)) the resulting ellipse accurately represents the boundaries of nuclei.
Figure 8 (a) Image of nuclei with boundaries generated in the stage of cell separation using watershed transformation, with the major and minor axis; (b) image of nuclei with the boundaries of the ellipse formed by the major and minor axes in (a); (c) image of nuclei with boundaries generated in the stage of cell separation using watershed transformation, with the major and minor axis centroids generated by shifting the centroids; (d) image of nuclei with the boundaries of the ellipse formed by the major and minor axis in (c).
Figure 6(a) shows the shifting of the centroids, where A is the centroid obtained by finding the coordinates of the centers from the nuclei segmentation result and B is the centroid resulting from the process of shifting the coordinates of the centroid. To obtain the coordinates of point B the following steps are performed:
Algorithm 2. Shifting Centroid Coordinates
        if centroid(y) \ge centroid(x)then
        A = centroid(y);
   3:
        B = centroid(x);
        Else
   4:
   5:
        if centroid(y) == max C_l \mathbf{t} hen
                      A = \frac{centroid(y)^2 - b^2}{centroid(v)};
   6:
   7:
        Else
                      A = \frac{centroid(y)^2 + b^2}{centroid(y)};
   8:
   9:
        if centroid(x) == maxC_2 then
  10:
                  B = \frac{centroid(x)^2 - (a+b)^2}{centroid(x)};
  12:
  13:
                  B = \frac{centroid(x)^2 + (a+b)^2}{centroid(x)};
  14:
  15:
        End
  16:
        End
where a is the length of the semi-major axis, b is the length of the semi-minor axis, x and y are the coordinates of the centroid, \(maxC_1\) and \(maxC_2\) are the coordinates of the centroid that has the largest detected value of the centroids, A and B are the coordinates of the centroid shifting process result.
After obtaining the new coordinates of the centroid of each nucleus, we can create an elliptical object using the semi-major and semi-minor axes that have been obtained from the respective nuclei. We assume that each nucleus is an elliptical object with a different diameter and different degrees of slope. To obtain the degree of slope of the ellipse, the following formula is used:
\[\theta = tan^{-1} \left( \frac{x_2 - x_1}{y_2 - y_1} \right) \tag{3}\] where \(x_1\) and \(y_1\) are the coordinates of the centroid, and \(x_2\) and \(y_2\) are the coordinates of the point of the semi-major axis. Next, using the results of the value of \(\theta\) in Eq. (3), the values of the radians in every nucleus are obtained by the following formula:
\[rad = \theta \times \frac{\pi}{180} \tag{4}\]
Furthermore, we can find the value of the rotation vector using the radians value obtained in Eq. (4). The rotation vector is given by the following Eq.(5):
\[R = \begin{bmatrix} \cos(rad) & \sin(rad) \\ -\sin(rad) & \cos(rad) \end{bmatrix}\] (5)
where 61- is the outcome from finding the value in the radians process as shown in the following Eq. (6):
\[xy(t) = \begin{pmatrix} \begin{bmatrix} a\cos t \\ b\sin t \end{bmatrix} \end{pmatrix} \times R \tag{6}\] where a is the distance to the semi-major axis, b is the distance to the semiminor axis, t is [0-2π], and R is the outcome from the vector rotation process. Finally, we make a closed curve to form an elliptical object using the following Eq. (7):
\[x = xy(x) + x_1; y = xy(y) + y_1;\] (7)
where x1and y1 are the pixel coordinates of the centroids.
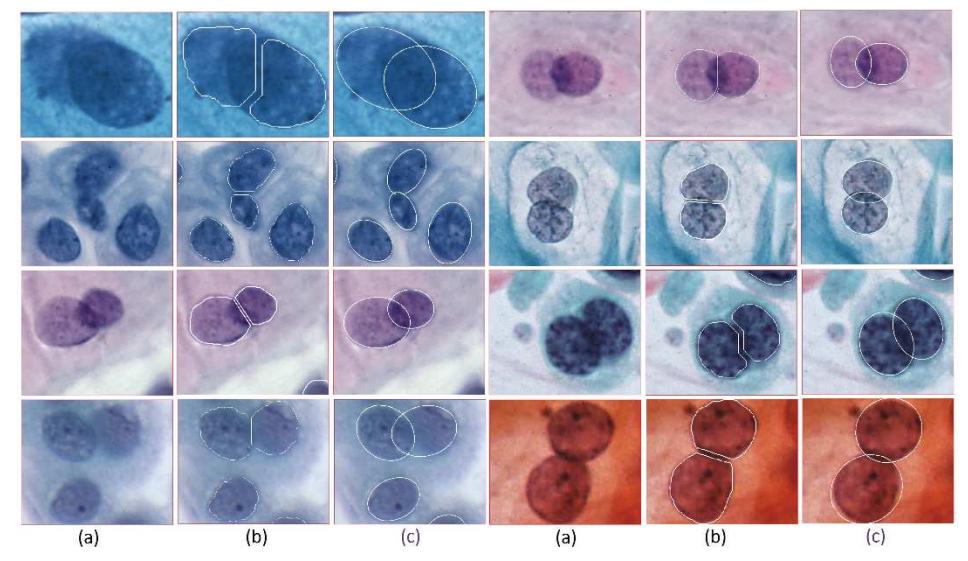
Figure 9 (a) Initial image, (b) result of cell nuclei separation using watershed transformation, (c) result of refinement of nuclei boundaries using the elliptical approach.
3 Result and Discussion
The proposed method was tested on 15 Pap smear images from the NCI Bethesda system [7]. The size of the images was 1600 × 2000 and they were stored in JPG format. The images contained 318 cell nuclei. This amount was confirmed by anatomical pathology experts in two different time readings to prevent any biased interpretation. The dataset used contained overlapping and non-overlapping cell nuclei to examine the robustness of the proposed method in a variety of Pap smear images.
Table 1 shows the computing time at each step of the proposed method. The proposed method was developed using Matlab software on a dual-core 2.80 GHz and 2 GB RAM personal computer. At the stage of cell nucleus separation using watershed transformation, the low value of the standard deviation (± 1.33 sec.) indicates small differences in computing time between each image used. However, at the stage of refinement of the nuclei boundaries using the elliptical approach there was a more significant difference in computing time for each image used. This is indicated by a relatively high value of standard deviation (± 4.11 sec.). The difference in computing time in this phase is due to the formation of an ellipse for each nucleus. The more nuclei are contained in an image, the more computation processing is needed. The computing time required to form the boundaries of a nucleus using the elliptical approach was mean ± 0.21 seconds per nucleus.
Table 1 Execution time.
| Step | Time (sec) (mean ± std) | |
|---|---|---|
| Cell nuclei separation using watershed transformation | 10.83 ± 1.33 | |
| Refinement of nuclei boundaries using elliptical approach | 6.27 ± 4.11 | |
Table 2 shows the results of comparing the number of cells counted manually by experts (NOC by pathologists) or with the proposed method (NOC by proposed method). The percentage of false cell nuclei detection is very small. Errors when using the proposed method only occurred in files 7, 8, 9, 12 and 13. The proposed method was able to detect 312 of 318 nuclei contained in the dataset, or in other words 98% of nuclei were detected properly in the absence of positive errors. As a note, a negative error percentage indicates that there was a failure in the process of cell separation using the proposed method, i.e. the system could not detect and separate overlapping cells. A negative error means that the number of cell nuclei counted by the proposed method is smaller than the number counted manually by the experts. The positive error percentage shows the separation of cells that are not overlapping. A positive error means that the number of cell nuclei counted by the proposed method is larger than the number counted manually by the experts.
Table 2 shows that the errors occurring were negative errors, where the proposed method could not recognize cells that overlapped so that the separation process could not be performed. In Table 2 there are no positive errors, which indicates that the proposed method was proven to be able to maintain the precise shape of the nuclei by not separating the nuclei of cells that do not overlap. A negative error that occurred when using the proposed method can be seen in Figure 10. Figure 10 shows that the nuclei overlap cannot be separated because the number of region minima detected was not equal to the number of nuclei.
| File | NOC by pathologist | proposed method | File | NOC by pathologist | noc by proposed method |
|---|---|---|---|---|---|
| 1 | 22 | 22 Error: 0% | 9 | 31 | 29 Error: -6.45% |
| 2 | 22 | 22 Error: 0% | 10 | 5 | 5 Error: 0% |
| 3 | 42 | 42 Error: 0% | 11 | 5 | 5 Error: 0% |
| 4 | 22 | 22 | 12 | 22 | 21 |
Error: -4.54%
Error: -4.54%
<u>Err</u>or: 0%
Error: 0%
Error: 0%
Error: 0%
Error: 0%
Error: -2.63%
Error: -4.75%
Table 2 Number of Components (NOC) and Errors produced.
The results of the proposed method can be seen in Figure 11. It shows that the proposed method could determine the boundaries of the nuclei accurately. Euclidean distance calculation to compare the similarity between two images (results of the proposed method and manual tracing by experts) was conducted to test the performance of the proposed method. The result of the performance measurement using Euclidean distance in each nucleus shows \(4.495 \pm 3.290\) (mean \(\pm\) STDEV), which means that the two images have almost the same value. It shows that the proposed method gives a very precise representation of the original shape of the nuclei. In addition, these results confirm that the proposed method can help make decisions on areas with overlapping nuclei and can help improve the accuracy of image analysis and avoid information loss during the process of image segmentation.
Figure 10 (a) Representative images containing overlapping nuclei; (b) detected centroids of regional minima, indicated by the marker 'o'; (c) result of cell nucleus separation using watershed transformation with nuclei that could not be separated automatically because they have only two region minima in the labeled area); (d) result of refinement of nuclei boundaries using the elliptical approach.
Figure 11 (a) Initial images, (b) result of the proposed method.
4 Conclusion
In this study, a method based on watershed transformation and an elliptical approach to separate overlapping nuclei area was developed. The proposed method can automatically determine the boundaries of nuclei that are overlapping or non-overlapping fast and accurately. The proposed method improves decision-making on areas with overlapping nuclei and enhances the accuracy of image analysis and avoids information loss during the process of image segmentation. For the next step of this work, we plan to segment the cytoplasm, which is one of the critical criteria for analyzing cervical cancer using the boundaries of the nuclei that have been detected in this study.
Acknowledgments
The research grant from Direktorat Penelitian dan Pengabdian Masyarakat/ Directorate of Research and Social Service (DPPM), Universitas Islam Indonesia with contract no. 082/Dir/DPPM/70/Pen.Pemula/XII/2014, dated 30 December 2014 is gratefully acknowledged.