
1 Introduction
Social networks play an important role in human life. They allow people to get connected and to share information worldwide. The profile of a user can be used as an artificial person. In such cases, an attacker uses this kind of network to assault or take advantage other people. A type of attack that is used for many purposes is Sybil, which means creating social bots in a social network to hijack or control users to penetrate the network and steal personal information, or share wrong information or malware [1,2].
Sybil attacks use the properties of the social network as a weapon. A fake person or a fake account is created for carrying out several nefarious actions, for example spamming, click fraud, sharing malware, or disguising oneself as another person. In some cases, the fake account is created for the purpose of increasing views or likes to posts or fan pages. It can also be used for cyber bullying or playing online games [3].
There are two different types of schemes that can be used to detect Sybil attacks. The first are called feature-based schemes and the second are known as
Received November 9th, 2017, Revision July 5th, 2018, Accepted for publication September 25th, 2018. Copyright © 2018 Published by ITB Journal Publisher, ISSN: 2337-5787, DOI: 10.5614/itbj.ict.res.appl.2018.12.2.6
topology-based schemes. Both types have limitations and design-related problems, as detailed in the following paragraphs.
First of all, feature-based methods rely on user-level activities and account details (i.e. user logs, profiles) [4]. A limitation of this approach is that an attacker is able to create details or profile information imitating a real user, which is called a cloning attack. The automated feature-based Sybil detection in [5,6] has shown high false negative and false positive rates due to the large variety of user activities and unpredictability of user behavior [3]. This decreases the efficiency of the method and limits its utilization on social online networks.
Secondly, topology-based methods are based on the assumption that fakes can establish only weak attack edges with real users. Actually, with the advancement of computer technology, attackers are able to create strong attack edges with real users. Apart from that, this type of method is based on the assumption of fast mixing. The calculation involved with the massive size of online social networks is considered difficult (NP-hard) and there are no publications on the prevention of Sybil attacks that properly substantiate the use of the mixing time.
As mentioned above, feature-based methods do not yield the desirable accuracy. Attackers can create fake accounts that are able to avoid detection [3]. However, attackers cannot make relations between fake accounts and real accounts the way real users do in a social network. This distinction can be used to detect Sybil attacks in various topology-based mechanisms. In addition, these mechanisms offer desirable security guarantees but there is little evidence supporting mixing time adoption, seeing their shortcomings in terms of effectiveness and efficiency on large social networks. Hence, this research used a topology-based method and aimed to answer the question: Can we use mixing time to detect Sybil nodes efficiently in large online social networks?
Our contributions are as follows. This paper firstly proposes a process to analyze the properties of online social networks in terms of fast mixing, which is mandatory for preventing Sybil attacks on social networks. The second purpose was to find the properties identifying Sybil nodes in social networks using a topology-based scheme. This research used a social network dataset obtained from [7] for investigating Sybil attacks on social networks after the fact.
This research investigated the mixing time property of social networks, which is commonly used to detect Sybil attacks. The mixing time of a social network containing only honest nodes tends to be faster than that of a social network
containing Sybil nodes. Several researchers have used the mixing time to detect Sybil nodes [3,8-18], but they did not sufficiently substantiate the underlying assumptions in their works. In this paper, we propose a process for measuring the mixing time in social networks using second largest eigenvalue modulus (SLEM). We evaluated this property to compare the mixing time value between honest and Sybil nodes.
Several researches have used topology-based methods to analyze the overall properties of a social network in order to predict or label Sybil nodes. However, there has been no research that analyzed the properties of individual nodes to distinguish between honest and Sybil nodes. This paper proposes a way to investigate the properties of all nodes in a social network so that Sybil nodes can be differentiated from honest nodes [10,16-18,19-22].
2 Related Works
The structure of Sybil attacks was first described in 2002 [23]. In this type of attack, a malicious user creates fake identities or accounts to participate in a social network. Then, the malicious user will use these identities for nefarious purposes, for example by influencing the working of systems that rely upon membership of a social network, such as content voting systems and recommendation systems.
One of the most popular properties applied for protection against attacks is using properties of graph theory to analyze suspected Sybil users. A social network can be represented as a graph, G = (V, E), where V represents a node, or user, present in the network, and E = the reliable correlations between users in the social network. We can also determine the number of all users (n = |V|)and the reliable correlation lines between users in the network (m = |E|).
As for the characteristics of Sybil identities, it is not possible to simultaneously create a large number of connections between Sybil nodes and honest nodes. This fact could possibly be used to analyze the topology of a social network for detecting Sybil nodes and distinguishing them from honest nodes. The key factor to prevent Sybil attacks is the structure of the social graph, which mainly consists of the area of the graph, a Sybil region and an honest region, respectively.
An honest region is a subgraph of G, which contains honest nodes connected with edges. A Sybil region is another subgraph, which contains Sybil nodes connected to one another with edges. Edges connecting an honest region and a Sybil region are called attack edges, as shown in Figure 1.
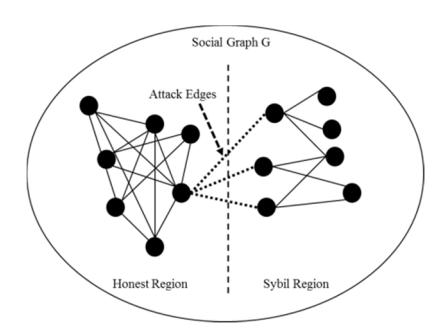
Figure 1 Attack edges, connecting an honest region with a Sybil region.
The identities created by malicious users are called Sybil identities, which are byzantine. The goal of creating a protective mechanism against Sybil attacks is to make honest nodes identify other nodes as either honest or Sybil nodes [24], and precisely identify the identity of Sybil users. The purpose is to enable the system to accept honest users and reject fake users [23].
Several researches have been done on Sybil attacks on social networks. Analyzing the properties of the network is one part of the investigation process. Sybil Guard and Sybil Limit are two of the first methods that have been proposed [8,9]. These methods both use the property of fast mixing in a social network. Yu, et al. [8] divided the area of the social network into two parts, namely honest and Sybil regions. Their method applies a verifier based on honest nodes and uses the random walk property to find a random route of nodes. This random route is used to detect nodes as either honest or Sybil. A node is considered an honest node when the random route of this node intersects with the random route of the verifier node (in the random route, a similar stationary distribution is determined for investigation). Yu, et al. [9] improved this process by using the last tail, i.e. the edges that connect the last node of the random route, instead of the intersection for consideration. If there is overlap, it means that the considered node is an honest node. However, this method has some problems. If a Sybil node is adjacent to a verified node, this may lead to an error of operation in the random walk, or if the random walk is too short, the last tail of the considered node and the verified node never overlap.
SybilInfer [10] is a prevention method that uses all information in a network and uses the random walk method on the mixing time together with Bayesian inference to identify Sybil nodes. This method is based on the assumption that the mixing time of a network graph containing Sybil nodes is slower than that of a network graph of honest nodes. However, this method was only tested with a small amount of information and there is the possibility that, in the case of larger networks, bottle necks could occur, leading to errors of operation.
Besides, only the property of fast mixing was applied, which may affect the method's efficiency.
Gatekeeper and SumUp [11,12] are decentralized Sybil investigation methods based on Sybil Limit. This process uses graph properties such as the mixing time as part of the investigation. Furthermore, the Ticket Distribution Admission Control Process was added to allow each node to consider whether other nodes are reliable or not. This process distributes tickets to all nodes in the network (tickets have a specified value and are assigned to the initial node) using the breadth-first search (BFS) method. In BFS, nodes at the same level do not send tickets to each other but send them only to lower-level nodes. Afterward, any node in the network will be defined as honest or Sybil by comparing the ticket value of each node with a threshold value. However, this method has a problem with the ticket distribution. In the case of a single source, it has only the root node available for distribution and the ticket will encounter problems when there are many nodes present. Here, the attacker could design strategies to attack only the ticket source. Moreover, if the degree of the considered node is low, it will lead to a decision process error.
Researches [13-15] studied the characteristics of social graphs and found that the nodes of a social graph can be used to find communities. The limitation of these publications is that information from the whole network is required, for example the numbers of nodes, edges, Sybil nodes and honest nodes, for use in the analytical process, which may lead to practical problems in extended social networks.
Cao, et al. proposed Sybil Rank [3], while Integro [16] and Sybil Radar [17] improved this method by applying machine learning. The researchers assumed that social networks have only a small number of victim nodes. However, in reality there are many. As for the system's performance, its accuracy decreased when the number of attack edges increased. These methods also have other limitations. For example, it is possible that the trust value of the honest nodes is equal to that of the Sybil nodes when propagating the trust value from the initial node to a stationary distribution.
SybilExposer [19] divides the social network into an honest community and a Sybil community by analyzing the degree of each node. The researcher assumed that the degrees inside and outside of the Sybil community are lower than the degrees inside and outside the honest community. However, if the number of nodes in a community is not large and they are not analyzed node by node, the method is prone to errors.
SybilWalk [20] calculates the score of each node by applying the random walk property to identify Sybil nodes. A label is added to the passing-through node. However, it is not clear how the process of labeling Sybil nodes is initiated.
SybilSCAR [21] creates local rules for detecting Sybil nodes by applying the random walk technique and loopy belief propagation. A training data set is used to create rules for all nodes and distribute the node label values in the network. However, this method has a performance problem. If the number of attack edges in the network increases, a noticeable delay occurs. SybilBlind [22] adopts the SybilSCAR method by randomly selecting the training data set instead of manually selecting it. The authors also applied a homophily-entropy aggregator to calculate the possibility of Sybil nodes. However, this method has a problem with randomizing the nodes of the training data set, which is not actually representative of the node population in the network.
SmartWalk [18] identifies Sybil nodes by calculating the mixing time with a supervised-learning technique. With this method it is not feasible to calculate the mixing time value of every node in a network. This method uses a subset of nodes as the training data set, after which the mixing time value is calculated. However the authors did not explain how the nodes for the training data set were selected. Moreover, using only the mixing time may cause a performance problem.
There are some studies that have investigated mixing time measurement on social networks. Mohaisen, et al. [4] measured the mixing time of several social networks using SLEM but without considering the difference between directed and undirected node relations. Ref. [25] did use the direction of node relations, following previous works, to measure the mixing time. However, this work did not sufficiently explain the difference in mixing time between honest and Sybil graphs. Dellamico & Roudier [26] studied the way to measure mixing time in four big social networks, i.e. Advogato, DBLP, Epinions and OpenPGP, but did not explain the techniques used in their measurements.
Since the mixing time has yet not been applied to real social networks, it is uncertain if measuring it can really indicate Sybil nodes. Therefore, this research made an attempt to prove whether a not the mixing time is an effective indicator of Sybil attacks on a real social network.
3 Experimental Setup
3.1 Consideration of Mixing Time in Sybil Attacks on Social Networks
Several Sybil defense mechanisms exploit the mixing time property. The mixing time of an online social network is a way to measure the time needed in a random walk through the social network from the starting point to a stationary distribution. When the mixing time of a social network tends to be fast, it is called fast mixing [8]. However this property has been used widely without careful measurement of the mixing time. SybilGuard [8], Sybil Limit [9] and SybilInfer [10] are Sybil detection approaches that have adopted the mixing time property. This section will discuss the measurement of mixing time in detail.
A social network can be expressed in the form of a graph. We define \(deg(v_i)\) as the degree of node \(v_i \in V\) and transition probability matrix \(P = [p_{ij}]\) with size \(n \times n\), where \(p_{ij}\) is the probability of the transition from node i to node j.
\[p_{ij} = \begin{cases} \frac{1}{\deg(v_i)} & \text{when } v_i \text{ is connected to } v_j \\ 0 & \text{when } v_i \text{ is not connected to } v_j \end{cases}\]
In the stochastic process of a Markov chain, the amount of time to reach a stationary distribution of P is equal to \(\pi = \pi P\). The mixing time of a Markov chain it is equal to T, which is the shortest time or process from random walk to stationary distribution under distance variation (\(\epsilon\)), as shown in Eq. (1).
\[T(\epsilon) = \max\min\{t: |\pi - \pi^{(i)}P^t|_1 < \epsilon\}\] (1)
where \(\pi\) is stationary distribution, \(\pi^{(i)}\) is the distribution at starting node \(v_i\), \(P^t\)is the transition probability matrix after walking time t, and \(|\pi - \pi^{(i)}P^t|_1\) is the total distance variation. The speed of the mixing time in a Markov chain is called fast mixing and can be calculated with Equation \(T(\epsilon) = O(\log n)\).
The mixing time value can be determined by two theories, which are stationary distribution \((\pi)\) and second largest eigenvalue modulus (SLEM). \(\pi\) can be expressed in terms of a vector as in Eq. (2).
\[\pi = \left[ \frac{\deg(v_1)}{2m} \frac{\deg(v_i)}{2m} \dots \frac{\deg(v_n)}{2m} \right] \tag{2}\]
In the case of SLEM, the eigenvalue of the transition probability matrix is calculated, where P is equal to \(\lambda_i\) when \(1 \le i \le n\) is a real number, which is ordered as \(1 = \lambda_1 > \lambda_2 \ge \cdots \ge \lambda_{n-1} \ge \lambda_n > -1\). Therefore, the second largest eigenvalue (\(\mu\)) is equal to \(\mu = max(|\lambda_2|, |\lambda_{n-1}|)\). The mixing time \(T(\epsilon)\) calculated using this equation is similar to the one calculated by Eq. (3).
\[\frac{\mu}{2(1-\mu)}\log\frac{1}{2\epsilon} \le T(\epsilon) \le \frac{\log(n) + \log\left(\frac{1}{\epsilon}\right)}{1-\mu} \tag{3}\]
In this work, we computed SLEM by following Eq. (3) for finding the mixing time of a social graph. Calculation of this equation is feasible for large social graphs [26]. Calculation of Eqs. (1) and (2), on the other hand, is not feasible for social graphs with millions of nodes.
Even though several Sybil defense mechanisms that were applied in experiments on social networks use this property, they were not aimed at measuring the mixing time and did not clearly explain the adoption of this property. Hence, this research aimed to find the mixing time of social graphs using Eq. (3) in order to test the assumption of using the mixing time to detect Sybil attacks in social networks.
This part of the research dealt with measuring the mixing time of a social network using Eq. (3), comparing an honest graph and a Sybil graph using data sets from [7], as shown in Table 1. The datasets consist of information from Twitter and contain fake accounts as well as normal accounts. The data were used to investigate the mixing time of social networks. The 5 datasets are divided into 2 sets of normal users (TFP, E13) and 3 sets of fake users (INT, FSF, TWT).
Nodes Dataset Edges Graph Type E13 (elections 2013) 34,352 48,156 honest Graph 1 241,374 honest Graph 2 TFP (the fake project) 143.138 INT (intertwitter) 42,058 517,486 Sybil Graph 1 FSF (fastfollowerz) Sybil Graph 2 12,541 253,027 TWT (twittertechnology) 63,820 729,840 Sybil Graph 3
Table 1 Datasets used in the experiment.
In this research, Python was used for calculating the mixing time and investigating the properties of the graphs. Processing was done in three steps. Firstly, data pre-processing was done, which is the conversion of the information from the social network to a social graph using the analysis tool Gephi. This was carried out in order to create edges connecting the nodes in the datasets. The transition probability matrix of the social graph was then generated using Python. The second step was the data processing step, which is the calculation of the mixing time. This was done by using the second largest
eigenvalue modulus (SLEM) on the transition matrix of the social network datasets according to Eq. (3). When computing the SLEM, we used the lower bound of Eq. (3) to bind the mixing time of the social graphs. It is possible to measure values of large social networks [4]. With Eq. (3), we assigned the distance variation (,), which equaled 0.05 to 0.50, to show the possibilities of the calculated value. (In fact, the distance variation can also be larger than 0.50 but there would not be an obvious difference in mixing time between the social graphs). The variable of the initial point and the stationary distribution of the random walk in the social graph were set. Finally, in the third step we compared the mixing time of the social graphs, as shown in Table 1.
We created a function to calculate the SLEM and to investigate the mixing time by creating networks of normal users and creating networks of Sybil nodes by simulating a random correlation between normal users and fake users. This correlation was used to create the connecting edges between the nodes. The numbers of attack edges was set at 1,000 to 10,000 to distinguish sparse and dense attack edges. After that, the network datasets were imported using this function. The mixing time was then calculated for each dataset.
3.2 Consideration of Node Distance for Detecting Sybil Attacks in Social Networks
In order to find the distance between nodes in a network, crawling techniques are carried out. These techniques can be divided into two types: the random walk technique and the graph traversal technique. The random walk technique is used to find the mixing time, where each node can be selected repeatedly. The graph traversal technique is used to find the node distance, where each node can be selected only once [27].
Node distance is the number of edges that connect the starting node and the terminal node. Generally, breadth-first search is used to find the distance between nodes. Nevertheless, a limitation of this technique appears when it is applied to two nodes in a social graph. That is, the distance between two nodes with different subgraphs is often smaller than the distance between two nodes with the same subgraph. To solve this problem, depth-first search (DFS) can be used [28]. Because the number of connecting lines or edges between subgraphs is often low and BFS is unable to give comparable distances, DFS does not give the shortest path. The path obtained from DFS is far longer than the one obtained from BFS; the time used to find the distance is equal to 7 + . In this research, we considered node distance for investigating the difference between honest graphs and Sybil graphs.
We assumed that the structural characteristics of a social network may influence the distance between nodes, revealing the difference between honest graphs and Sybil graphs by comparing the values of the distance between the starting node and the terminal node. An experiment was conducted to test this assumption. Firstly, we determined the starting node in the region of an honest graph and the terminal node in the region of an honest graph by using the datasets of honest Graph 1 and honest Graph 2. Secondly, the starting node was set in the region of an honest graph and the terminal node was set in the region of a Sybil graph using the dataset of honest Graph 1 to create a random correlation with the dataset of Sybil Graph 1.
The operating steps were as follows. First, social graphs from the datasets were created using Gephi. This analysis tool was used to create edges connecting the nodes in the datasets. Secondly, a possible pathway between the starting node and the terminal node was found. In this experiment, we used Python as the tool for this process and used the datasets by randomly selecting data from Table 1, as shown in Table 2. Finding the node pathway in the social networks was done by using depth-first search.
The experiment was divided into two parts. First, the starting node and the terminal node were randomized to act as normal accounts in an honest graph. Then, the starting node was randomized to act as a normal account and the terminal node was randomized to act as an account in a Sybil graph. Thereafter, finding the possible pathway was carried out using the developed program. The distances between the nodes of the mentioned pathway were collected for 100 rounds to find the trend of distances. After getting the outcome, the result was analyzed.
3.3 Investigating the Correlation of Properties of Nodes in Social Networks
The previous part of this research focused on properties that can distinguish the difference between an honest graph and a Sybil graph based on finding pathways. However, these properties can only be applied when the structure of the social network is known. Therefore, this section focuses on finding additional properties of social networks by considering specific properties of the nodes in order to find the difference between honest nodes and Sybil nodes. This experiment was specifically designed to investigate the properties of nodes in social networks that can be used to identify Sybil nodes.
First a social graph was created using Gephi, after which it was analyzed. The datasets in Table 1 were used to find the following node properties: degree, clustering coefficient, page rank, eigenvector centrality, betweenness centrality, eccentricity, closeness centrality and modularity class. The Python tool NetworkX was used to obtain the values of these properties. Afterward, a comparison between the obtained properties, using linear regression analysis between honest and Sybil nodes in the social graphs.
In this research, we used the degree and the eigenvector centrality to find the correlation between the nodes. The value of eigenvector centrality was first proposed in 1987 [29,30]. It is based on the degree of a node. A node has a high eigenvector centrality when it is connected with a high-degree node. This value indicates the influence of the node in the social graph. This has the benefit of identifying node centrality in a graph [31]. Eigenvector centrality is different from the degree of centrality, which only considers the number of adjacent nodes. Eigenvector centrality also considers the centrality of the adjacent nodes, each connected node having different importance. Highly influential nodes in the network are considered more important than other nodes [11]. The eigenvector centrality value is also used, as shown in Eqs. (4) and (5).
\[Ax = \lambda x \tag{4}\]
\[\lambda x_i = \sum_{j=1}^n a_{ij} x_j \tag{5}\]
\[i = 1, \dots, n\] where A is the adjacency matrix of the graph, \(a_{ij}\) is 1 when i and j are connected with each other, otherwise it is equal to 0, and \(\lambda\) is the largest eigenvalue of A, and n is the number of nodes in the graph. For examining the characteristics of the Sybil graph we used eigenvector centrality to find correlations with other graph properties. These correlations were then used to analyze and create the equation for detecting Sybil nodes.
4 Results and Discussion
4.1 Results of Considering Mixing Time for Investigating Sybil Attacks in Social Networks
Table 2 shows the SLEM values of the 5 datasets calculated by determining the attack edges between Sybil and honest nodes from 1,000 to 10,000 edges, respectively. The results show that when the number of attack edges was 1,000 the SLEM value of all datasets had the highest value. In contrast, when the number of attack edges was 10,000, the SLEM value of all datasets had the lowest value. It can therefore be concluded that the SLEM value decreased when the number of attack edges increased.
Figure 2 shows the trend of the lower bound of the mixing time calculated by Eq. (3); the number of attack edges between Sybil and honest nodes was set from 1,000 to 10,000 edges, respectively. The result showed that when the number of attack edges was 1,000, the mixing time of the networks of all datasets was the highest. When the number of attack edges was 10,000, the mixing times of all datasets was the lowest. This means that the mixing time of each dataset decreased when the number of attack edges increased, which corresponds with a decrement in SLEM value.
| SLEM | |||||
|---|---|---|---|---|---|
| honest 1 | honest 2 | Sybil 1 | Sybil 2 | Sybil 3 | |
| 0.968327 | 0.987773 | 0.968178 | 0.988346 | 0.987539 | |
| 0.968135 | 0.975584 | 0.964932 | 0.977225 | 0.976301 | |
| 0.957366 | 0.964559 | 0.961403 | 0.966390 | 0.965791 | |
| 0.953293 | 0.956646 | 0.955136 | 0.958499 | 0.957316 | |
| 0.946594 | 0.949208 | 0.943882 | 0.950784 | 0.949334 | |
| 0.947649 | 0.947222 | 0.935095 | 0.944085 | 0.945101 | |
| 0.938962 | 0.943225 | 0.931938 | 0.942543 | 0.939153 | |
| 0.927852 | 0.938252 | 0.918350 | 0.934692 | 0.937845 | |
| 0.928453 | 0.933872 | 0.916261 | 0.930352 | 0.927025 | |
| 0.926849 | 0.926985 | 0.913402 | 0.924909 | 0.930901 | |
Table 2 SLEM value of networks used in this experiment.
When considering the mixing time of each network in this experiment, the following was found. Firstly, when the number of attack edges was equal to 1,000, the mixing times of honest Graph 1 and Sybil Graph 1 tended to be the lowest. Secondly, when the number of attack edges was over 3,000, the mixing time was not different between the honest graph and the Sybil graph. Figure 3 shows that when the number of attack edges increased, the mixing time of all datasets decreased and there was no difference between the honest graph and the Sybil graph.
The results of this research showed that the number of attack edges affected the mixing time of the social networks of the 5 datasets. When the number of attack edges increased, the mixing time decreased. When considering Eq. (3), the results show that the SLEM value (X) was calculated from the eigenvalue obtained from the adjacency matrix of the network. This means that when the social network tended towards a denser graph, it affected the calculation of the eigenvalue, which in turn influenced the mixing time.
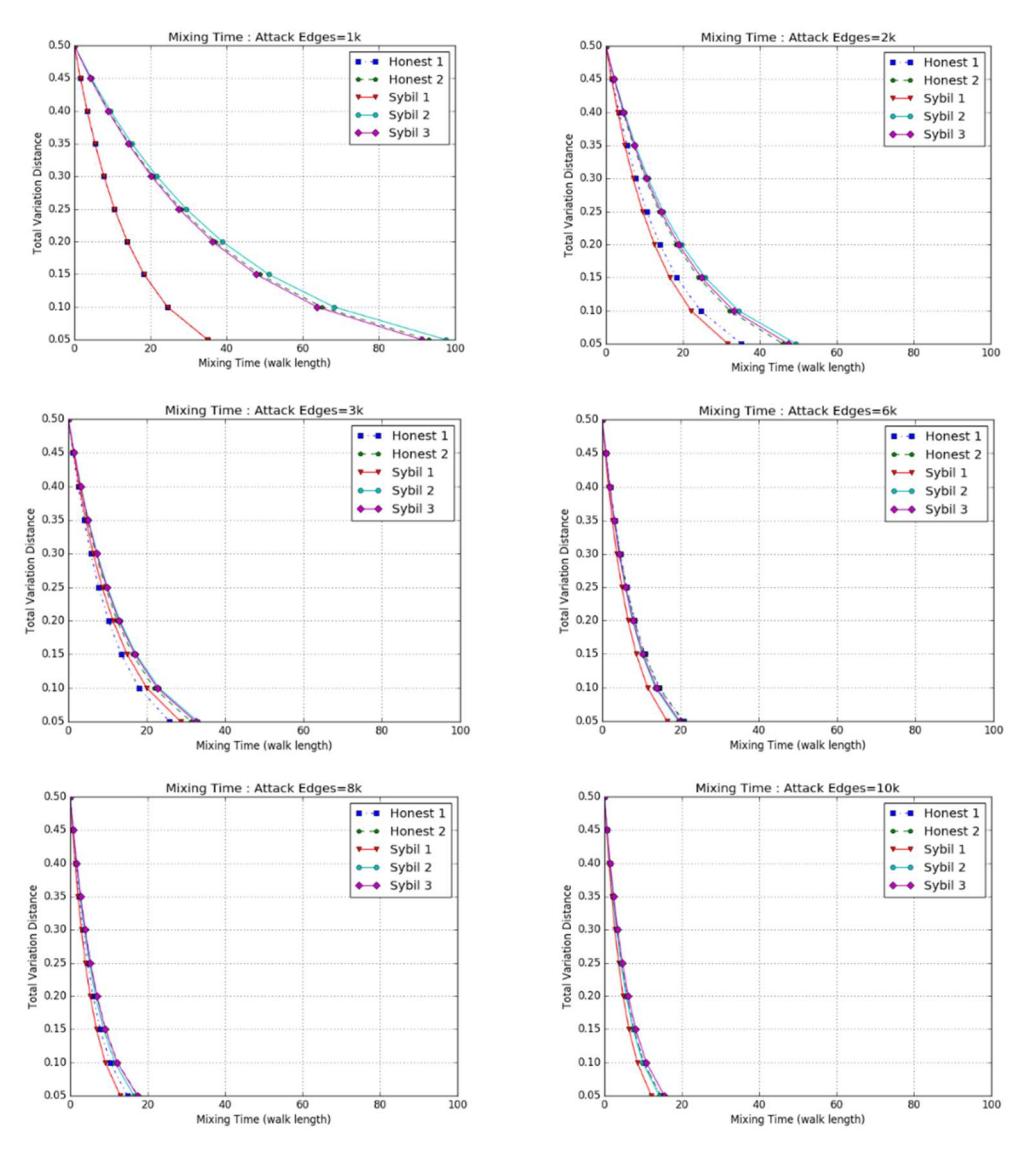
Figure 2 Trend of mixing time, when total variation = 0.05-0.50.
When considering the structure of the social networks, it was found that when using a random walk from the initial node to a stationary distribution, the chance to go to a stationary distribution in a network containing dense edges was higher compared to a network containing sparse edges. Thus, it can be concluded that the mixing time depends on the structural characteristics and the density of the edges in the network. The difference between an honest graph and a Sybil graph, when considering mixing time, can be observed when the density of the edges between an honest and a Sybil region is high. Meanwhile, a low density of edges does not show any difference. Therefore, the mixing time does not significantly reveal the difference between honest and Sybil graphs. This confirms one of our conjectures that the mixing time alone cannot distinguish honest and Sybil graphs.
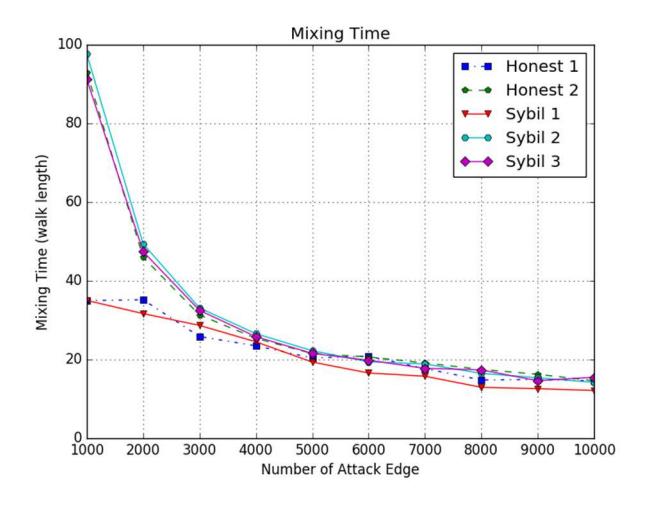
Figure 3 Trend of mixing time, when attack edges increased.
4.2 Results of Node Distance Consideration in Sybil Attacks on Social Networks
Figure 4 shows the distances from the starting node to the terminal nodes of the datasets with the number of attack edges from 1,000 to 10,000 edges, respectively. The experiment was run 100 rounds, after which the average node distances were calculated. The results show the difference in node distance distribution between the datasets when both the initial and the terminal node were honest (in the honest graphs) and when the initial node was an honest node and the terminal node was a Sybil node (in the Sybil graphs).
The dataset of the honest graphs showed that their average node distance was lower than that of the Sybil graphs. Table 3 shows the average distances for the datasets in this experiment. The results show that the average distance between the nodes of honest Graph 2 was the lowest, i.e. equal to 2 hops. Meanwhile, Sybil Graph 1 had the highest value. Moreover, the average node distances of all honest graphs were lower than those of the Sybil graphs.
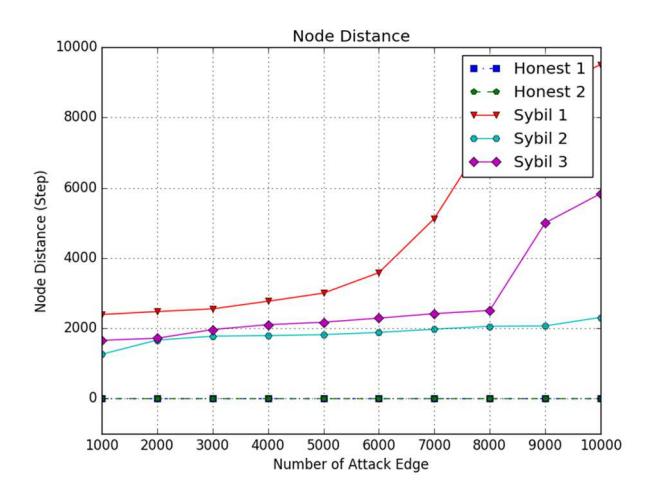
Figure 4 Trend of node distance as the number of attack edges increases.
| Attack Edges | Node Distance | ||||
|---|---|---|---|---|---|
| honest 1 | honest 2 | Sybil 1 | Sybil 2 | Sybil 3 | |
| 1000 | 4 | 2 | 2394 | 1260 | 1658 |
| 2000 | 4 | 2 | 2476 | 1665 | 1718 |
| 3000 | 4 | 2 | 2554 | 1776 | 1964 |
| 4000 | 4 | 2 | 2770 | 1793 | 2104 |
| 5000 | 4 | 2 | 3001 | 1819 | 2173 |
| 6000 | 4 | 2 | 3583 | 1884 | 2290 |
| 7000 | 4 | 2 | 5122 | 1974 | 2417 |
| 8000 | 4 | 2 | 7606 | 2059 | 2508 |
| 9000 | 4 | 2 | 8763 | 2068 | 5000 |
| 10000 | 4 | 2 | 9506 | 2311 | 5834 |
Table 3 Node distance of each dataset.
Although a clear difference in mixing time could not be observed, it could be seen that when the structural characteristics of the network changed, it led to a difference in the mixing times of the random walk. Therefore, an experiment was done to find out the differences between honest and Sybil graphs with different topologies. This experiment used the depth-first search principle to investigate the pathway from the starting node to the terminal node. The results showed that when the terminal node was in the area of a Sybil graph, the distance of the targeted pathway was longer than in an honest graph. This was because Sybil graphs have a lower clustering coefficient when compared to honest graphs. Hence, in the first case, finding the pathway to the target requires more hops.
Furthermore, Table 4 showed the average clustering coefficients of the online social networks used in this experiment. It can be seen that all three Sybil graphs had a lower average clustering coefficient compared to the honest graphs. This means that most of the nodes in the Sybil graphs had less direct connections when compared to the honest graphs. Therefore, according to this experiment, we found that the difference in topology of honest and Sybil graphs affects the node distance distribution when using the depth-first search method. This method shows a difference between honest and Sybil graphs, which implies that using this method could help distinguish Sybil nodes from honest nodes.
| Dataset | Average Clustering Coefficient | ||
|---|---|---|---|
| honest Graph 1 | 0.048428 | ||
| honest Graph 2 | 0.017501 | ||
| Sybil Graph 3 | 0.000075 | ||
| Sybil Graph 4 | 0.000175 | ||
| Sybil Graph 5 | 0.000413 | ||
Table 4 Average clustering coefficient.
4.3 Results of Correlation between Properties of Nodes in Networks
After investigating the correlation between the properties of nodes using the linear regression method, it was found that the two datasets of honest networks did not exhibit any transfer function. Meanwhile, the three datasets of the Sybil networks revealed node properties with a correlation, i.e. eigenvector centrality and node degree. Table 5 shows the Pearson correlation and correlation efficiency of these two values. Scatter plots of the datasets were created to show the correlation between these values, as shown in Figure 5.
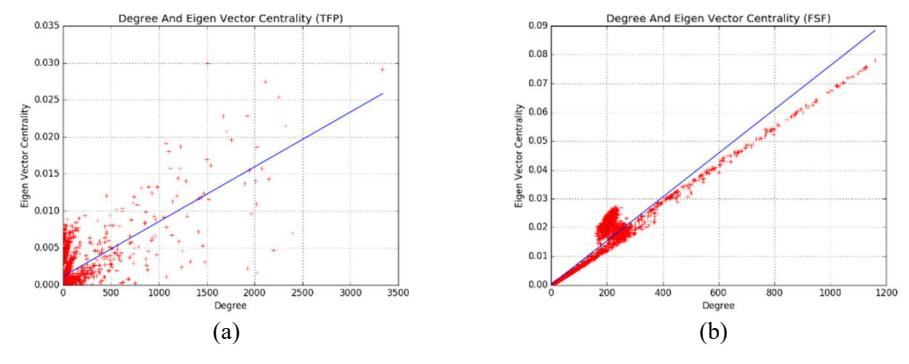
Figure 5 Scatter plot of the correlation between degree and eigenvector centrality of honest graphs (a) and Sybil graphs (b).
| Dataset | Pearson Correlation | \(\mathbb{R}^2\) |
|---|---|---|
| honest Graph 1 | 0.202026378 | 0.0408 |
| honest Graph 2 | 0.079120808 | 0.0063 |
| Sybil Graph 1 | 0.996158892 | 0.9999966063437 |
| Sybil Graph 2 | 0.996230596 | 0.999999896501 |
| Sybil Graph 3 | 0.991001511 | 0.999997301207 |
Table 5 Pearson correlation between degree and eigenvector centrality.
When considering the Pearson correlation between the degree and eigenvector centrality of the three Sybil graphs, it can be seen that the Pearson correlation and correlation coefficients were close to 1, meaning that node degree and eigenvector centrality in the mentioned datasets had a positive correlation. Meanwhile, the Pearson correlation of two honest graphs was close to 0, meaning that the properties of the two datasets had no positive correlation.
4.4 Efficiency Measurement
According to the results in Section 4.3, we created an equation to predict the Sybil trend of nodes from the variables of the three Sybil datasets by applying a transfer function with linear regression, as shown in Eq. (6):
\[y = \beta x\] \[\beta = \frac{y}{x} \tag{6}\] when the desired parameter (value tended to be Sybil) eigenvector centrality degree
From Eq. (6), we created a novel equation by replacing the y value with the equation of eigenvector centrality and x with the equation to find the value of node degree, as shown in Eq. (7).
\[S_{i} = \frac{1/\lambda \sum_{j=1}^{n} a_{ij} x_{j}}{\sum_{j=1}^{n} a_{ij}}\] (7)
\(S_i\) tends to be Sybil, when \(Min_{thr} \leq S_i \leq Max_{thr}\)
When
\(S_i\)the value of Sybil node i \(Min_{thr} =\)regulation for the lowest consideration \(Max_{thr} =\)regulation for the highest consideration largest eigenvalue of the network
\(a_{ij}\) = equal to 1 when node i and node j are adjacent nodes
\(x_j\) = eigenvector centrality of node jn = total number of nodes in the network
This was tested in an experiment using the information from the honest and Sybil graphs of the social networks, containing 456,312 nodes in total, as shown in Table 1. The appropriateness of the values of \(Min_{thr}\) and \(Max_{thr}\) was tested by considering false negatives, MAE, and RMSE. The results are shown in Table 6.
The results show that when using Eq. (7) to calculate the Sybil node trend, the most suitable value of \(Min_{thr}\) was 0.00074 and the most suitable value of \(Max_{thr}\) was 0.0013. Once these two values were considered as Sybil nodes, the accuracy was also measured. The false negative value was 0.756% with MAE = 0.211, and RMSE = 0.459. If the mean absolute value (MAE) is small, it means that the method can be used to identify Sybil nodes. In this case, the value was 0.211. If the value of root mean square error (RMSE) is equal to zero, it means that there was no deviation in the experiment. In this case, the RMSE was equal to 0.459. However, these values were obtained by information used only in this research.
Table 6 MAE, RMSE, FN of Social Network in this Experiment when \(Min_{thr} = 0.00071 - 0.00079\) and \(Max_{thr} = 0.0013\).
| \(Min_{thr}\) | \(Max_{thr}\) | MAE | RMSE | False Negative (%) |
|---|---|---|---|---|
| 0.00071 | 0.0013 | 0.2137 | 0.462277 | 0.756483 |
| 0.00072 | 0.0013 | 0.213595 | 0.462163 | 0.756483 |
| 0.00073 | 0.0013 | 0.213166 | 0.461699 | 0.756483 |
| 0.00074 | 0.0013 | 0.211057 | 0.45941 | 0.756483 |
| 0.00075 | 0.0013 | 0.218692 | 0.467646 | 12.33332 |
| 0.00076 | 0.0013 | 0.226154 | 0.475557 | 22.98884 |
| 0.00077 | 0.0013 | 0.226523 | 0.475944 | 24.06028 |
| 0.00078 | 0.0013 | 0.216258 | 0.465035 | 25.05813 |
| 0.00079 | 0.0013 | 0.208287 | 0.456385 | 25.26418 |
5 Conclusion
In this work, first a process to analyze the properties of online social networks in terms of fast mixing was proposed, which is mandatory for detecting Sybil attacks on social networks. Existing Sybil defense mechanisms assume that honest networks are fast mixing while Sybil networks are not. One of our main findings was that the mixing time alone cannot be used in a Sybil defense scheme. An experiment was carried out to test this property and it was found that the structural characteristics of a network affect the mixing time of its graph in such a way that is not always possible to see the difference between an honest graph and a Sybil graph.
The second aim of this research was to find properties that can be used to identify Sybil nodes in social networks using a topology-based scheme. It was found that the average node distance in a graph that contains only honest nodes is lower than that in a graph containing Sybil nodes. Thus, this property can reveal the difference between honest and Sybil graphs. It was also found that the correlation between two other properties, i.e. eigenvector centrality and degree of node, is different in a Sybil graph than in an honest graph. From this correlation, an equation was produced in order to detect Sybil nodes. The results showed that the equation was able to distinguish between Sybil and honest nodes and hence these two properties can act as factors to protect against Sybil attacks.