
1 Introduction
This paper reports on a long-term research project conducted at Nakhonphanom University (NPU) in Thailand that aims to track changes in how students and staff use technology for learning and teaching. The study also explores students' ownership of technology and how this affects access, student preferences and self-perception of skill levels when using technology. This paper compares the results of this research from the years 2015 and 2017.
2 Background
In 2015, technology provision at NPU included a learning management system (LMS). Most staff received some training, although this was voluntary rather than compulsory. The LMS had been promoted as early as 2010, but there was staff resistance to using the technology. Between 2010 and 2014 staff were encouraged to place at least one unit of study online in the LMS. Funding and support were provided during the initial stages of implementation. When outside funding ceased, support was provided by NPU. The loss of all LMS subjects after this time meant that the staff had to start over again to provide their subjects online to students. As a result some staff began using social media such as Facebook and Line to communicate with students outside the classroom. By 2015 most staff had experience using some form of technology to provide online learning for students. After data for this research were collected in that year, the university began to move to using Google Classroom as the preferred model for online learning and staff are currently receiving training.
The research study of online learning at NPU used an online survey of students from across the university in 2015 and in 2017. The survey sought information from students about students' ICT ownership, use and preferences for electronically delivered learning resources at NPU over a two-year data collection period to track any changes. It was anticipated that the answers to these questions would be useful to administrators, course coordinators, and lecturers in tailoring resources to student preferences and thus deliver greater student learning engagement and satisfaction. This ongoing research also aims to track any trends in technology use by staff and students and students' ownership of devices over a period of time.
The adoption and impact of the use of technology on teaching practice and learning achievement have driven the interest of policy makers, educators, and researchers worldwide. There are many universities around the globe that are attempting to leverage and realize the benefits of a range of technologies in education. Since 2000 research studies have examined the online learning environment and how it affects the teaching-learning paradigm in this space [1- 22].
In Australia, several universities offer online learning resources via LMS, such as Blackboard and Moodle. Content and teaching delivery is becoming more sophisticated and common as enrolment patterns change and students who have
jobs require more flexibility in order to continue studying [1]. In Asian countries such as Thailand, universities are in the developing phase of online delivery and use more blended learning approaches [1-3,10] In some cases lecturers use the Web to enhance and provide access to existing content and materials, while other educational providers chose to package learning materials wholly online (via an LMS) and develop new learning approaches to leverage the opportunities provided by technology. Still other individual lecturers use social media as a communication tool to communicate with and motivate students [11,20,21,23].
Nevertheless, other research has indicated that learners do not recognize online learning to be necessarily beneficial due to the lack of peer-to-peer interactivity between students and instructors. Although most online units provide student access to chat and discussion forum facilities to encourage ongoing interaction, difficulty in finding time to participate and the lack of immediacy are barriers [1,20,24-26]. Discussion forums can be effective tools to promote student interaction by providing shared information or exploring problem-based scenarios [27,28], especially since they provide a permanent record of the discussion, which students can review at a later date. Discussion forums allow students to revise, review and reflect using the permanent record to refine their understandings. The forums also provide instructors with opportunities to model best practices in online communication and to extend student learning via the posting of questions to make students think. However, if students and instructors do not use and actively participate in the discussion forums regularly, the benefits of this type of communication channel will remain underutilized and under-valued. In addition, even though staff utilize a range of communication technologies, such as discussion forums or bulletin boards, email, chat, blogs and wikis, to encourage student discussion and information sharing, peer-to-peer communication and interaction are still issues in the online environment [1,29]. Research in the United States has revealed that one in four teenagers mostly go online using their mobile phones [30], 78% of teens now have a mobile phone, and almost half (47%) of them own smartphones. The results of this research indicate that young people use handheld devices for both study support and non-study activities.
The situation in some Asian countries is similar. Research conducted in Thailand has indicated that the use of technology in education has helped to improve the capacity of societies to cope with change [29]. Similarly, the uptake of technologies at the Thai higher education level means that technology has become an essential tool for student learning both inside and outside the classroom [31]. Therefore, a variety of technologies are being used for instruction, including digital cameras, laptops and interactive whiteboards. The advanced use of software programs has also produced better quality resources and use in the classroom has resulted in positive learning outcomes [32]. Taking the above into account, this research has identified the importance of investigating how students utilize and respond to online materials that are delivered to them throughout their courses. Also of interest are the technologies owned by the students and the modes and places of Internet access.
3 Research Methodology
3.1 Participants
Participants in this research study were students enrolled across all fields of study at NPU. The total number of students who participated in 2015 was 595 (58% female and 42% male), while in 2017 there were 380 participants (76% female and 24% male). Using accidental sampling, the number of students was mostly even across the fields of study. Approximately 80% of participants were between the ages of 19-22 years.
3.2 Research Instruments
In the initial 2015 investigation, the survey used was developed by Pagram and Cooper (2008-2017) and adapted/translated to Thai [31,33,34]. It used Qualtrics software, which is an online research survey tool that can be used for a whole range of data gathering purposes applicable to HDR research. The 2017 survey also used Qualtrics and both surveys contained identical questions. In the light of the technology focus of the study, the administration of the student survey was conducted online via the Internet. Using an online survey method was also deemed to be the most effective way to gather data from a large enough group of students. Students were informed of the survey via a link placed on NPU websites and after the student login so that they had access to the survey. A number of gift phone cards to top up accounts were offered as an incentive to do the survey, with recipients being randomly selected.
There were 15 questions in each survey that were grouped according to the following categories: demographics; digital lifestyle (skills, ownership and access); file formats; and learning management system (Moodle). The questionnaire and the interview instruments were designed to clarify the participants' attitudes. The surveys used a 5-level Likert scale.
Survey questions were close-ended and included both Thai and English language versions, with respondent data fed into a common database for analysis. The survey and data entry used dropdown menus and radio buttons to ensure an uncluttered layout and encourage accurate data entry. Finally, a progress bar indicated how far participants were through the survey to encourage them to continue through to the end.
4 Findings
The sample from both years of data collection contained very similar gender ratios for participants, with more females than males between the ages of 19-22 years old.
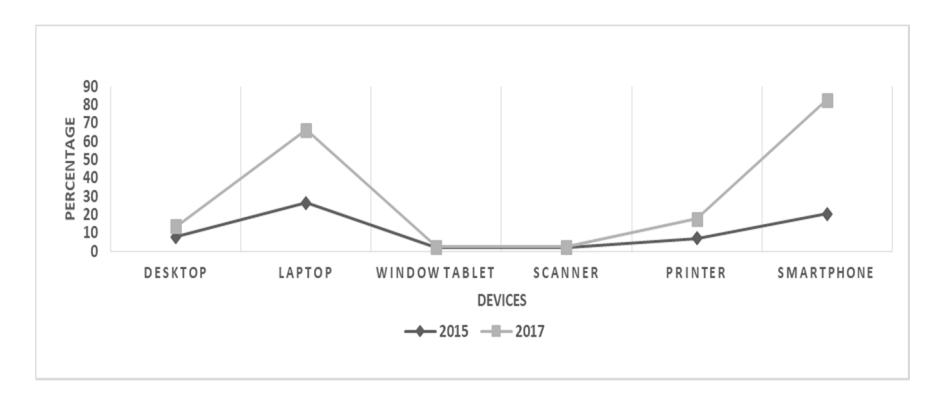
Figure 1 Students' ownership of technology devices.
As indicated by the dataset in Figure 1, the ownership of laptops and smartphones had increased significantly by 2017. Only ownership of printers showed a slight increase in 2017, while ownership of desktop computers, tablets, iPads, scanners and digital cameras barely changed. This trend may be due to lower costs associated with the purchase of smartphones and laptops or because students and their parents believe access to technology and the Internet for study purposes is important. The increase in smartphone ownership over laptops (equal in 2015) may also be due to mobility and the increased use of Google Classroom and the cloud to access staff and learning materials. The slight rise in ownership of printers may also be due to convenience (having one at home) as other research has indicated that printing is still an important activity due to issues with making meaning from text on screen [35,36]. The results indicate a significant move toward mobile technologies in terms of current ownership and purchasing patterns. Maybe in the future, the student population will be armed with laptops and 4G-5G enabled mobile devices and may possess or have access to a device that can be used as a learning tool as well as an entertainment tool.
The results shown in Figure 2 indicate that students in Thailand continue to keep their technology devices for three or more years, even though the lifespan for technology devices is continually being lowered [37,38]. In the 2017 data, students owned their devices longer than in 2015 for all devices, except scanners. The results indicate that Thai students probably do not have the resources to change technology devices frequently and only buy a new technology when the old one dies. It may also be because they feel the old technology is more stable, predictable, reliable, a condition known as 'comfortable to use'.
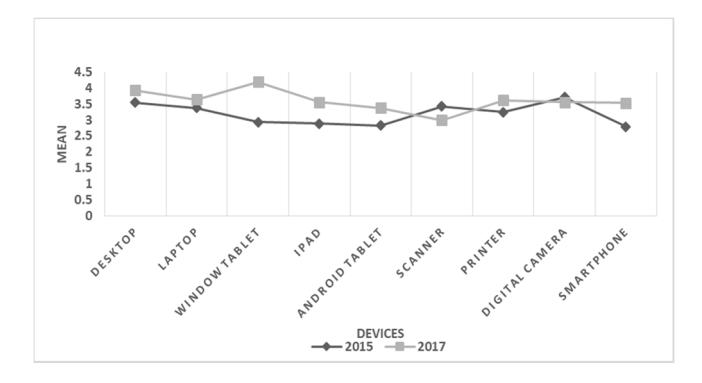
Figure 2 Mean of the years student owned their devices.
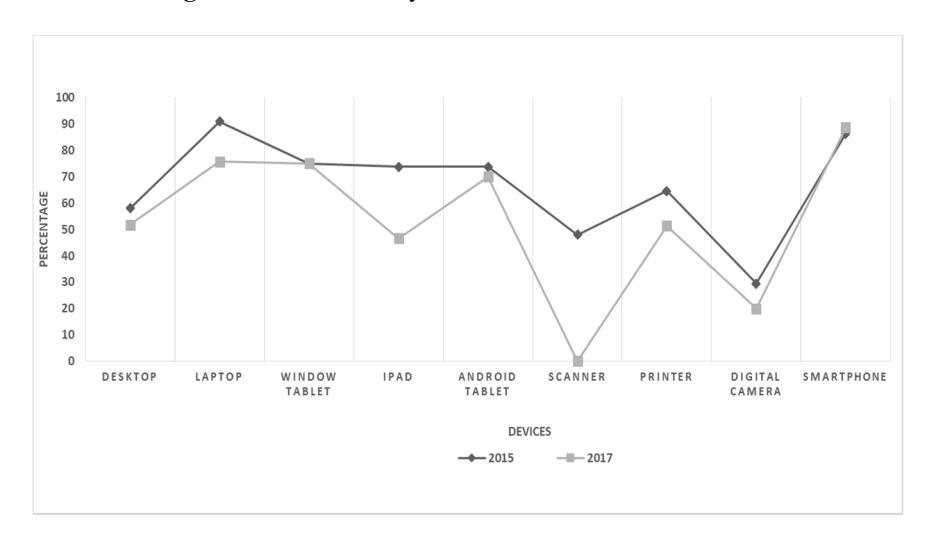
Figure 3 Percentage of students who own a device and use it for study purposes.
Figure 3 indicates that the use of all technologies for study purposes was less than in 2015, except for smartphones, which was slightly higher. In Figure 4 below, it can be seen that personal technology use by students was lower in 2017, except for Android tablets and printers. Mobile phone use was almost the same in 2015 and 2017. This is a surprising result. While student ownership of certain devices has risen since 2015 (Figure 1), students are keeping their devices longer (Figure 2) and they are using them less for both study and personal use. In this study, only the use of smartphones for both study and personal purposes remained the same. These results require further investigation or possibly a revision of the questions asked in the survey may be warranted.
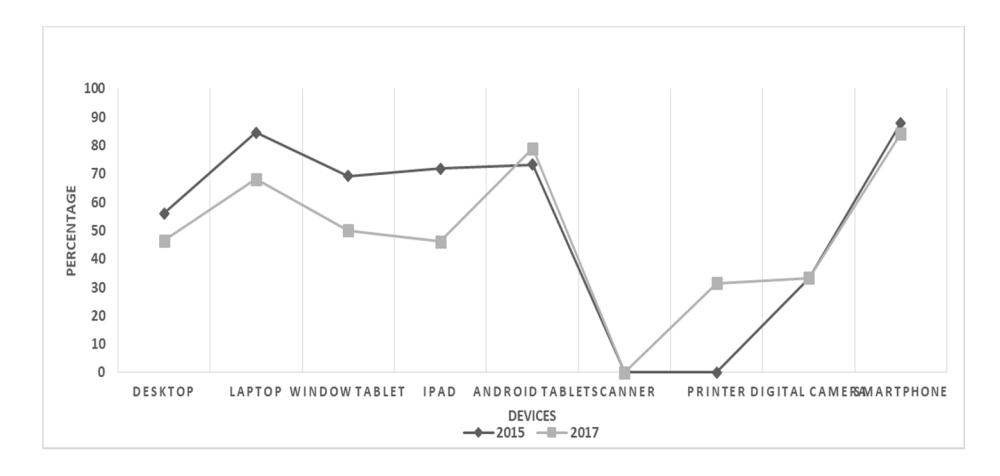
Figure 4 Percentage of students who own a device and use it for personal purposes.
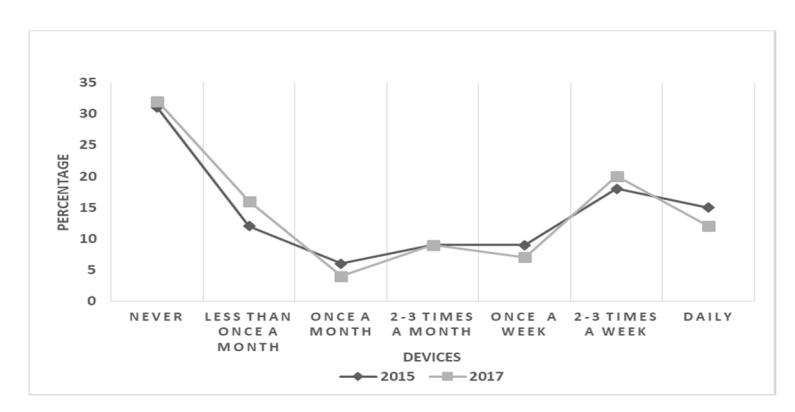
Figure 5 Percentage of students using a Smartboard.
The results in Figure 5 are very similar for 2015 and 2017, with students saying they have never used a Smartboard in the highest category. These findings suggest that electronic whiteboards are not currently being used in teaching and could be more fully utilized in the classroom.
Again, Figure 6 indicates that there is very little difference between the results from 2015 and 2017. Even though staff at NPU received training in using a range of technologies for teaching-learning between 2015-2017, use in the classroom appears to have remained the same. This question also requires revision to ascertain what technology teachers use and how they use it when teaching. The results in this dataset may also be due to the fact that the university has not provided more computer facilities in the classroom, and the limited provision of desktop computers has meant that most teachers use personal laptops for teaching practice. Students too are now encouraged to have their own technologies/devices. Since the mobile phone provides both access to the Internet and is a communication device, this may explain why this device is so popular amongst students.
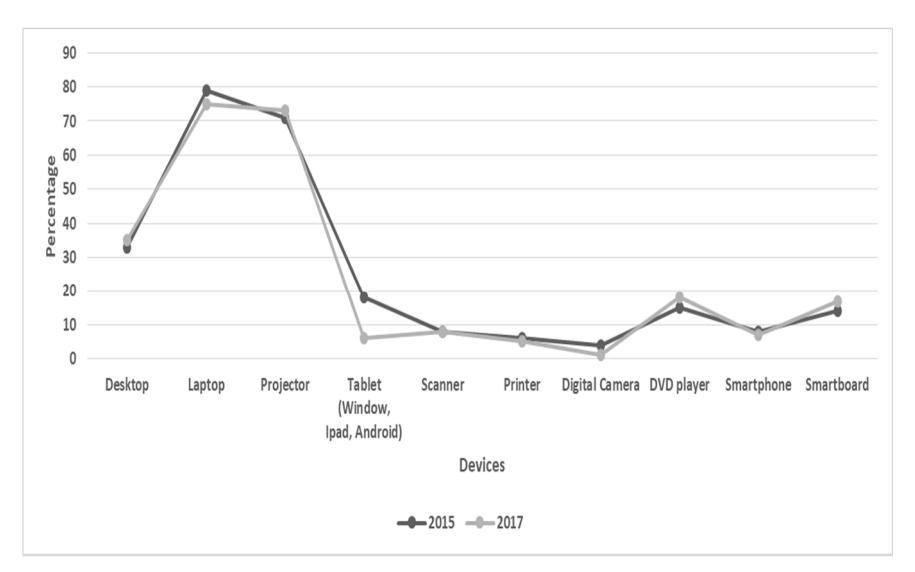
Figure 6 Percentage of use of devices by instructors in the classroom.
Table 1 Student use of cloud computing.
| Responses | 2015 | 2017 |
|---|---|---|
| Yes | 58% | 74% |
| No | 23% | 13% |
| Don't know | 19% | 13% |
Access by students to other platforms such as cloud computing (Google Drive, Dropbox, SkyDrive, One Drive or other cloud-based solutions) was also examined. The results indicate a significant shift in how students use this technology. A larger number (16% more) reported using cloud-computing facilities in 2017. Students' knowledge of these Web-based facilities also increased during the two-year period. This may also indicate higher skill levels with newer technologies, a trend that also needs to be investigated further.
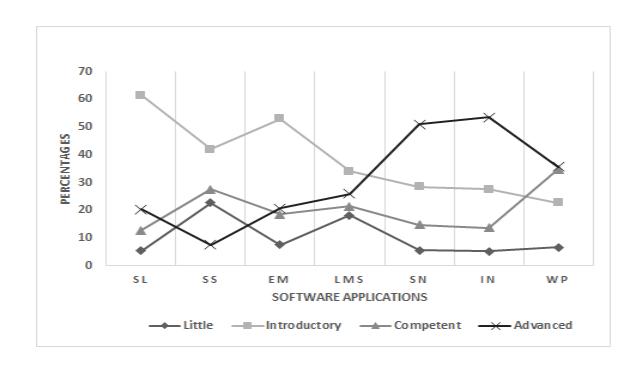
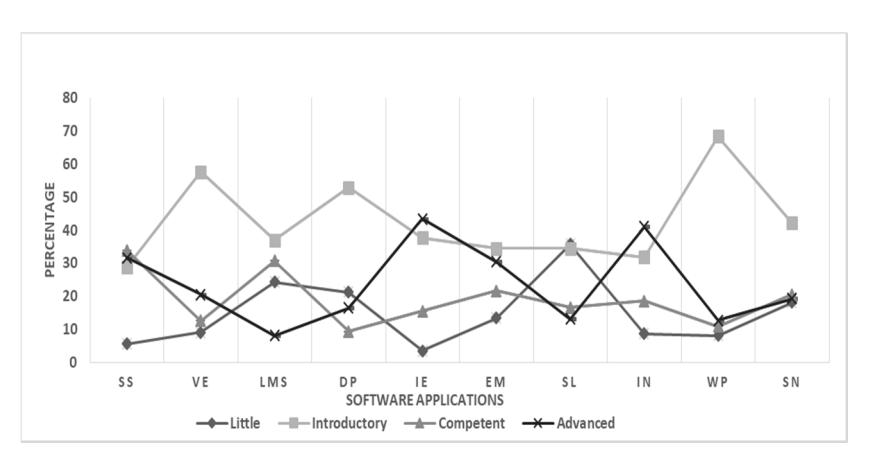
Legend: SL = slideshows, SS = spreadsheets, EM = e-mail, LMS = learning management system, SN = social networking, IN = Internet browsing, WP = word processing.
Figure 7 Self-perception of students' software program skills, 2015.
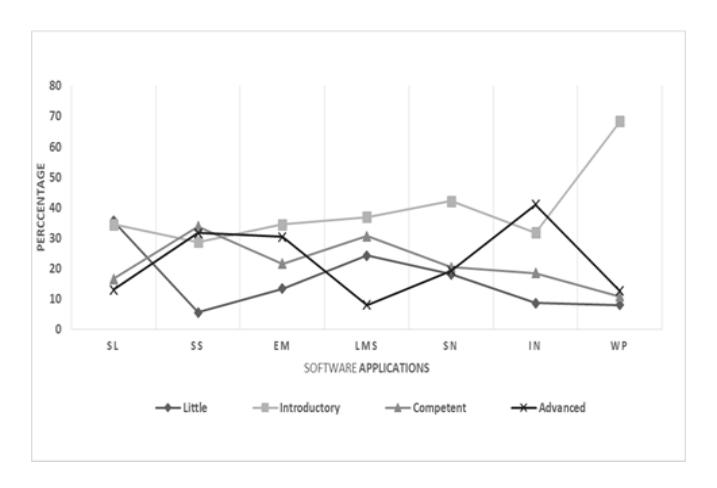
Legend: SL = slideshows, SS = spreadsheets, EM = e-mail, LMS = learning management system, SN = social networking, IN = Internet browsing, WP = word processing.
Figure 8 Self-perception: students' software program skills, 2017.
Figures 7 (2015) and 8 (2017) indicate how students feel about (self-perception) their own software skills. In 2015, nearly 70% of students felt they were beginners (few skills and introductory level) when using slideshows (SS), with just over 30% feeling their skills were competent or advanced. In 2017 these numbers had changed little, with a slight decrease in students reporting advanced and competent skill levels. This may be due to a shift in the use of slideshows as a means of presenting information or a misunderstanding by students who may be using tools other than PowerPoint (most commonly associated with slideshows), such as Prezi.
Students' skill levels using spreadsheets (SS) has improved from 2015, when 36% said they were competent or advanced users, to 66% in 2017. Similarly, in 2015, 40% of students said they were competent or advanced users of e-mail (EM), while in 2017 52% felt they were competent or advanced users. Both these results may be due to increased use of these tools while at university. Many universities and lecturers conduct all their formal communication with students via e-mail and spreadsheets are increasingly being used to present and manipulate data in the classroom.
The results for the LMS are possibly a reflection of NPU's difficulties in setting up a system that is robust and being used across the university (see Section 2). In 2015, 48% of students felt they were competent or advanced users, but by 2017 only 39% fell into this category. The results for social networking (SN) are also surprising, with 66% of students saying they were competent or advanced users in 2015, but only 39% felt this way in 2017. This change may be due to the exponential nature of technology development and students feeling unable to keep up with new developments, especially in the social networking sphere of the Web. It may also be due to the terminology used in the questionnaire and confusion between social networking and apps. The questionnaire may need to be altered to take into account the changing nature of the online landscape.
Results for competent and advanced users in the category Internet browsing (IN) were slightly lower in 2017 (60%) than 2015 (67%). This finding may also be the result of students' feeling overwhelmed by the amount of information available online and the growing complexity of the information landscape. Word processing skills were also lower for 2017, with 24% saying they were competent or advanced users against 71% in 2015 for the same category. This finding may be a result of a shift in how assignments are submitted, with an increase in Word processing documents. In many universities there has also been an increase in authentic assessment (real-world tasks and problems), which requires professional looking reports, proposals and programs that reflect realworld documents and solutions.
Figure 9 shows how often students used a range of software programs and applications for study purposes in 2017. In 2017, students were using Internet browsing, image editing, spreadsheets and e-mail for study purposes. To a lesser extent they were also using cloud computing and social networking. The graph also indicates that many students were not using software programs/tools such as word processing, the LMS and the cloud for study purposes. It will be interesting to see the results in another two years' time as student use and behavior shifts with changing technology uptake by the university.
Legend: SS = spreadsheets, VE = video editing, LMS = learning management system, DP = digital photography, IE = image editing, FM = file management, EM = e-mail, CC = cloud computing, EM = e-mail, SL = slideshows, IN = Internet browsing, WP = word processing, SN = social networking.
Figure 9 Software/applications: frequency of use for study purposes by students, 2017.
The results reported in Figure 10 indicate little change in the number of students using technology on a regular basis at the university. Slightly fewer students reported using word processing, PowerPoint, Internet browsing and social networking at least 2-3 times a week. These results may indicate the need for a finer grained series of questions as terminology changes and the university updates technology systems used for administration and teaching and learning.
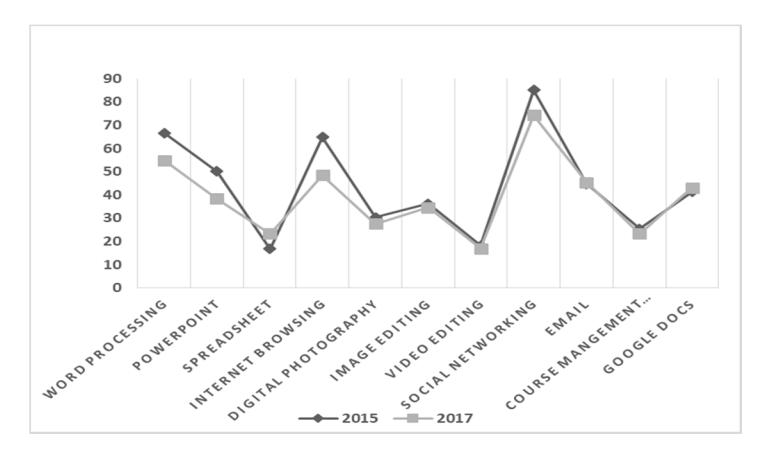
Figure 10 Percentage of students who use software and applications 2-3 times per week.
The results reported in Table 2 indicate that more students were using the Internet from home (61% in 2917 versus 52% in 2015). Slightly more students were also using the 3G network and the Internet café to access university
subjects or information. This finding may indicate a change in use, where students in 2017 were using their mobile devices more when outside the home to access the university. The slightly lower results for the university lab and university wifi also support the notion that students were more mobile in 2017 or studying at locations other than the university campus.
Table 2 Percentage of students indicating internet usage at least 2-3 times a week.
| Location | 2015 | 2017 |
|---|---|---|
| Home | 52 | 61 |
| 3G | 72 | 76 |
| University lab | 44 | 40 |
| University wifi | 68 | 61 |
| Internet café | 20 | 25 |
5 Conclusion
The results reported in this paper are part of an ongoing research examining the changing usage patterns and behaviors of Thai students at university. It was designed to add to the body of research about young people's use of technology, particularly how they use technology for learning and education. The findings of the 2017 study indicate that there have been some notable shifts in how students are using a range of technologies. However, the 2017 data still indicate that for the most part students in Nakhonphanom University are not embracing cutting-edge technologies to assist them with their learning. The 2017 results indicate a shift in the use of mobile devices, knowledge and use of the cloud and laptop ownership, with an increase in ownership, use and the number of places where students study or access their study materials.
The use of devices and technology in the classroom by lecturers has remained stagnant. This finding may be a major factor that influences how students perceive and use technology for learning and education. If their teachers do not use technology for instruction, then students will not immediately perceive how they can use it for learning. Issues at NPU with the LMS and system-wide technologies for administration and teaching-learning are barriers to the successful uptake of technology by lecturers. It will be interesting to see if this situation has changed and students' use will have altered in another two years, when the university will have moved to Moodle as the LMS across the university.
Students' preference for print formats such as .doc and .pdf that can be printed indicate that print is still a preferred mode for making meaning from text. These results align with other researches, which examined the difficulties experienced by all ages to make meaning from text on the screen [35,36,39,40]. These researches also indicate that students tend to save and store documents as opposed to editing or interacting with them, indicating that when new ways (technologies, file-formats) of distributing learning materials have been introduced, some form of student support/training is required to optimize student use and learning. These findings are also interesting in the context of training the next generation of teachers.
The current study indicates that there are barriers to students' uptake of new technologies in the context of learning and education. Some of these barriers are related to access, the provision of facilities and resources. While Thai students have opportunities to access a range of modern technologies and resources for study support, at NPU this low uptake and access is still a problem. Still, since data were first collected in 2015 there has been an improvement in the number of students engaging in this new way of learning. Overall the study has shown an ongoing need to examine student use of ICT at university and how this is related to the learning materials and resources provided by the university. Over time, these variables constantly change and it is incumbent upon a university of the 21st century to monitor students' technology ownership and use, and have an adaptive approach to both technology and pedagogy.