
1 Introduction
Biometric identification of sea turtles within a population is essential for behavioral and ecological study, allowing researchers to estimate vital statistics such as growth rate, survivorship, foraging patterns and population size. Traditional methods of permanent marking and artificial tagging induce stress and possibly harm to the animals. Furthermore, tag loss is common because of various factors, namely elapsed time after tagging, study area, target species, size of animal, piercing site and tag properties (e.g. material, color and design) [1-5]. Individual sea turtles can also be recognized via photographic identification of their natural marks, for example, based on coloration patterns around the head area [6], facial profiles [7] and facial scute patterns [8]. Still, the mark-recapture process puts a considerable amount of stress on the animal.
We propose a passive biometric identification system of sea turtles based on robust and co-variant image descriptor matching, see Figure 1. A distant camera remotely captures aerial images of sea turtles at their nesting site. These images are each learned as a robust and co-variant image descriptor, enabling indexing and retrieval. The set-up is non-invasive i.e. uses a remote camera and no flash photography. Using this set-up, images of sixteen juveniles were collected at a private breeding farm in Lundu, Sarawak. The images were taken at night (since females nest at night) inside a perimeter that imitated an actual nesting site. The image descriptor was learned from part of the sea turtle that is most visible from the air, i.e. its carapace. A Chelonia mydas carapace, see Figure 2, contains a distinctive scute pattern that can be used to identify individuals [9].
Figure 1 Our proposed framework. Matching is a minimizing function, ω�, �.
Figure 2 Left to right. An outline drawing of a Chelonia mydas carapace, sourced from [10] and an actual image of a juvenile Chelonia mydas kept in a private breeding farm in Lundu, Sarawak.
2 Related Work
Recent works on biometric identification of animals, not limited to sea turtles, were motivated by the use of computer vision pattern matching algorithms. An automated approach is a natural progression from manual inspection by human experts. Burghardt, et al. [11] used an extended version of Belongie, et al.'s Shape Contexts [12] to encode unique phase singularities of spot patterns on individual African penguins. In a more recent work [13] they proposed the detection of shape curls to represent individual Turing-patterned animals. Dababera and Rodrigo [14] implemented an eigenface-based identification mechanism to recognize individual African elephants using frontal-view face images. Loos and Pfiter [15] combined global and local facial features for visual identification of primates. Taha, et al. [16] learned SIFT [17] features from individual horse's muzzle images, later using RANSAC to remove outliers during matching. Also using muzzle images, Monteiro [18] combined graph matching and local invariant features to recognize individual cattle. Li, et al. [19] learned Zernike moments from tail-head images of Holstein dairy cows to recognize individuals. To the best of our knowledge, this is the first time a passive biometric identification system for recognizing individual sea turtles was developed.
2.1 Linear Deformation of Scute Pattern
Matching sea turtle individuals based on images captured by a stationary camera is non-trivial due to the linear deformation of salient image features. In such settings, deformation may consist of scale change and in-plane translation and rotation. Dorai, et al. [20] suggested several pre-emptive strategies to limit the impact of image deformation when collecting biometric data. Their approach requires multiple measurements to be taken concurrently, later sorted according to the severity of deformity.
Building on a different strategy, image feature descriptors such as [17,21,22] and [23] provide a better way to match scute patterns. The gradient-based feature descriptors are co-variant, or at least robust to various image transformations. When paired together with the bag-of-words framework, the set-up enables partial matching of models, i.e. using probability to find the closest match. Due to the low-light image capturing resulting in almost zero color information plus the minimal texture of sea turtle carapaces, we theorized that keypoint-based descriptors such as SIFT [17] would not fare well against our dataset. As for template-based descriptors, such as HOG [23], the higher dimensionality should provide a more robust description of the scute pattern. Nevertheless, template-based descriptors are not co-variant to rotation.
2.2 Matching of Scute Patterns
Between unique landings it is probable for an individual sea turtle's carapace to acquire new permanent markings, for example predation marks, scarring and barnacles. It may also acquire new ephemeral markings, for example, algae, sand particles and dirt. Our feature descriptor must be robust against such noise when matching scute patterns. Existing keypoint-based and template-based feature descriptors should solve this problem by providing a degree of robustness against noise during matching. However, the degree of robustness depends on the properties of the captured images.
3 Our Dataset
We collected between two and eleven RGB images (of \(3,264 \times 2,448\) resolution) each for sixteen Chelonia mydas juveniles, see Table 1. A total of 70 images were taken without flash (as turtles are very sensitive to light). The complete dataset (CC-BY-4.0), see Figure 3, is available on the corresponding author's website. The juvenile sea turtles were kept in captivity inside a private breeding farm in Lundu, Sarawak. During data capture, each individual was placed inside a perimeter and was allowed to move around freely for 3 to 5 minutes. This set-up aimed to replicate an environment similar to a sea turtle's nesting site. All sixteen individuals, as part of a larger group, were released back to the sea in December 2015 [24].
| No | Number of Images | No | Number of Images | ||||
|---|---|---|---|---|---|---|---|
| 1 | 3 | 9 | 4 | ||||
| 2 | 3 | 10 | 6 | ||||
| 3 | 6 | 11 | 3 | ||||
| 4 | 3 | 12 | 6 | ||||
| 5 | 7 | 13 | 3 | ||||
| 6 | 11 | 14 | 2 | ||||
| 7 | 4 | 15 | 3 | ||||
| 8 | 3 | 16 | 3 | ||||
Table 1 PANDAN-CHELOMY dataset.
The dataset was pre-processed prior to classification. Images were converted to gray scale and manually rotated to position the carapace in an upright pose, see Figure 4. The pose correction is required to enable the matching of template-based image descriptors. Inside each image, we manually set an ROI window to exclude most of the background. The remaining background elements inside the ROI were later removed via a smoothing function. The rotated images and ROI information are both included inside our PANDAN-CHELOMY dataset.
Figure 3 A From left to right, top to bottom. Sample raw images of each Chelonia mydas juvenile, Turtle 1 to Turtle 16, taken from our dataset PANDAN-CHELOMY.
Figure 4 Rotated images from PANDAN-CHELOMY, each with a visualized ROI.
4 Matching of Carapace Images
4.1 Classification
The PANDAN-CHELOMY dataset contains 70 images belonging to sixteen juveniles. Prior to matching, the ROIs were smoothed using a 4 4 × Gaussian
kernel to suppress the remaining background elements. We found this kernel size to be optimal for removing sand features. A larger kernel erodes more gradient, resulting in a higher loss of discriminative features inside the ROI. A smaller kernel retains more noise, which reduces the classification's accuracy.
Using k-fold cross-validation, a matching score for each ROI of the test set is obtained against the other ROIs of the training set based on the nearest-neighbor distance ratio (NNDR) scheme. The threshold values were varied from 0.0 to 1.0. We calculated the score, \(\beta\), as follows:
\[\beta = \omega_{top} \left( d_x, d_m \right) / \omega_{2nd} \left( d_x, d_n \right) \tag{1}\] where \(\omega_{top}\) is the distance between the template descriptor, \(d_x\), and the best-matching target descriptor, \(d_m\), and \(\omega_{2nd}\) is the distance between \(d_x\) and \(d_n\), i.e. the second best-matching target descriptor.
If both \(d_x\) and \(d_m\) belong to the same individual, the classification function, \(\xi\), returns two possible values:
\[\xi(d_{x},d_{m}) \begin{cases} True Positive & \beta \leq threshold \\ False Negative & Otherwise \end{cases}\] (2)
Otherwise,
\[\xi(d_{x},d_{m}) \begin{cases} False \ Positive \quad \beta \leq threshold \\ True \ Negative \quad Otherwise \end{cases}\] (3)
In the event the classification function returns multiple top matches, we count the result as a false negative. Based on the total number of true positives (TP), false positives (FP), true negatives (TN) and false negatives (FN) obtained from our classification exercise, the true positive rate, TPR = TP/(TP + FN), and the false positive rate, FPR = FP/(FP + TN), for each threshold value are estimated.
4.2 Image Descriptors
Scale-invariant Feature Transform (SIFT) [17], Speeded Up Robust Features (SURF) [21] and Oriented FAST and Rotated BRIEF (ORB) [22] were selected as keypoint-based descriptors. Histogram of Oriented Gradients (HOG) [23] was chosen as the sole template-based descriptor. All parameters were set to the default values as suggested in the original publications [17,21,22], except for HOG.
For HOG, we rescale each ROI to \(96 \times 128\) resolution, which translates to a descriptor length of \(\left(\frac{96}{8} - 1 \times \frac{128}{8} - 1\right) \times (2 \times 2) \times = 5,940\), with \(8 \times 8\) pixel cells, blocks of \(2 \times 2\) cells, and a 9-bin orientation histogram (0°-180°). Our ROIs were larger than the \(64 \times 128\) resolution used in [23] due to the typical dimension of a sea turtle carapace being almost equal in width and height.
Figure 5 Example of a SIFT matching result (acceptance threshold of 0.8) between Turtle 8a and Turtle 6d. The number of positive matches was 5. Image brightness was increased to improve visual clarity.
Figure 6 Visualized HOG descriptor for Turtle 8a (left) and Turtle 6d (right). The L2-norm value was 6.82. Image brightness was increased to improve visual clarity.
Additionally, for SIFT, SURF and ORB, the acceptance threshold was varied during keypoint matching from 0.2 to 0.8. The classification result for each acceptance threshold was plotted separately. See Figure 5 for an example of a SIFT matching result and Figure 6 for an example of visualized HOG descriptors for two paired carapace images.
5 Results and Discussion
Our classification of 70 sea turtle carapaces, using -fold cross-validation, produced the ROC curve plots shown in Figure 7. As predicted, all keypointbased descriptors, with acceptance threshold values ranging from 0.2 to 0.8, failed spectacularly with worse performance than random guessing. Only HOG performed better (than random guessing) with an average accuracy of 65%. Classification accuracy of this dataset via random guessing was 6.25%. Evidently, the nature of our ROI images, i.e. minimal color information and lack of texture, contributed to the failure of SIFT, SURF and ORB. Our implementation of HOG produced a descriptor length of 5,940, which is a far greater number than SIFT's 128, making it more discriminative and robust.
The optimal threshold value for HOG is 0.9. This reveals that with HOG, even though we managed to obtain an average classification accuracy of 65%, the distance between the top match and the second-best match is nominal. The confusion matrix using the optimal configuration is shown in Figure 8. There are 16 actual classes and 16+1 predicted classes. The additional predicted class, i.e. class MANY, represents cases where our classification function returned multiple top matches. Such cases were considered a false negative to penalize the configuration.
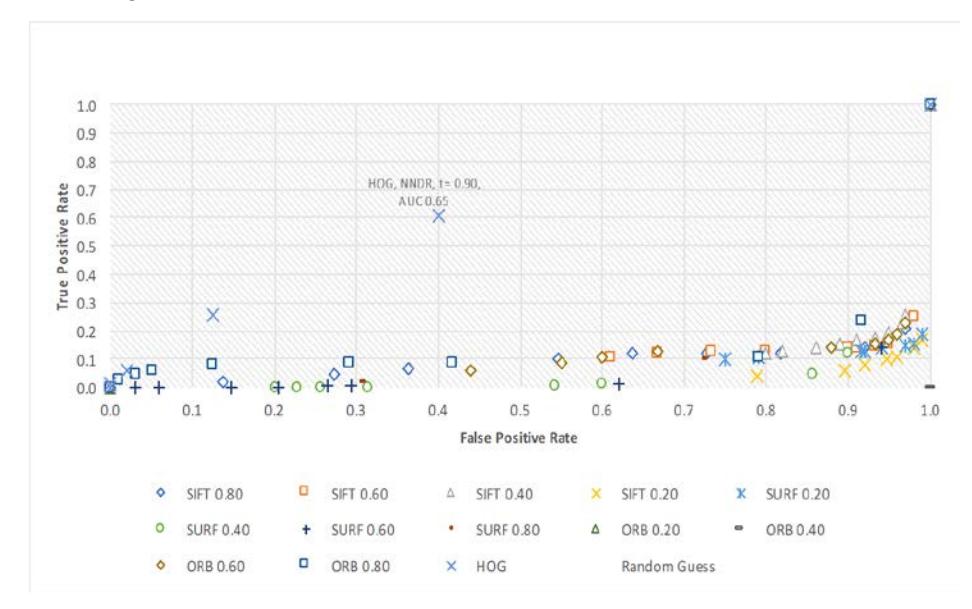
Figure 7 ROC curve plots obtained from all classification results.
| Predicted classes | ||||||||||||||||||
|---|---|---|---|---|---|---|---|---|---|---|---|---|---|---|---|---|---|---|
| Tunte; | Tunks. | Tunte 3 | Tuntes | Turde'S | Tuntes | Turbe,7 | Turde 8 | Tunk 8 | Turde 10 | Tunde 1.7 | Tunie 13 | Turne 13 | Tunie 14 | Tunte 15 | Tunte 16 | NAM | ||
| Actual classes | Turtle 1 | 1.00 | 0.00 | 0.00 | 0.00 | 0.00 | 0.00 | 0.00 | 0.00 | 0.00 | 0.00 | 0.00 | 0.00 | 0.00 | 0.00 | 0.00 | 0.00 | 0.00 |
| Turtle 2 | 0.00 | 1.00 | 0.00 | 0.00 | 0.00 | 0.00 | 0.00 | 0.00 | 0.00 | 0.00 | 0.00 | 0.00 | 0.00 | 0.00 | 0.00 | 0.00 | 0.00 | |
| Turtle 3 | 0.00 | 0.00 | 0.33 | 0.00 | 0.00 | 0.00 | 0.00 | 0.00 | 0.00 | 0.00 | 0.17 | 0.00 | 0.00 | 0.00 | 0.00 | 0.00 | 0.50 | |
| Turtle 4 | 0.00 | 0.00 | 0.00 | 0.67 | 0.00 | 0.00 | 0.00 | 0.00 | 0.00 | 0.00 | 0.00 | 0.00 | 0.33 | 0.00 | 0.00 | 0.00 | 0.00 | |
| Turtle 5 | 0.00 | 0.00 | 0.00 | 0.00 | 0.14 | 0.00 | 0.00 | 0.00 | 0.00 | 0.00 | 0.00 | 0.00 | 0.29 | 0.00 | 0.00 | 0.00 | 0.57 | |
| Turtle 6 | 0.00 | 0.00 | 0.00 | 0.00 | 0.09 | 0.09 | 0.00 | 0.00 | 0.00 | 0.00 | 0.00 | 0.00 | 0.00 | 0.00 | 0.09 | 0.00 | 0.73 | |
| Turtle 7 | 0.00 | 0.00 | 0.00 | 0.00 | 0.25 | 0.00 | 0.50 | 0.00 | 0.00 | 0.00 | 0.00 | 0.00 | 0.00 | 0.00 | 0.00 | 0.00 | 0.25 | |
| Turtle 8 | 0.00 | 0.00 | 0.00 | 0.00 | 0.00 | 0.00 | 0.00 | 1.00 | 0.00 | 0.00 | 0.00 | 0.00 | 0.00 | 0.00 | 0.00 | 0.00 | 0.00 | |
| Turtle 9 | 0.00 | 0.00 | 0.00 | 0.00 | 0.00 | 0.00 | 0.00 | 0.00 | 0.75 | 0.00 | 0.00 | 0.00 | 0.00 | 0.00 | 0.00 | 0.00 | 0.25 | |
| Turtle 10 | 0.00 | 0.00 | 0.00 | 0.00 | 0.00 | 0.00 | 0.00 | 0.00 | 0.00 | 0.50 | 0.00 | 0.00 | 0.00 | 0.00 | 0.00 | 0.00 | 0.50 | |
| Turtle 11 | 0.00 | 0.00 | 0.00 | 0.00 | 0.00 | 0.00 | 0.00 | 0.00 | 0.00 | 0.00 | 1.00 | 0.00 | 0.00 | 0.00 | 0.00 | 0.00 | 0.00 | |
| Turtle 12 | 0.00 | 0.00 | 0.00 | 0.00 | 0.00 | 0.00 | 0.00 | 0.00 | 0.00 | 0.00 | 0.00 | 0.50 | 0.00 | 0.00 | 0.00 | 0.00 | 0.50 | |
| Turtle 13 | 0.00 | 0.00 | 0.00 | 0.00 | 0.00 | 0.00 | 0.00 | 0.00 | 0.00 | 0.00 | 0.00 | 0.00 | 1.00 | 0.00 | 0.00 | 0.00 | 0.00 | |
| Turtle 14 | 0.00 | 0.00 | 0.50 | 0.00 | 0.00 | 0.00 | 0.00 | 0.00 | 0.00 | 0.00 | 0.00 | 0.00 | 0.00 | 0.00 | 0.00 | 0.00 | 0.50 | |
| Turtle 15 | 0.00 | 0.00 | 0.00 | 0.00 | 0.00 | 0.00 | 0.00 | 0.00 | 0.00 | 0.00 | 0.00 | 0.00 | 0.00 | 0.00 | 1.00 | 0.00 | 0.00 | |
| Turtle 16 | 0.00 | 0.00 | 0.00 | 0.00 | 0.00 | 0.00 | 0.00 | 0.00 | 0.00 | 0.00 | 0.00 | 0.00 | 0.00 | 0.00 | 0.00 | 1.00 | 0.00 | |
Figure 8 Confusion matrix obtained from the classification results using HOG [23], with threshold value for NNDR scheme set to 0.9.
6 Conclusion
Based on the results of this study, it can be concluded that the recognition of Chelonia mydas individuals using aerial images of their carapace is possible. By learning these ROI images as HOG descriptors, an average classification accuracy of 65% was obtained, for certain individuals 75% or higher. By dealing with cases where multiple top matches are returned from a single classification instance, it should be possible to further improve the average classification accuracy. Solutions such as cumulative voting scheme [25,26] and modular classification [27] will be explored in the future. Another potential solution is to use 3D features captured using an RGB-D sensor to represent the scutes, such as normal surface [28].
Constrained by our grant's limitation, we deliberately ignored the effect of scute deformation over time. The dataset contains images captured during a single landing. In future, we plan to collect images of multiple landings at an actual nesting site over a longer period of time.
Acknowledgement
This work was supported by Universiti Malaysia Sarawak through the following Small Grant Scheme (SGS) grant: F08(S160)/1171/2014(25).