
1 Introduction
An effective way of investigating emotional experiences is using online customer reviews because they are a great source of data that cover the global community. Several studies have been conducted for increasing our understanding of emotional experiences. For instance, Chaffar and Inkpen [1] used machine learning to recognize six emotions (disgust, anger, happiness, fear, surprise, and sadness). They investigated emotions in online blogs, traditional stories, and news. Nasukawa, et al. [2] utilized the NLP method for analyzing human opinion on webpages. Neviarouskaya, et al. [3] investigated emotions through text messaging. Hao, et al. [4] analyzed customer emotions from Twitter.
Emotion extraction using NLP is a promising approach, but displaying the results of NLP in an understandable and meaningful way is a challenge. Generally, NLP results are presented in the form of text, numbers, and graphics and an expert has to interpret their meaning. However, this study considers that the results of NLP should be reported quickly, in the form of simple graphics, tables, and numerical data to make them easier to understand and more useful. Therefore, we offer a linguistic description system to extract data from NLP and generate understandable and meaningful evaluation and advice reports on game products in natural language.
2 Granular Linguistic Model of a Phenomenon (GLMP)
Trivino and Sugeno [5] proposed the Granular Linguistic Model of a Phenomenon (GLMP) method. This method can be used to express phenomena from real life in natural language. The present study expected that it could also provide linguistic expression to generate evaluation and advice reports in natural language based on an analysis of customer emotions. This was attempted based on subjective interpretation of the data by the designer to develop the GLMP model. The model was created based on computational perceptions (CP) and perception mappings (PM).
2.1 Computational Perceptions (CP)
A computational perception is a unit of computational information/phenomena. The phenomena are analyzed at any level of granularity. CPs consist of a couple of vectors, A and W; CP = f (A, W), where:
A = (a1, a2, …, an) is an input vector of n linguistic expressions (words or sentences in a natural language). Each ai expresses the value of the CP in a specific context with degree of granularity x. The sentences can be simple, e.g., ai = "The number of customers is increasing" or more complex, e.g., ai = "Usually in a discount sale the customers are stimulated to buy the product."
W = (w1, w2, …, wn) is a vector of validity degree wi ϵ [0, 1] that is defined for each ai in the specific context. The validity degree depends on the designer's perception as incorporated in his/her application, e.g. it is used to describe the relevance of each sentence in the context of use.
2.2 Perception Mappings (PM)
Perception mappings are used to aggregate CPs. A PM is a tuple (U, y, g, T), where:
U is an input vector of CP, U = (u1, u2, . . ., um), where ui are tuples (Ai, Wi). The perception mapping (1PM) gets input in the form of numerical or graphical data obtained either from a sensor or a database.
y is the output CP, y = (Ay, Wy).
g is an aggregation function Wy = g (W1, W2, …, Wm), where Wi are the vectors of the degree of validity of the input CP. There are many different types of aggregation functions, e.g. fuzzy rules.
T is a text generation algorithm that produced the sentences in Ay. T is typically a natural linguistic template, e.g. "The game product sale is {high | medium | low}".
2.3 Existing and New Types of Computational Perception (CP)
Existing types of computational perception have been proposed by Eciolaza, et al. [5] and Conde-Clemente, et al. [6]. They distinguished the following CP models:
- 1. Emphatic CP. The subset of elements that have the maximum value of a specific feature, e.g. "The most expensive games are Sports 2, Soccer Game 3 and Grand Nascar".
- 2. Superlative CP. The superlative degree of an element related to a specific feature. This is different from all the other elements in the set, e.g. "The most expensive game is Sports 2 by a small difference compared to the average price of the rest of the games".
- 3. Comparative CP. The difference between two variables in the set related to a specific feature, e.g. "Sports 2 and Soccer Game 3 have a similar price".
- 4. Assertive-proportional CP. The designer's perception of the current state of the monitored phenomenon, e.g. "The game is expensive".
- 5. Derivative CP. The trend or pattern of the information, e.g. "The price has remained stable".
- 6. Integrative CP. The perception or a summary of the information about a specific phenomenon, e.g. "Most of the games are expensive".
The current paper proposes to extend the existing types of CP and presents three new types of computational perception:
- 1. Possibility CP. The subset of elements or phenomena about a present or future possibility of a specific feature. In this CP, the words (may, might, and could) can be used, e.g. "There are many customers with negative emotions so this game may not succeed in the market".
- 2. Suggestion CP. The subset of elements or phenomena that indicate that something is probable now or in the future regarding a specific feature. In
- this CP, the words (should, and ought to) can be used, e.g. "There are many customers with positive emotions so this game should attract more customers in the market".
- 3. Deduction CP. The subset of elements or phenomena that something is certain in the present or the future. In this CP, the words (must and can't) can be used, e.g. "There are many customers with positive emotions so this game must attract more customers in the market".
3 Research Method
3.1 Preprocessing Data
Customer reviews from Amazon.com were used as the object of study because they reflect emotional experiences covering a global community [7,8]. Customer reviews of Kinect Xbox 360 games were collected from the Amazon website (accessed on 04/29/2018) using the Parsehub tool [9]. The NLP method was used for analyzing the emotional experience. The dataset of emotion words from Saif Mohammad [10] and the dataset of sentiment words from Bing Liu [11] were used. The R language [12] was used for extracting the emotional experiences. Finally, data preprocessing is done for further analysis using GLMP to generate evaluation and advice reports in natural language.
3.2 General Architecture
This section presents the architecture for generating evaluation and advice reports using GLMP. The goal was to generate the results in the form of natural language expressions. The architecture is divided into three steps:
- 1. The first step was to collect the customer review data from Amazon.com using the Parsehub tool.
- 2. In the second step, the NLP method was used to analyze the customers' emotional experiences and the R language [12] was used for extracting the emotional experiences. Finally, preprocessing of the data to be used by GLMP (see Table 1) was done.
- 3. In the final step, GLMP generated an evaluation and advice report about the game product.
4 GLMP Evaluation
Each GLMP generates the following output: (1) evaluation of positive and negative user emotions, and (2) evaluation of positive and negative user sentiments. GLMP is designed with 9 PMs and 9 CPs at 3 hierarchical levels, as shown in Figure 1. The details of the GLMP model presented are as follows.
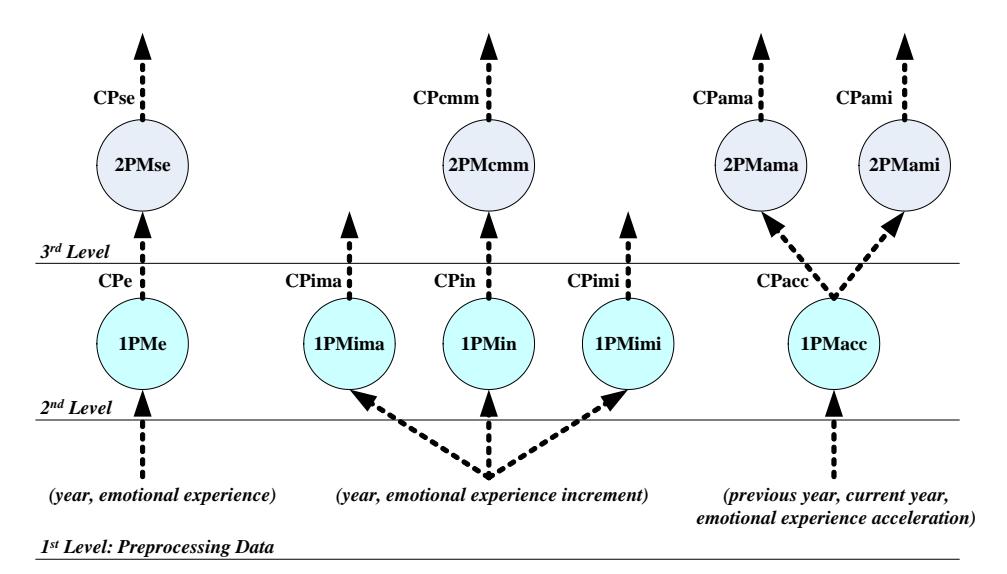
Figure 1 GLMP evaluation.
4.1 GLMP for Analyzing Level of Emotion
This GLMP was designed with 2 PMs and 2 CPs at 3 hierarchical levels. The input data are derived from the first level of GLMP, which covers year and emotional experience (see Figure 1 on the left side and Table 1). The detailed explanation is as follows:
1PMe examines the level of emotional experience as defined by the tuple (Ue, ye, ge, Te), where:
- 1. Ue is the input vector with two components as input: the year and the emotional experience percentage, e.g. Ue = (2011; 20.89%) means that the level of emotional experience was 20.89% in 2011.
- 2. ye is the output CPe = (Ae, We). It is an assertive-proportional CP, which describes the emotional experience level, expressed by a linguistic label Ae = (zero, almost zero, very low, low, medium low, medium, medium high, high, very high).
- 3. ge implements Wd as strong fuzzy partitions (see Figure 2). The fuzzy partition was developed based on the following membership functions: (zero (0; 10; 20), almost zero (10; 20; 30), very low (20; 30; 40), low (30; 40; 50), medium low (40; 50; 60), medium (50; 60; 70), considerably high (60; 70; 80), medium high (70; 80; 90), high (80; 90; 95), very high (90; 95; 100)).
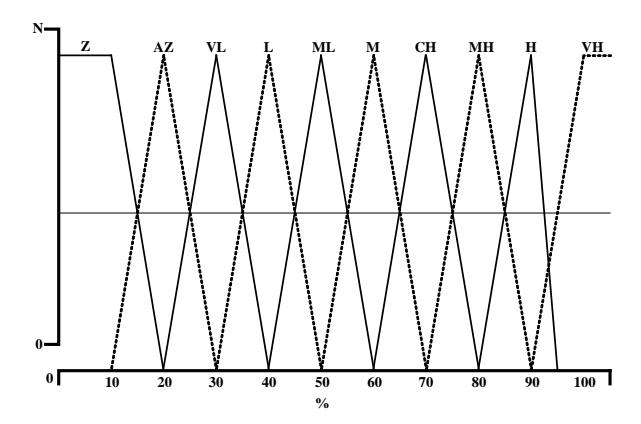
Figure 2 Fuzzy partition membership.
Te is the output of the linguistic template: "The emotional experience was" {zero | almost zero | very low | low | medium low | medium | considerably high | medium high | high | very high} "in" {year}.
2PMse summarizes the evolution of the level of emotional experience in a game, and is defined by the tuple (Use, yse, gse, Tse), where:
- 1. Use is the input vector with nine CPe (e.g., CPe2010, CPe2011, CPe2012, CPe2013, CPe2014, CPe2015, CPe2016, CPe2017, CPe2018).
- 2. yse is the output CPse. It is an integrative CP.
- 3. gse implements the maximum and minimum algorithm. First, the input element Use, a set of CPe in an array element, is sorted in ascending order by the algorithm. Second, the first element in the list of elements is identified as the highest emotional experience level, followed by the second, the third, and so on.
- 4. For (a = 0; a < CPe [Use]; a++); If (CPe[a] > maximum); Maximum = CPe[a].
- 5. Else if (CPe[a] < minimum); Minimum = CPe[a].
- 6. Tse is the linguistic template output: "The results show that the emotional experience level was" {the greatest Maximum} "in" {year}; {the second greatest was Maximum} "in" {year}; {the third greatest was Maximum} "in" {year}".
4.2 GLMP for Analyzing Increment Level of Emotion
This GLMP was designed with 4 PMs and 4 CPs at 3 hierarchical levels as shown in the middle of Figure 1. The input data are derived from the first level of GLMP, which covers year and emotional experience increment (see Figure 1 and Table 1). The detailed explanation is as follows:
1PMin examines the increment level of emotional experience by year and is defined by the tuple (Uin, yin, gin, Tin), where:
- 1. Uin is the input vector with two elements: the year and the increment in the emotional experience percentage, e.g. Ue = (2010; 2.22%), where 2.22% is the increment in the level of emotional experience in 2010.
- 2. yin is the output CPin = (Ain, Win). It is a derivative CP, which explains the increment in the emotional experience percentage. CPin is expressed with Ain = (almost zero, very low, low, medium, medium low, medium high, high, very high)
- 3. gin implements Win as a strong fuzzy partition (see Figure 3). It is determined by the following membership functions: (almost zero (0; 20; 30), very low (20; 30; 40), low (30; 40; 50), medium low (40; 50; 60), medium (50; 60; 70), medium high (60; 70; 80), high (70; 80; 90), very high (80; 90; 100)).
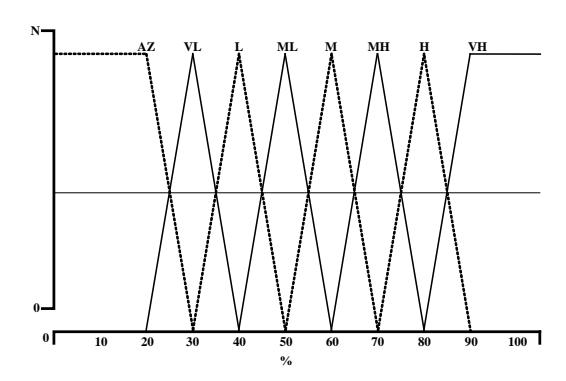
Figure 3 Fuzzy partition membership.
Tin is the output of the linguistic template: "The increment in the emotional experience was" {almost zero | very low | low | medium low | medium | medium high | high | very high} "in" {year}.
1PMima examines whether the increment of emotional experience in a year reaches the maximum value. It is defined by the tuple (Uima, yima, gima, Tima), where:
- 1. Uima is the input vector (year; emotional experience increment), e.g. Uima = ((2010; 0%), (2011; 20.32%)) where 0% and 20.32% are the increment values calculated for the years 2010 and 2011.
- 2. yima is the output CPima. It is an assertive-proportional CP, which expresses if the increment of the emotional experience is the maximum by a linguistic label.
- 3. gima implements aggregation for each pair (year, emotional experience) using the maximum and minimum algorithm. The input elements Uima, a set of array elements, is sorted based on their maximum and minimum value.
- For (a = 0; a < Uima[n]; a++); If (Uima[a] > maximum); Maximum = Uima[a].
- 4. Else, if (Uima[a] < minimum); Minimum = Uima[a]
- 5. Tima is the linguistic template output: "The increment in the emotional experience was" {Maximum} "in" {year}.
1PMimi examines whether the increment of emotional experience in a year has the minimum value. The rules are same as for 1PMima.
2PMcmm compares the maximum increment and minimum increment values of emotional experience. It is defined by the tuple (Ucmm, ycmm, gcmm, Tcmm), where:
- 1. Ucmm is an input vector with two values (CPin1, CPin2), referring to the maximum and the minimum value respectively.
- 2. ycmm is the output CPcmm = (Acmm, Wcmm). It is a comparative CP, where Acmm = (much lower than, lower than, equal to, greater than, much greater than).
- 3. gcmm implements Wcmm and executes a set of fuzzy rules that compare between two different CPs. The rules are stated in Appendix A.
- 4. Tcmm is the linguistic template output: "The supreme minimum is" {much lower than | lower than | equal to | greater than | much greater than} "the supreme maximum."
4.3 GLMP for Analyzing Acceleration of Level of Emotion
This GLMP was designed with 3 PM and 3 CP in 3 hierarchical levels, as shown on the right side of Figure 1. The input data is derived from the first level of GLMP about year and acceleration rate of emotional experience (see Figure 1 and Table 1). The detailed explanation is as follows:
1PMacc examines the acceleration rate of the emotional experience in two consecutive years. It is defined by the tuple (Uacc, yacc, gacc, Tacc), where:
- 1. Uacc is a vector with three elements: the previous year, the current year and the percentage of acceleration between these years, e.g., Uacc= (2010; 2011; 2.12%), 2.12% is the difference in the increment of emotional experience between the years 2010 and 2011.
- 2. yacc is the output CPacc = (Aacc, Wacc). It is an assertive-proportional CP, which describes the acceleration of the emotional experience with Aacc = (zero, almost zero, very low, low, medium low, medium, medium high, high, very high).
- 3. gacc implements Wacc as a strong fuzzy partition (see Figure 4). It is developed based on a set of triangle and trapezoid membership functions:
- (zero (0; 10; 20), almost zero (10; 20; 30), very low (20; 30; 40), low (30; 40; 50), medium low (40; 50; 60), medium (50; 60; 70), medium high (60; 70; 80), high (70; 80; 90), very high (80; 90; 100)).
- 4. Tacc is the output linguistic template: "The acceleration in the emotional experience between years" {previous year-current year} "was" {zero | almost zero | very low | low | medium low | medium | medium high | high | very high}."
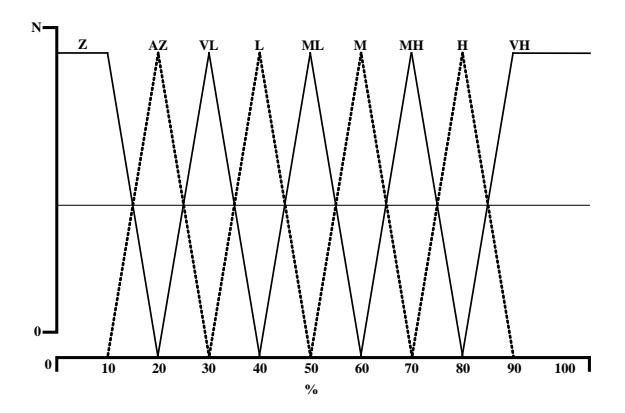
Figure 4 Fuzzy partition membership
2PMama examines the most significant acceleration of emotional experience level from two consecutive years. It is defined by the tuple (Uama, yama, gama, Tama):
- 1. Uama is an input vector with all CPacc, e.g. CPacc= (2010; 2011; 2.12%), where 2.12% is the difference in increment of emotional experience level between the years 2010 and 2011.
- 2. yama is the output CPama = (Aama, Wama). It is a superlative CP, which finds the most significant acceleration, where Aama = (small, medium, high).
- 3. gama implements Wama. First, the input element Wama = CPacc (a set of arrays) is ranked using the maximum and minimum algorithm. Two consecutive years with the maximum difference value in a set of arrays is the most significant acceleration. Then it applies a set of fuzzy rules to see the different values for two consecutive years CPacc1 and CPacc2: small = (0, 20, 30), medium = (20, 30, 50), high (30, 50, 100) (see Figure 5).
- 4. Tama is the linguistic template output: "The greatest acceleration took place between the years" {previous year} - {current year} "by" {small | medium | high} "difference".
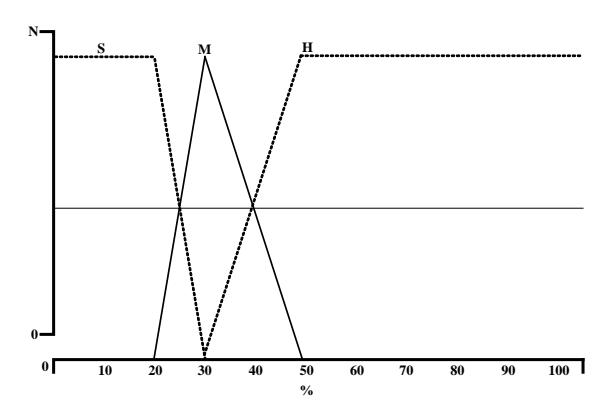
Figure 5 Fuzzy partition membership.
2PMami examines the lowest deceleration of emotional experience level in two consecutive years. Its definition is similar to that of 2PMama.
The GLMP evaluation rules for analyzing positive and negative sentiment are the same as for GLMP evaluation of emotional experience.
5 GLMP Report Template Generation
The GLMP emotional avatar represents the satisfaction and dissatisfaction of the analyzed customer emotional experiences. The input of this GLMP is emotional experience (see Table 1, column total). The GLMP model is shown in Figure 6.
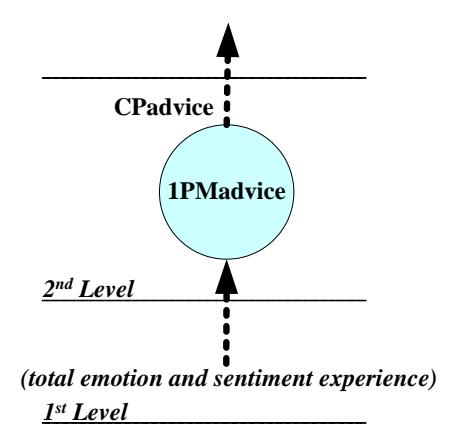
Figure 6 GLMP advice.
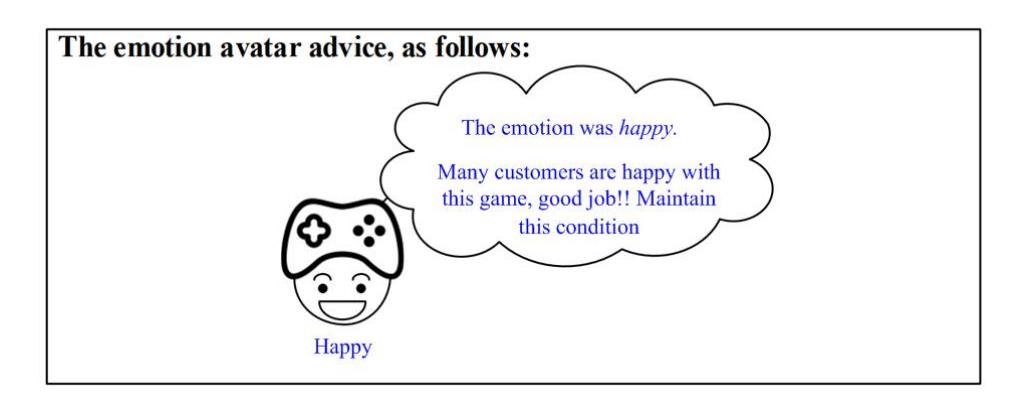
The output is an emotional avatar that can help users to understand the customers' emotional experiences related to the game product. The emotional avatar was designed based on Plutchik's model [13] (see Figure 7).
Figure 7 Emotional avatar.
PMadvice generates an advice report in the form of an emotional avatar. This PMadvice is a tuple (Uea, yea, gea, Tea), where each component is explained as follows:
- 1. Uea is the emotion word input in percentages from the total emotion and sentiment experience (see Table 1, column total).
- 2. yea is the output CPadvice = (Aea, Wea), where Aea = (happy, hopeful, worried, sad). It is a possibility CP, suggestion CP, and deduction CP.
- 3. gea is the output of function Wea, which calculates the validity degrees of the output of CPadvice. A set of fuzzy rules aggregates the output (see Appendix B for the details).
- 4. Tea is the linguistic template output: "The emotion was" {happy | hopeful | worried | sad} (see Appendix C for the details).
The report template generation module produces a report template. The report template is presented in Figure 8.
Figure 8 Report template.
6 Experimentation Results and Discussion
This section presents the results of an emotional experience analysis to test the applicability of GLMP for evaluation and advice report generation. The objective was to produce a linguistic description of customer emotional experiences related to five Xbox 360 games. The details of the five game reports are provided in Appendix D.
Table 1 Data Pre-processing
| Kinect Sports | ||||||||||
|---|---|---|---|---|---|---|---|---|---|---|
| Year | 2010 | 2011 | 2012 | 2013 | 2014 | 2015 | 2016 | 2017 | 2018 | Total |
| Positive Emotion | 0.67 | 0.7 | 0.67 | 0.76 | 0.77 | 0.76 | 0.73 | 0.71 | 0.63 | 6.40% |
| Increment | 0 | 0.03 | 0 | 0.09 | 0.01 | 0 | 0 | 0 | 0 | |
| Decrement | 0 | 0 | 0.03 | 0 | 0 | 0.01 | 0.03 | 0.02 | 0.08 | |
| Negative Emotion | 0.32 | 0.29 | 0.34 | 0.23 | 0.24 | 0.26 | 0.28 | 0.3 | 0.35 | 2.61% |
| Increment | 0 | 0 | 0.05 | 0 | 0.01 | 0.02 | 0.02 | 0.02 | 0.05 | |
| Decrement | 0 | 0.03 | 0 | 0.11 | 0 | 0 | 0 | 0 | 0 | |
| Positive Sentiment | 0.58 | 0.98 | 0.81 | 0.76 | 0.61 | 0.56 | 0.35 | 0.17 | 0.05 | 4.87% |
| Increment | 0 | 0.40 | 0 | 0 | 0 | 0 | 0 | 0 | 0 | |
| Decrement | 0 | 0 | 0.89 | 0.05 | 0.15 | 0.05 | 0.21 | 0.18 | 0.12 | |
| Negative Sentiment | 0.12 | 0.26 | 0.21 | 0.08 | 0.09 | 0.01 | 0.02 | 0.02 | 0.01 | 0.82% |
| Increment | 0 | 0.14 | 0 | 0 | 0.01 | 0 | 0.01 | 0 | 0 | |
| Decrement | 0 | 0 | 0.05 | 0.13 | 0 | 0.08 | 0 | 0 | 0.01 | |
In this summary, we have analyzed the emotional experience in Kinect Sports between years 2010 and 2018. We have generated the level of emotional experience, increment level of emotional experience, and acceleration of emotional experience as follows:
-------------------------------------------------------------
The level of emotion, as follows:
Positive emotion:
The result shows that the positive emotion level was the greatest 0.77% in 2014; the second greatest was 0.76% in 2013; the second greatest was 0.76% in 2015; the third greatest was 0.73% in 2016.
Negative emotion:
The result shows that the negative emotion level was the greatest 0.35% in 2018; the second greatest was 0.34% in 2012; the third greatest was 0.32% in 2010.
The increment level of emotion, as follows:
Positive emotion:
The increment in the emotional experience was a maximum in 2013.
The increment in the emotional experience was a minimum in 2014.
The supreme minimum is equal to the supreme maximum.
Negative emotion:
The increment in the emotional experience was a maximum in 2012.
The increment in the emotional experience was a maximum in 2018.
The increment in the emotional experience was a minimum in 2014.
The supreme minimum is equal to the supreme maximum.
The acceleration of emotion, as follows:
Positive emotion:
The greatest acceleration took place between years "{2012} - {2013}" by small difference value.
The lowest deceleration took place between years "{2013} - {2014}" by small difference value.
Negative emotion:
The greatest acceleration took place between years "{2011} - {2012}" by small difference value.
The greatest acceleration took place between years "{2017} - {2018}" by small difference value.
The lowest deceleration took place between years "{2013} - {2014}" by small difference value.
The level of sentiment, as follows:
Positive sentiment:
The result shows that the positive sentiment level was the greatest 0.98% in 2011; the second greatest was 0.81% in 2012; the third greatest was 0.76% in 2013.
Negative sentiment:
The result shows that the negative sentiment level was the greatest 0.26% in 2011; the second greatest was 0.21% in 2012; the third greatest was 0.12% in 2010.
The increment level of sentiment, as follows:
Positive sentiment:
The increment in the sentiment experience was a maximum in 2011.
The increment in the sentiment experience was a minimum in 2011.
The supreme minimum is equal to the supreme maximum.
Negative sentiment:
The increment in the sentiment experience was a maximum in 2011.
The increment in the sentiment experience was a minimum in 2014.
The increment in the sentiment experience was a minimum in 2016.
The supreme minimum is equal to the supreme maximum.
The acceleration of sentiment, as follows:
Positive sentiment:
The greatest acceleration took place between years "{2010} - {2011}" by high difference value.
The lowest deceleration took place between years "{2010} - {2011}" by small difference value.
Negative sentiment:
The greatest acceleration took place between years "{2010} - {2011}" by small difference value.
The lowest deceleration took place between years "{2013} - {2014}" by small difference value.
The lowest deceleration took place between years "{2015} - {2016}" by small difference value.
---------------------------------------
The result is an evaluation and advice report expressed in natural language as a summary of the emotional experience related to each game product. The report is presented in two ways: the emotional experience output (positive and negative emotions) and the sentiment experience output (positive and negative sentiments). The report provides the emotion/sentiment level, the increment of emotion/sentiment level, the acceleration of emotion/sentiment level, and the advice for a specific game product between 2010 and 2018. The details of the five game reports can be seen in Appendix D.
7 Conclusion and Future Work
This study developed a computational method for generating evaluation and advice reports expressed in natural language related to game products. The proposed method summarizes information on emotional experiences extracted from customer reviews. As its main contributions, this paper presented the practical implementation of expressing customer emotions in natural language related to game products using three new types of computational perceptions. It was shown that the proposed method could successfully generate reports in natural language in an understandable and meaningful way. Reports of customer emotions related to five game products from 2010 to 2018 were generated using the proposed method as a case study. The reports present emotion/sentiment level, increment of emotion/sentiment level, acceleration of emotion/sentiment level, and advice for the game product.
The proposed method has potential for other implementations. A future work may analyze specific emotional words indicating positive or negative emotions (e.g. joy, surprise, sadness, fear, anger, neutral, disgust, happy, trust, and anticipation) so that the nature of the emotional experience can be displayed in the report. Finally, further studies should consider a larger dataset and different
game platforms. The findings of this study are hoped to be useful for game companies, game designers, and researchers.
Acknowledgment
The first author wishes to thank the Indonesian Endowment Fund for Education (LPDP) and the Ministry of Research, Technology and Higher Education of the Republic of Indonesia for the scholarship he received during the execution of this study.