
1 Introduction
The smartphone is assumed to be the most used device in the present era [1,2]. The wide use of smartphone devices has resulted in the production of a huge number of digital images captured by cameras or screenshots [3,4]. These digital images provide a hybrid collection of graphical and textual information, which require separate methods that can handle these types of contents [5]. Chiatti, et al. [4] claim that the increment in data extraction from screenshots increases the interest of individuals in methods that could address and extract data from various texts, fonts, graphical contents, and layouts.
The dependence on social media has resulted in a trendy mode of communication in which messages are expressed by merging text and emojis [1,6]. Screenshots of social media messages are images that comprise text and emojis. Emojis are an important source of information [1,6-8]. At present, their usage is common; over half of online texts contain emojis [9]. Many reasons justify the need for further research on emojis, including the increasing number of apps and users that use emojis. Emojis are simple and more expressive than text in communication. They are easy to notice and understand by everyone regardless of language, age, education level, and culture. Additionally, emojis can be embedded in several types of text to add further information regarding one's moods, ideas, and emotions to the text. Despite this, no research has considered the availability of emojis along with text in images [1,6,10].
Object detection is a major branch of computer vision that aims to detect and extract targeted objects in digital images [11,12]. This technique targets several patterns, such as text [12,13], faces [11,14], shapes [15, 16], and humans [17]. Emoji detection could be an essential preprocessing stage in many apps, such as image understanding, image searching and indexing, computer–human interaction, natural language analysis, human emotion analysis, document and text analysis, content-based image retrieval, object identification, and so on.
Nonetheless, emoji detection comes with many challenges, including the uneven/inverted color and scene complexity of the background. Moreover, the associated text can cause issues such as content variation in terms of aspect ratio, multiple orientations, curved text, font variations, and multilingual text [10,12]. In addition, emojis themselves are presented in multiple sizes. This phenomenon occurs between emojis and sets of non-emoji characters and graphical icons. In some cases, the same emoji may have different shapes and colors depending on the issuing platform [10].
This study aimed to develop a new algorithm to detect emoji objects in screenshots. The proposed algorithm consists of two stages, namely localization and verification. In the localization stage, a proposed segmentation method based on novel color analysis and connected component methods are used to localize the candidate-connected components (CCs) of emojis. In the verification stage, a machine-learning model based on color-base and structural features and a decision tree classifier are used to distinguish emoji and nonemoji classes of the candidate's CCs.
The rest of this paper is organized as follows. Section 2 contains a brief review of emojis and related works. In Section 3, the proposed algorithm is presented. The experiments and results are provided in Section 4. Finally, concluding remarks are given in Section 5.
2 Related Works
In this section, a review of emojis and related research is provided. Related studies that have considered smartphone-based textual image analysis and recognition techniques are also presented.
2.1 Emojis
Emojis are graphical characters that present facial emotions, actions, or the writer's mood [9]. They are used as an alternative to the nonverbal communication of text messages [18,19]. Emojis appeared in Japan in the 1990s. Their use has since become widespread in smartphone textual communication, social media platforms, and advertising [19]. Most previous research on emojis focused on their meaning and effects on social media and communication [1,6,20].
Cappallo, et al. [10] claimed in their survey that most of the available research focused on the added effects of emojis on the understanding and level of sentiment of the accompanying text and message, and that some recent studies explored emoji prediction based on the text or associated images. Recently, some studies investigated emojis in the information retrieval and machinelearning fields. Cappallo, et al. [10] proposed a query-by-emoji approach that aims to search and represent a non-textual summary of video content, which is useful in certain cases such as for small screens.
Felbo, et al. [22] proposed an algorithm to predict emojis on the basis of input text. A total of 64 emojis were used to build a prediction model by training a neural network (NN). In a similar study, Barbieri, et al. [6] offered a prediction model based on training long/short-term memory networks to predict matching emojis for Twitter text messages. However, the training database consisted only of the top 20 most frequently used emojis.
El Ali, et al. [23] aimed to determine corresponding emojis for facial emotions. A deep convolutional NN method with 202 emojis was applied by Li, et al. to index seven facial emotion classes [23]. A convolutional NN was used to propose a matching architecture to learn corresponding emojis and classify them.
Previous studies on emojis are limited in number and were based on natural language processing techniques. Research on emojis in the image processing and computer vision fields has generally been neglected.
2.2 Smartphone-Based Textual Images
The widespread use of smartphones to capture, share, and store texts and attached objects elicits the interests of researchers on smartphone-based images. Many studies have considered smartphone images [3-5,25-34]. State-of-the-art methods for smartphone images are limited to text recognition and ignore images. Surveys on screenshot textual images were conducted in [4] and [5].
Chiatti, et al. [4] proposed an algorithm for extracting and retrieving text information from screenshots. The algorithm consists of five stages: (1) preprocessing to prepare the collected screenshot images; (2) text information extraction using optical character recognition; (3) image sorting based on the extracted information; (4) indexing of the screenshot images; and (5) image retrieval based on a text information search engine. Chiatti, et al. [5] proposed a similar algorithm for extracting and retrieving screenshots based on extracted text information. These studies are rare works specifically focused on screenshots.
Several researches on smartphone camera-based textual images have been conducted [3,25-34]. The researchers in [12], [13] and [16] considered smartphone images, especially for text analysis and text recognition. Esser, et al. [25] performed experiments to evaluate the text extraction process from business document images in a mobile camera. Seeri, et al. [26] proposed a character extraction method based on edge features. They used the gray-level co-occurrence matrix and support vector machine to classify the potential text regions under text or non-text contents. This method only considers texts and ignores any text-related graphical objects in the image.
Lu, et al. [35] introduced a method that aimed to detect and segment texts from images. First, candidate text regions are determined on the basis of edge features using a thresholding method. Second, the support vector regression classifier is used to determine the final characters and words. This method removes nearly everything in the image except for the text. Sun, et al. [36] used color-enhanced contrasting extremal region (CER) and NNs to devise a text detection method for scene images. The color features are extracted and used to classify the candidate sub-images into textual or non-textual images.
Rajan, et al. [37] proposed a method for detecting text in images. This method enhances the image to obtain an improved contrast between the objects in the foreground and the background. Then, the maximally stable extremal region algorithm is used to detect characters or text in the image. Tian, et al. [38] proposed a method for detecting text in images. This method uses the multichannel and multi-resolution maximally stable extremal region techniques to extract candidate texts from text regions. Then, the morphological features of convolutional NN and the coarse-to-fine character classifier model are used to remove non-textual regions.
Snoussi and Wahabi [28] proposed a text segmentation method in mobile images for handwritten Arabic texts. Belhedi and Marcotegui [29] proposed an adaptive binarization method based on local thresholding for images captured using smartphones. This method aims to increase text extraction ability. This method achieved better performance than the methods of Niblack, Sauvola and Wolf. However, graphical objects in the images are ignored by this method. In the same context, El Bahi and Zatni [32] presented a method to recognize the textual contents from smartphone images. The presented method starts by locating and segmenting the text region to text-line images, after which a sliding window is applied to divide the text-line image to a sequence of frames. Thereafter, a deep convolutional NN is employed to extract features from the frames. Afterwards, a combination of bidirectional recurrent NN, gated recurrent units, and a connectionist temporal classification layer is utilized for the final classification process.
Sophea [33] proposed a pre-processing method to detect and correct text from image documents obtained by a smartphone. The proposed method consists of binarization, skew correction, and text deduction steps. The results demonstrated an improvement of the recognition rate when applying the proposed method before applying an OCR system.
Many works focused on text detection from camera-based images. Studies involving screenshots are limited. Moreover, detection research on smartphonebased images mainly focused on text components. However, some image components, such as emojis, are ignored. Most of the previous methods adopted a preprocessing stage (e.g. binarization methods), feature extraction, and classification models for the recognition process to segment the text regions.
3 Proposed Method
The proposed method consists of two stages, as shown in Figure 1. In the first stage, three binary images representing the red, green, and blue (RGB) channels and their inverse color scales are extracted. Next, the connected component labeling (CCL) technique is applied to the extracted binary images to label the objects in each image. Then a preparation process based on a set of rules is applied to localize the candidate regions of the emojis. In the second stage, i.e. the verification stage, features are extracted, and a machine-learning model based on a diction table classifier is used to classify the candidate regions to emoji and non-emoji regions.
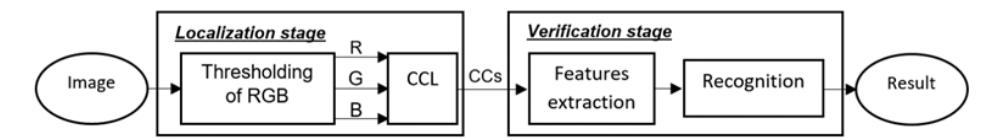
Figure 1 Flowchart of the proposed algorithm.
3.1 Localization Stage
This stage consists of several steps to localize the candidate emojis in an image.
3.1.1 Thresholding of RGB-channels
Color information is a rich and noteworthy feature of color images, which consists of three RGB channels. For each RGB channel scale, color images have many intensities that lead to extensive manipulation data relative to grayscale and binary images. In this context, in certain types of images, such as scene images and mobile screenshots, converting color images to grayscale or binary images leads to loss of significant information. Therefore, to retain the valuable information from screenshot images and facilitate the process, we target the R channel (imageR), G channel (imageG), and B channel (imageB) individually as independent grayscale images.
In general, thresholding algorithms are mainly used to segment image components. Existing thresholding methods are aimed at extracting text and removing non-textual patterns from document images. In contrast, our work aims to preserve non-textual patterns, especially emojis. Current thresholding methods usually target images consisting of a bright background with dark text. In the present study, we implement screenshots consisting of bright patterns on a dark background and dark patterns on a bright background in generally the same image. The available thresholding methods delete the screenshot's contents.
To overcome these problems, we propose a new thresholding method for screenshot images. The proposed thresholding method is inspired by the NICK method. The NICK method is a local thresholding approach that was inspired by the Niblack method from Khurshid, et al. [53]. It divides an image into subimages and then finds the thresholding value of each sub-image independently on the basis of Eq. (1) as follow:
\[T = m + k\sqrt{B - m^2} \tag{1}\] where m is the mean value of the pixel values in the image, k is a factor in the range of [0.2, 0.1], and B is the total value of the grayscale levels that divide the number of pixels in the image. In the NICK method, the mean value m is the main factor to approximate the thresholding value. Furthermore, a miner value \((k\sqrt{B-m^2})\) is added to the mean value to shift the approximated value to the exact thresholding value that retains text and removes other components. In this study, the used thresholding method calculates a threshold value that keeps emoji patterns in the screenshot image. Thus, the threshold value is dropped below or above the median value with adaption based on the nature of the image. Therefore, the median value of 127 for grayscale (0-255) is fixed with a modifier controller on the basis of the absolute value of the mean value state of the image relative to the median (see Eq. (2)).
\[A = Abs (127 - m) - 127 (2)\]
This factor is the main one used to approximate the thresholding value in our method instead of the mean value, as used in the NICK method. Next, the minor value \((k\sqrt{B+m^2})\) is subtracted, resulting in a shift from the approximated value to the exact affected value. On the basis of the result, the general form of the proposed thresholding method is in Eq. (3) below:
\[T = A - k\sqrt{B + m^2} \tag{3}\]
In this study, each RGB channel is implemented individually as an independent grayscale image. Thus, three thresholding methods are used in each channel, as expressed in Eqs. (4) to (6) as follows:
\[T_R = (Abs (127 - m_R) + 127) - k\sqrt{B + m_R^2}\] (4)
\[T_G = (Abs (127 - m_G) + 127) - k\sqrt{B + m_G^2}\] (5)
\[T_B = (Abs (127 - m_B) + 127) - k\sqrt{B + m_B^2}\] (6)
The used thresholding methods extract the binary of red channel (\(ImageB_R\)), green channel (\(ImageB_G\)) and blue channel (\(ImageB_B\)) using Eqs. (7) to (9) below:
\[ImageB_{R}(x,y) = \begin{cases} 0, & Image_{R}(x,y) < T_{R} \\ 1, & otherwise \end{cases}\] (7)
\[ImageB_G(x,y) = \begin{cases} 0, \ Image_G(x,y) < T_G \\ 1, \ otherwise \end{cases}\] (8)
\[ImageB_B(x,y) = \begin{cases} 0, & Image_B(x,y) < T_B \\ 1, & otherwise \end{cases}\] (9)
where, x and y are the pixel position by the length and width of the image. Based on the previous equations, three binary images that represent all the possible patterns of the original image are produced, as shown in Figure 2(b).
3.1.2 Connected Component Analysis and Preparation
In the next step, each of the foreground and background connected components (CCs) in each binary image is labeled. Then, a set of preparation processes are applied to remove unwanted CCs and keep the candidate CCs, which are then classified into emojis and non-emojis in the verification stage. The CCL technique is applied to the three binary images of the previous step and the CCs are given a unique label. Given that we can have various levels of foreground and background colors in the same image, the CCL is applied twice. The first application is aimed at labeling black CCs on a white background, while the second application is aimed at labeling the white CCs on a black background. Geometrical pattern recognition rules are used to analyze the CCs and remove CCs that do not belong to the emojis. In this study, three geometrical rules are proposed to pre-recognize non-emojis. First, small nosy CCs whose lengths or widths are extremely small are removed (Algorithm 1, (step 2)). Large CCs are not emojis or text. Thus, CCs with an extremely large length or width are also removed (Algorithm 1, (step 4)). Finally, CCs with irregularities between length and width are parts of neither text nor emojis. Therefore, they are also removed (Algorithm 1, (step 6)).
| Algorithm (1) | ||||||||
|---|---|---|---|---|---|---|---|---|
| Step (1): | for each CC in each image | |||||||
| Step (2): | \(if (CC_L < 3)OR (CC_W < 3)\) | |||||||
| Step (3): | Remove the CC | |||||||
| Step (4): | Elseif \((CC_L > \frac{image_L}{4})\) OR \((CC_W > \frac{image_W}{4})\) | |||||||
| Step (5): | Remove the CC | |||||||
| Step (6): | Elseif \((CC_L < \frac{CC_W}{9.5})\) OR \((CC_W < \frac{CC_L}{9.5})\) | |||||||
| Step (7): | Remove the CC | |||||||
where \(CC_L\) is the connected component length, \(CC_W\) is the connected component width, \(image_L\) is the image length, and \(image_W\) is the image width. The remaining CCs are the candidate regions of emojis, text, or other graphical components of screenshots, as presented in Figure 2(c), where, \(ImageCC_R\), \(ImageCC_G\), and \(ImageCC_B\) show the final selected CCs of the \(ImageB_R\), \(ImageB_G\), and \(ImageB_B\) images, respectively. The remaining CCs in all binary images are merged together in one image. The matching CCs' regions between the three images are united together in one CC. Here, \(ImageCC_{final}\) is the final CCs' image (Figure 2(d)). The merging process is carried out after unwanted CCs are removed to avoid connecting neighboring emojis in one CC. Figure 2 shows an example of the result of each step of the localization stage.
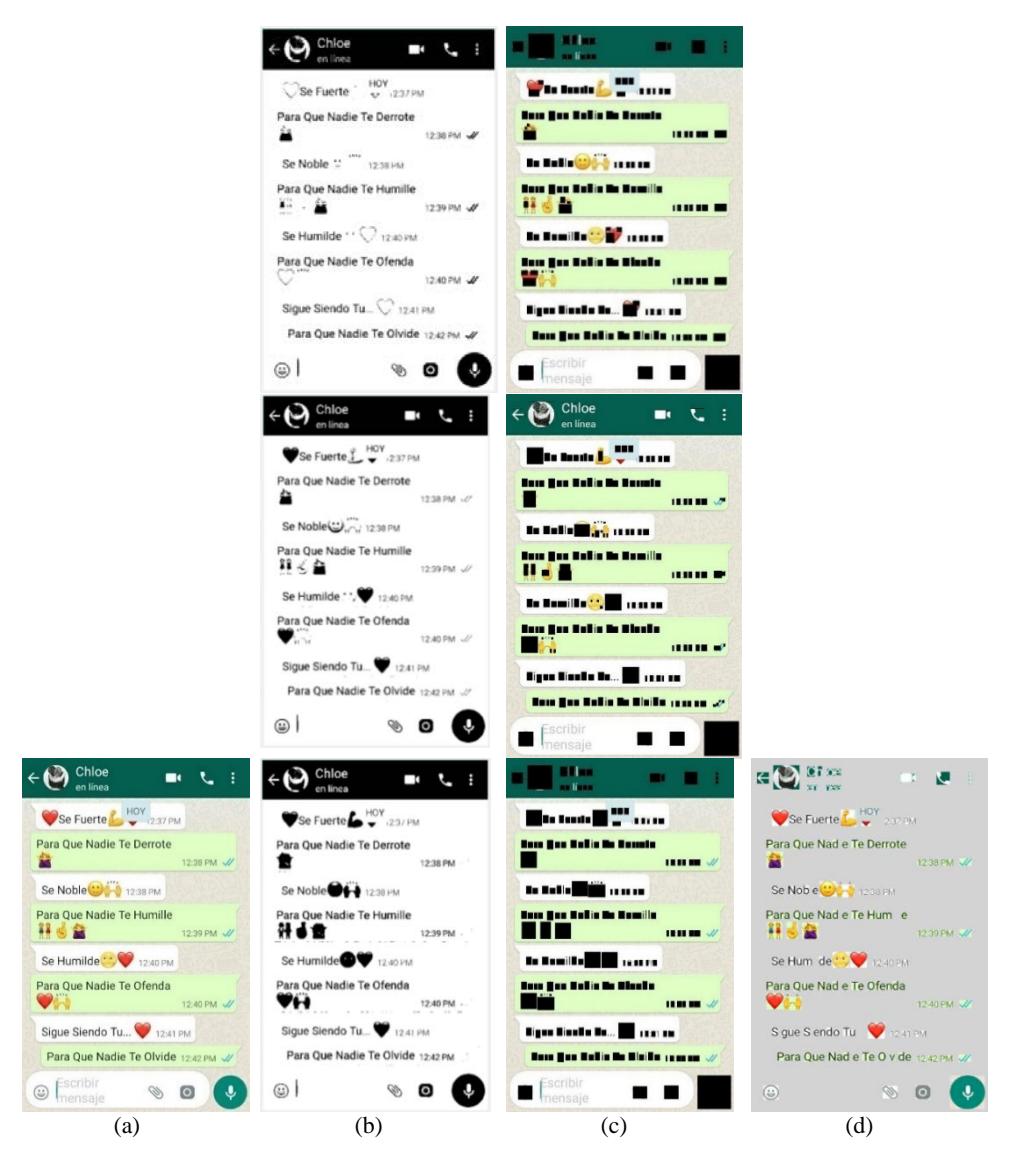
Figure 2 (a) The original screenshot image, (b) the binary form of each redgreen-blue channel (top to bottom: \(ImageB_R\), \(ImageB_G\), and \(ImageB_B\)respectively), (c) the selected CCs of each binary image (marked by black) after removing unwanted CCs (top to bottom: \(ImageCC_R\), \(ImageCC_G\), and \(ImageCC_B\) respectively), and (d) the final image with the candidate CCs after merging all CCs in one image (\(ImageCC_{final}\)).
3.2 Verification Stage
In this stage, a machine-learning model based on the diction table classifier is used to classify the candidate regions into emoji and non-emoji regions on the basis of a set of extracted features.
3.2.1 Features Extraction
Emojis are designed with appealing colors and different variations to attract users. Although text comes in a consistent color, the dissimilarity of its color relative to the background needs to be clear enough for reading [39]. Mandloi [40] claims that color features are one of the most used features in recognition. Furthermore, color features contain more information about objects and indicate more stability compared with geometrical and texture features. Under these claims, color features can be valuable in distinguishing between emoji and non-emoji classes of candidate CCs in verification.
Usually, chat apps use constant colors for text and option icons on distinguishable background colors to make them easily readable for users. In general, they use black on a light background, white on a dark background, or other similar approaches, leading to a similarity in mean values with high statistical standard division values of the R, G, and B channels' pixel values. Although emojis are created from various colors, such variance leads to deviations in mean values and low standard division values between the R, G, and B channels' pixel values. Hence, this study adopted the statistical mean and standard division analysis as a color feature base. The mean values (Eq. (10)) and standard division (Eq. (11)) values for the R, G, and B channels are extracted and used to classify the CCs into emojis and non-emojis.
\[\mu_{Red} = \frac{\sum Pixel_{Red}}{CC_L \times CC_W}, \quad \mu_{Green} = \frac{\sum Pixel_{Green}}{CC_L \times CC_W}, \quad \mu_{Blue} = \frac{\sum Pixel_{Blue}}{CC_L \times CC_W}\] \[\sigma_{Red} = \sqrt{\frac{\sum (Pixel_{Red} - \mu_{Red})^2}{CC_L \times CC_W}}, \quad \sigma_{Green} = \sqrt{\frac{\sum (Pixel_{Green} - \mu_{Green})^2}{CC_L \times CC_W}},\] \[\sigma_{Blue} = \sqrt{\frac{\sum (Pixel_{Blue} - \mu_{Blue})^2}{CC_L \times CC_W}}\] (11)
where, \(Pixel_{Red}\) are all pixel values in the red channel in the targeted CCs, \(Pixel_{Green}\) are all pixel values in the green channel in the targeted CCs, and \(Pixel_{Blue}\) are all pixel values in the blue channel in the targeted CCs.
Furthermore, all emojis are adjusted in a limited number of aspects related to height and width. By analyzing the dimensions of 1,947 different emojis based on Eq. (12), we found that the rates between the height and width of 1,258 emojis (approximately 66% of emoji) were in the range of (1-0.9). Furthermore, in the rates between the eights and widths of 1,933 emojis, more than 99% of emojis were in the range of (1-0.5). Therefore, the proportion between the length and width of an emoji could be a useful feature that helps in distinguishing between emoji and non-emoji classes. Finally, seven features are extracted for use in classification.
\[Rate_{H,W} = \frac{\min(CC_L, CC_W)}{\max(CC_L, CC_W)}\] (12)
3.2.2 Classification and Verification
On the basis of the extracted features, a classification model was built by training a decision tree classifier. A decision tree classifier was used because of its many advantages, such as its easy application, classification and explanation of the results, use of numerical and nominal data, and requirement of minimal effort for data preprocessing and preparation. The J48 decision tree algorithm was used to build the classification model because it is one of the most popular and effective algorithms. It was used in various other studies [39,41-44].
The model was built using a training dataset consisting of 27,350 records. Approximately 200 self-collected screenshots were used to extract the training dataset, comprising approximately 10,018 records for class 1 (emoji class) and 17,332 for class 2 (non-emoji class). The size of the resulting model was 1,674 and it consisted of 824 leaves.
4 Experiments and Results
This section provides a description of the dataset that was used in the training and testing phases. Then, the experiments and the corresponding results from different localization and verification methods are presented in detail.
4.1 Dataset
Previous studies have indicated that no benchmark dataset images for emojis and screenshots are available. Therefore we built a dataset by collecting a range of screenshot images from different resources. In recent years, the use of social networks has increased publicly available information. Information exchange poses privacy risks, which are crucial for users [45,46]. In this work, the privacy of the users included in the collected images was considered during the collection process. Therefore, the collected dataset was only used for training and testing purposes and will not be made available for sharing or publishing. Moreover, to protect the collected data from any unauthorized access or leaking, we encrypted the data and saved them on an isolated storage unit that is separate from a web server. This unit is protected by passwords that are known to the authors only. The security of our system is also an important issue. Our system was supported by firewall and protection applications and was managed by upto-date security rules.
A self-collected dataset consisting of 300 screenshots was used in training and testing. The screenshot images were collected from several sources, such as chat apps from different users' mobile devices and from the web. Figure 3 shows examples of the collected images. These images reflect all the possible challenges of smartphone screenshots. Approximately 200 images were used to train the classification model as mentioned in the previous section and about 100 screenshot images were used in testing. Analysis of the testing images showed that they consisted of approximately 500 emoji CCs and 8,666 nonemoji CCs.
Figure 3 Examples of images collected in the dataset.
4.2 Localization Stage
Several methods have been used to perform regional localization of images. Our method is based mainly on the thresholding and CCL methods. The CCL technique has been widely used in previous studies [12,47-50]. To evaluate the performance of the proposed localization approach, we used selected images from the testing screenshot database with accuracy rate (Eq. (13)) and Fmeasure (Eq. (14)) measurements [51,52].
The selected images were suggested as the most complex screenshot structures whose backgrounds are darker or lighter than the their foregrounds. Moreover, they contain several languages with varying emoji types and colors. The performance of the proposed method was compared with that of the best-known and most widely used methods in thresholding and object segmentation, namely the NICK [53] and Sauvola [54] methods.
\[Accuracy rates = \frac{Number of correct extracted emogies from screenshot}{Number of emogies in screenshot}\](13)
\[FMeasure = \frac{2 \times Recall \times Precession}{Recall + Presession}\] (14)
\[Recall = \frac{TP}{TP + FN} \tag{15}\]
\[Precesion = \frac{TP}{TP + FP} \tag{16}\] where FP denotes false positive, FN denotes false negative, and TP denotes true positive (Eqs. (15) and (16)).
The comparison results presented in Table 1 and Figure 4 show that the proposed method achieved the best accuracy rate (95.28%) in extracting emoji CCs from screenshot images. The NICK method was second best (73.58%).
Table 1 Localization results of proposed, Nick, and Sauvola methods based on accuracy rate, recall, precision, and F-measure measurements.
| Accurate | Recall | Precision | F-measure | |
|---|---|---|---|---|
| Proposed | 95.28% | 95.73% | 99.51% | 97.58% |
| NICK | 73.58% | 74.29% | 98.73% | 84.78% |
| Sauvola | 48.58% | 50.74% | 100% | 67.32% |
In terms of the F-measure, the proposed method also showed the best performance (97.58%). Again, the NICK method came in second (84.78%). Moreover, the proposed method showed the best performance in the recall and precision measurements and in extracting emoji objects without missing parts. It also had the smallest number of nosy parts. Only the Sauvola method had 100%
30 40 50 60 70 80 90 100 FMeasure Accuracy rate
precision, which resulted from its weakness of missing many emoji CCs from screenshot images.
Figure 4 The results of the proposed, Nick, and Sauvola methods based on accuracy rate, and F-measure measurements.
Proposed Nick Sauvola
4.3 Verification Stage
An experiment was conducted to evaluate the performance of the proposed method in terms of classification accuracy. The used features were compared with those of the feature extraction method based on local binary patterns (LBPs) to evaluate the features that are most efficient. Recently, the feature extraction method based on LBPs has emerged as one of the most widely used and efficient methods for pattern recognition and texture analysis [55-58]. Moreover, several classification methods were used for comparison with the proposed classification method. The results of the used decision tree classifier were compared with those of widely used classification methods, namely Bayesian network, decision table rules, and perceptron NN. To conduct these experiments, we split the used dataset into a training dataset (66%) and a testing dataset (34%).
Figure 5 shows an example of the visual output of the verification stage; the emoji CCs are marked with red, whereas the other components are ignored. The statistical results in Table 2 show that the proposed method based on the decision tree obtained a high accuracy rate of 97.23%. The accuracy rate of LBPs was about 93.48% using decision tree. The proposed method also achieved a higher accuracy rate compared to LBPs with Bayesian network. The proposed method had a similar accuracy rate of 93.04% using perceptron NN, whereas the LBP method achieved an accuracy rate of 93.11% using perceptron NN. The LBP method attained higher accuracy rates than the proposed method using only the decision table rules.
Nevertheless, the accuracy rates of both methods were extremely low in this case.
Figure 5 Examples of the end results of emoji detection.
Table 2 Results of the classification accuracy rate of the proposed and LBP methods using decision tree, bayesian network, perceptron NN, and decision table rule classifiers.
| Proposed | LBP | |
|---|---|---|
| Decision tree | 97.23% | 93.48% |
| Bayesian network | 87.58% | 85.12% |
| Perceptron NN | 93.04% | 93.11% |
| Decision table rules | 76.55% | 81.48% |
Given the small number of used features by the proposed method with the decision tree classifier, it consumed the least processing time at approximately
1.25 seconds for model building, while the LBP method required approximately 4.29 seconds.
For further analysis of the results, the experiment on the proposed method with the decision tree model and the LBP method was repeated 10 times. The results are presented in Figure 6 and Table 3. The t-test statistical analysis was applied to the results. According to the results and descriptive statistics presented in Table 3, the mean of the accuracy values of the proposed method (97%) was higher than that of the LBP method (93.21%). The proposed method obtained a standard deviation of 0.19, which is lower than that achieved by the LBP method (0.27). Regarding the results in Table 3, the t-value is −36.03293 and the p-value is < 0.00001. Thus, the result is significant at p < 0.05, and the output of the t-test statistical analysis was straightforward.
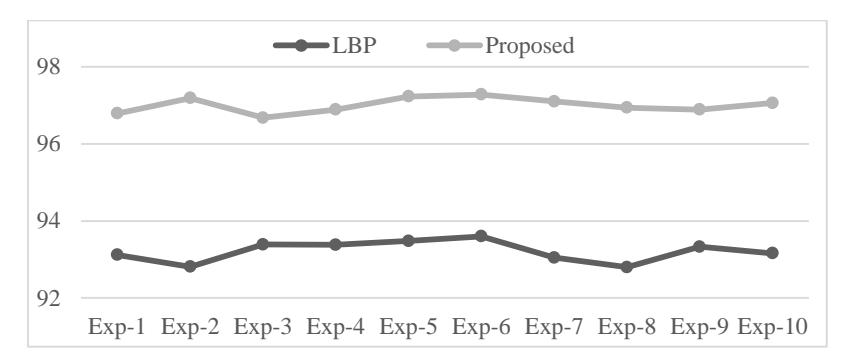
Figure 6 The results of ten repeats of the proposed and LPB methods.
Table 3 Results of T-test and P-test of the proposed and LPB methods' performance after ten repeats.
| Exp-1 | Exp-2 | Exp-3 | Exp-4 | Exp-5 | Exp-6 | Exp-7 | Exp-8 | Exp-9 | Exp-10 | Mean | SS | |
|---|---|---|---|---|---|---|---|---|---|---|---|---|
| LBP | 93.12 | 92.81 | 93.39 | 93.38 | 93.48 | 93.6 | 93.05 | 92.8 | 93.33 | 93.16 | 93.2 | 0.27 |
| Pro. | 96.79 | 97.19 | 96.68 | 96.89 | 97.23 | 97.28 | 97.1 | 96.94 | 96.89 | 97.06 | 97 | 0.19 |
| P-value<0.00001 | T-value=-36.03 | |||||||||||
This study focused on a point that has been previously ignored in the literature. A novel emoji detection algorithm was developed on the basis of a sequence of methods for preprocessing, feature extraction and classification stages. In this study, the proposed thresholding method overcomes the problem of the original method that extracts textual and removes non-textual components.
The principle of working with the R, G, and B channels improves the detection and extraction processes of different components in screenshot images regardless of the level of their clearness or brightness. In contrast, the proposed rules for preparing the CCs remove many unwanted components, thereby decreasing the required memory and processing time.
5 Conclusion
In this study, we proposed a method for extracting and detecting emojis from screenshot images. The proposed method consists of localization and verification stages. In the localization stage, an RGB channel segment of textual and non-textual components of the screenshot image is proposed. Furthermore, a set of rules is used to remove unwanted components. In the verification stage, a structural and color feature with a decision tree classifier is used to classify the components into emoji and non-emoji classes. The results indicate that the localization process in the proposed thresholding method provides satisfactory performance.
The proposed method achieved an accuracy rate of 95.28%, whereas the NICK and Sauvola methods achieved accuracy rates of 73.58% and 48.58%, respectively. Furthermore, the selected features were smaller in number and were more meaningful than those of the LBP method. The adopted classification model also showed better performance than the Bayesian network, perceptron NN, and decision table rules. The developed method performed better than state-of-the-art methods: the proposed method using a decision tree classifier achieved an accuracy rate of 97.23%, whereas the LBP method achieved an accuracy rate of 93.48%.