
1 Introduction
The current explosion of the creation and usage of digital images in our lives leads to the need for more digital image processing techniques to manipulate digital images using computers [1-3]. Digital images are created using several different methods ranging from mobile phone cameras for daily usage to satellite cameras for aerial images and from simple scanners for documents to medical scanners for the human body, and several more [3,4]. These different methods and conditions can lead to several undesirable effects, such as blurring, and degraded contrast and brightness as well as an incorrect balance of color levels [3-6]. Therefore, image enhancement techniques have attracted the attention of many researchers. Furthermore, image enhancement techniques aim to improve the quality of the visual appearance of images that suffer from the previously mentioned problems
Received December 12th, 2019, 1st Revision May 28th, 2020, 2nd Revision July 23rd, 2020, Accepted for publication August 13th, 2020.
Copyright © 2020 Published by IRCS-ITB, ISSN: 2337-5787, DOI: 10.5614/itbj.ict.res.appl.2020.14.2.1
[1-5,7-9]. This can make the processed image appear clearer and more useful than the original image for its purpose [3,4,8,10].
Histogram equalization (HE) is one of the most important and widely used techniques in image enhancement [2,11-14]. It is a simple, easy to implement, and effective technique to improve the visual properties of images by normalizing the conventional distribution of gray levels using a suggested cumulative distribution function (CDF) and a new probability density function (PDF) [1,2,8]. The results are new images with a regular histogram distribution and modified gray-level values, leading to a better visual appearance for observers [2,11,13-15]. Therefore, the HE technique is integral to several applications, such as face and iris recognition, digital photography, texture analysis, medical image analysis, satellite image processing, and many more applications of image display processing [1,2,7,8,12].
1.1 State of the Art
In a number of research works [1,6,8,16,17] methods for image enhancement based on HE techniques have been proposed. Some of these are considered effective benchmark methods. Histogram equalization (HE) is a popular method to improve image quality. It uses a simple principle, i.e. remapping the histogram of density values to obtain a more regular distribution. This method is simple, easy to use, and effective. However, it may produce annoying side effects and unnatural enhancement, and it reduces the details of small things [1,6,8,16].
Many improvements have been proposed to overcome the drawbacks of the original HE method. The dualistic sub-image histogram equalization (DSIHE) method [18] aims to preserve the information and brightness of the image. This method divides the histogram into two sub-histograms based on the median value of brightness. The DSIHE method preserves the details and brightness of the original image. However, it may produce noise and cause over-enhancement. Another method, called dynamic histogram specification (DHS) [19], has been proposed to enhance the contrast and preserve the features of the original histogram. This method can effectively eliminate annoying side effects, however, it does not show significant results with a wide range of image cases.
On the other hand, the minimum mean brightness error bi-histogram equalization method (MMBEBHE) [20] and its improvement, which is called recursive meanseparate histogram equalization (RMSHE) [21], have been proposed to preserve the optimal brightness of the input image. Both methods are based on the minimum mean brightness error to divide the image into two parts and modifying each part individually. The outcomes of these methods are effective with respect to brightness preservation. However, MMBEBHE is slow in processing and RMSHE is complex to develop. Moreover, these methods produce undesirable side effects and lead to loss of information from the input images. An improvement of RMSHE, called recursive sub-image histogram equalization (RSIHE), has been proposed [22]. It divides the image into two parts based on the mean of brightness. A serious problem in RMSHE and RSIHE is finding the optimal iterative factor to achieve the best results. Moreover, RSIHE is time-consuming.
Exposure-based sub-image histogram equalization (ESIHE) [23] is another HE method that has been proposed to preserve brightness during contrast enhancement. In the ESIHE method, the clipped histogram is divided into two parts by using a threshold method. Then, HE is applied to each part separately. This method preserves the mean brightness. However, it usually produces over-enhanced or under-enhanced results. The adaptive gamma correction with weighting distribution (AGCWD) method [24] enhances the contrast in the input image. AGCWD transforms the gamma correction of luminance pixels to improve the brightness of dim images. The disadvantage of this method is that it does not produce satisfactory results at several brightness levels of the pixels and leads to information loss.
The radiance indicator-based histogram equalization for retinal vessel enhancement method (RIHE-RVE) [25] focuses on retinal imaging enhancement. This method divides a histogram into sub-histograms at threshold levels calculated by a tunable parameter, after which each sub-histogram is equalized independently. This method produces good results with low-contrast medical images, but it fails to produce satisfactory results with other types of images. The mean- and variance-based subimage histogram equalization method [11] aims to enhance the contrast and preserve the brightness of the original image. In this method, the histogram of the gray levels is divided into four parts based on the mean of brightness and contrast. Then, each sub-histogram is equalized independently to obtain the enhanced image. This method shows great performance. However, some information may be lost from images that have a narrow range of gray levels. By contrast, the bi-histogram equalization using the modified histogram bin (BHEMHB) method [13] has been proposed to enhance contrast in narrow-range-brightness images. However, it produces weak results in case of contrast encasement.
The adaptive histogram equalization algorithm (AHEA) [26] aims to enhance images while keeping the information entropy as it is. In AHEA, the entropy information is used to adjust the spacing between close gray levels to produce new histograms. This method enhances image visibility and preserves information entropy. However, it causes over-enhancement or under-enhancement in several image types. The exposure region-based multi-histogram equalization (ERMHE) method [27] has been proposed to enhance the contrast in uneven illumination images. This method divides the histogram by using region-based histogram
segmentation thresholds. Then, it uses an entropy-controlled gray-level allocation scheme to create a new histogram. ERMHE produces enhanced images with a natural appearance. However, it does not produce satisfactory results at several brightness levels.
Based on the previous literature review, many HE methods have been proposed. Some these methods, such as those previously mentioned, are the most effective and well-known ones. However, most of the HE methods suffer from problems such as annoying effects, weak brightness levels, loss of image information and details, and over-enhancement or under-enhancement in several cases. However, some of them produce satisfactory results with respect to the brightness and contrast levels, although they can also produce annoying side effects and noise in many cases.
In this context, previous studies have categorized the HE methods into local and global techniques [7,26,28]. Local histogram equalization methods use a sliding window to determine the specific pixels for enhancement. This improves the enhancement of the regions of interest [7]. However, local methods fail due to overlapping problems as well as due to being complex to implement and slow in processing [28]. Global histogram equalization methods are mainly implemented by modifying the histograms of full images. They are simple to implement and fast in terms of processing time. However, global methods have some disadvantages, such as the possibility of over-enhancement in contrast, production of noise and failure to preserve the brightness levels [16].
The objective of this work was to propose a novel, adaptive and global histogram equalization method for gray-scale images. The proposed method is as simple and fast as classical histogram equalization methods and aims to overcome the disadvantage of the global histogram equalization approach. Additionally, the proposed method has been developed based on two sequential equalization steps using two different cumulative distribution functions (CDF). The first CDF enhances the histogram values while the second CDF enhances the space between the gray levels of the enhanced histogram from the first equalization step. To evaluate the performance of the proposed method its performance was compared with a number of well-known benchmark histogram equalization methods, i.e. HE [12], AHEA [26], ESIHE [23], and MVSIHE [11]. The used dataset consisted of five benchmark image datasets to cover the each method's performance on different types of images.
The remaining sections of this paper are organized as follows: Section 2 describes the proposed method, Section 3 discusses the experiment, result, and discussion, and Section 4 presents the conclusion of this paper.
2 Proposed Method
This section describes the proposed method in detail. The initial input is a grayscale image with values that range normally from (0-255). Subsequently, the histogram of the input image is constructed to present the frequency of each gray value in the images. Then, the histogram is clipped to remove the extreme affection of large values in the histogram. Then, the clipped histogram is equalized in the first equalization stage. The outcomes are equalized again in the second equalization stage to obtain the final enhanced image. The overall steps of the proposed method are shown in Figure 1.
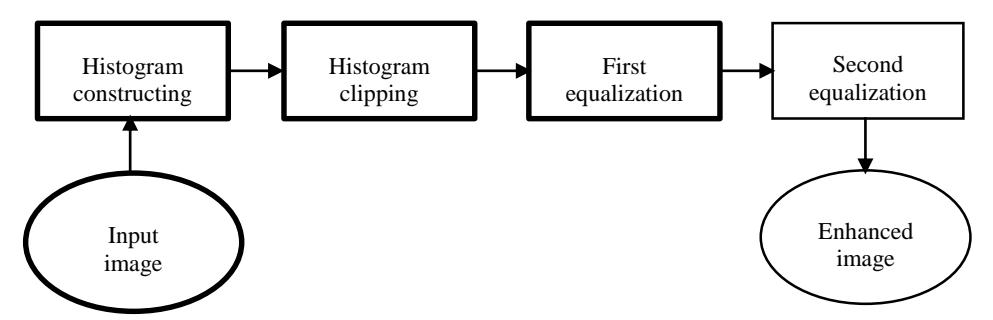
Figure 1 Flow chart of the proposed method.
2.1 Histogram Construction
Firstly, the distribution of the gray values of input images is represented. The input is a gray-scale image with values that range normally from [0-L], where L is the number of gray level values (normally L = 255). In this direction, the histogram is a popular representation of the value distribution. It presents the frequency of each value. Thus, let the following Eq. (1) be the global histogram of the frequency of each gray level value in the image:
\[His(l) = His(l) + 1: for l = 0 to L\] (1)
Figure 2(a) presents an example of the earth image from the Aerials dataset and Figure 2(b) shows its histogram representation.
2.2 Histogram Clipping
Histogram clipping reduces any over-enhancement to get a neutral appearance of the enhanced image. To reduce over-enhancement, we need to reduce the histogram itself [23,29] by avoiding the extreme affection of large values in the histogram compared with small values in the equalization process. Accordingly, histogram values greater than the threshold are limited to a threshold. Several state-of-the-art methods have been used to calculate the clipping thresholds. In this work (see Eqs.
(2) and (3)), the mean value of the occurrence values was used because it is effective and consumes little time [23,29].
\[T_c = \frac{1}{L} \sum_{l=0}^{L} His(l)\] (2)
\[H_c(l) = T_c: for His(l) > T_c\] (3)
where \(T_c\) is the clipping threshold value, l is a gray level value from 0 to 255, His(l) is the histogram of the original image, and \(H_c(l)\) is the clipped histogram. Figure 2(c) shows an example of the clipping threshold level. The upper values in the histogram have been removed.
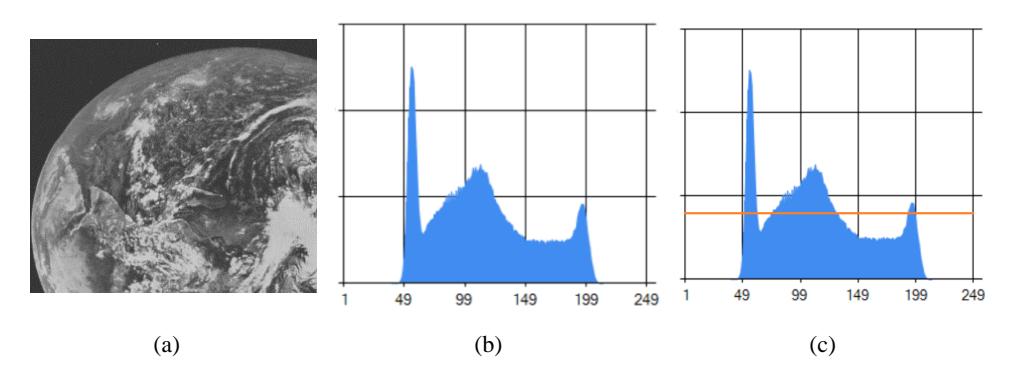
Figure 2 (a) An earth image from Aerials dataset, (b) the image histogram, and (c) the threshold value of the histograms in accordance with the mean value.
2.3 First Equalization
The clipped histogram has a smaller number of occurrences. It reduces the number of most occurring pixels and preserves the number of the least occurring pixels. To use the affected new values of occurrences, the newly clipped histogram is normalized, and the corresponding probability density function (pdf) of the clipping histogram \(P_c(l)\) is computed as follows in Eq. (4):
\[P_c(l) = \frac{H_c(l)}{\sum H_c(l)} \tag{4}\]
Next, the first process of the cumulative distribution function (cdf) is defined as follows in Eq. (5):
\[C_{1st}(l) = \sum_{l=0}^{l=255} P_c(l)\] (5)
where \(C_{1st}(l)\) is the cdf of the clipped histogram.
Subsequently, equalization of the histogram will be conducted. The new value transferring function is defined as in Eq. (6):
\[l_{new} = C_{1st}(l) \times 255 \tag{6}\] where \(l_{new}\) is the gray-level value transferred after the equalization process.
2.4 Adaptive Second Equalization
When the new gray-level value \(l\_new\) of the original pixels values is calculated, the second equalization process adaptively adjusts the space between occurrences in \(l\_new\) by equalizing the effect of all available occurrences. This process is achieved by using the position of existing occurrences instead of the position of occurrence values. In beginning, the positions of occurrence Occ in the \(l_{new}\) are computed in Eq. (7) as follows:
\[\text{[rumus tidak dapat ditampilkan dengan baik — lihat PDF asli]}\] (7)
Then, a new probability density function of the occurrences is calculated based on the available gray-level values and the missing gray-level values in Eqs. (8) and (9):
\[N = \sum Occ(l) \tag{8}\]
\[P_2(l) = \frac{occ(l)}{N} \tag{9}\] where N is the number of non-zero occurrences and \(P_2(l)\) is the corresponding probability density function of the new occurrences. Subsequently, the cumulative distribution function of the \(P_2(l)\) is computed in Eq. (10) as follows:
\[C_{2nd}(l) = \sum_{l=0}^{l=255} P_2(l)\] (10)
Next, the last equalization process is applied based on the following transferring function in Eq. (11):
\[l_{Final} = C_{2nd}(l) \times 255 \tag{11}\]
All steps of the proposed algorithm are presented in Algorithm 1. Finally, the final gray-level values of the processed image pixels are integrated and presented.
Algorithm 1: the proposed method
Step 1: His(l) = His(l) + 1: for l = 0 to L // the histogram of the input image
Step 2: \(T_c = \frac{1}{l} \sum_{l=0}^{L} His(l)\) // the clipping threshold
Step 3: \(H_c(l) = T_c\): for \(His(l) > T_c\) // the clipped histogram
Step 4: \(P_c(l) = \frac{H_c(l)}{\sum H_c(l)}\) // the pdf of the clipping histogram
Step 5: \(C_{1st}(l) = \sum_{l=0}^{l=255} P_c(l)\) // the cdf of the \(P_c(l)\):
Step 6: \(l_{new} = C_{1st}(l) \times 255\) // the new gray-level values
Step 7: \(\text{[rumus tidak dapat ditampilkan dengan baik — lihat PDF asli]}\)
3 Experiments and Discussions
A series of experiments was conducted to evaluate the performance of the proposed method. A number of recent and well-known histogram equalization methods, i.e. HE [12], AHEA [26], ESIHE [23], and MVSIHE [11], were used to compare their performance with the proposed GTSHE method. The HE method was selected because it is the basis of the global histogram equalization method; it is the principle of several other HE methods and displays perfect performance with several sets of images. The AHEA method is an adaptive method that is effective with several types of images and has previously been used to evaluate several of the proposed methods. The ESIHE method is a local method that shows better performance than well-known methods such as HE [12], BBHE [30], MMBEBHE [21], DSIHE [18], RSIHE [22], and RMSHE [20]. The MVSIHE method is a recent method that displays high performance compared to previous benchmark methods, i.e. DSIHE [18], RMSHE [20], MMBEBHE [21], RSIHE [22], ESIHE [23], and BHEMHB [13]. Furthermore, based on the above justification, the previous methods were selected to evaluate the performance of the proposed method. All involved methods were developed using Python. The experiments were conducted on the same computer device (Intel core i5 processer 6400) to obtain a fair presentation for each method's performance.
3.1 Database
To conduct the experiments, several datasets of images were used in this work. The experiments were conducted on several types of images. The evaluation was done using a number of different datasets: Galaxies and Biomedical from the CVG-UGR database [32], and Miscellaneous, Aerials, and Texture datasets from the database of the University of Southern California [33]. Additionally, we selected 58 low-quality gray-scale images that represented different shapes of galaxies from the Galaxies dataset. Furthermore, a Biomedical dataset consisting of 39 gray-scale images with varying quality of different objects, such as cells, chromosomes, and medical images were used. From the miscellaneous dataset, 29 images of different objects, such as humans and vehicles, were selected. The category Aerials consisted of 37 aerials images and 50 images of different types of textures were selected from the Texture dataset. In total, approximately 213 different images that covered
different types of subjects were used in the experiments. Original images from each dataset are presented as examples in Figures 3-8(a).
3.2 Visual Evaluation
In order to display and compare the performance levels of each HE method, visual experiments were conducted on selected images to evaluate the quality of the visual results. This visual estimation was necessary alongside statistical estimation. Furthermore, the visual results and their estimation can highlight the advantages and disadvantages of the output images in a clear and understandable presentation.
Based on the visual results in Figures 3-8, the proposed method showed the clearest results for the challenges of each selected image. In the galaxy image (Figure 3), the original image had a low-contrast problem. Based on the results, the proposed GTSHE and ESIHE methods showed the best performance. The cellule image (Figure 4) had low contrast and a narrow range of gray-level values. The results of all methods showed various forms of enhancement. In general, the best observation was noted for the proposed GTSHE, HE, and AHEA methods. The Tank image had low quality and contrast values, as shown in Figure 5.
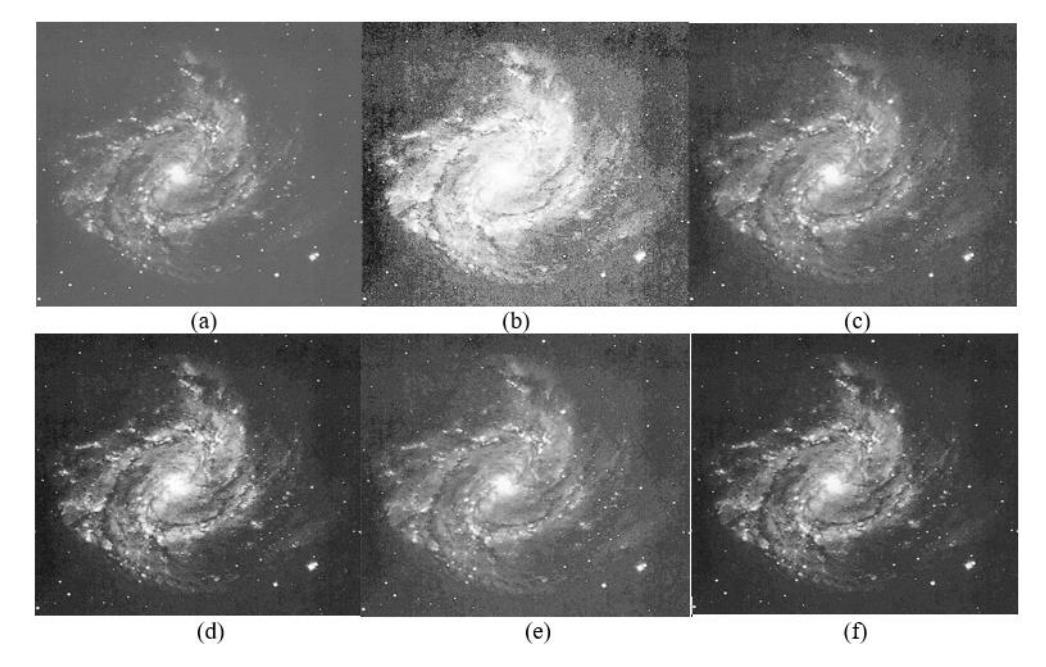
Figure 3 The results for the galaxy 5236 image (Galaxy) from the Galaxies dataset from the CVG-UGR database: (a) original image, (b) HE, (c) AHEA, (d) ESIHE, (e) MVSIHE, and (f) proposed GTSHE.
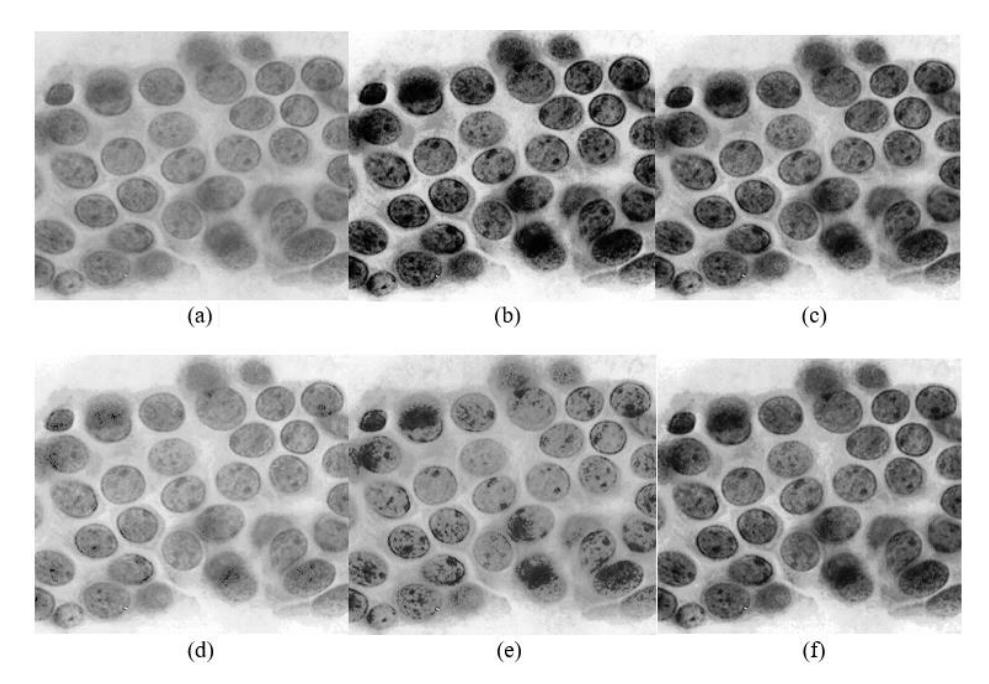
Figure 4 The results for the image (Cellules) from the Biomedical dataset from the CVG-UGR database: (a) original image, (b) HE, (c) AHEA, (d) ESIHE, (e) MVSIHE, and (f) proposed GTSHE.
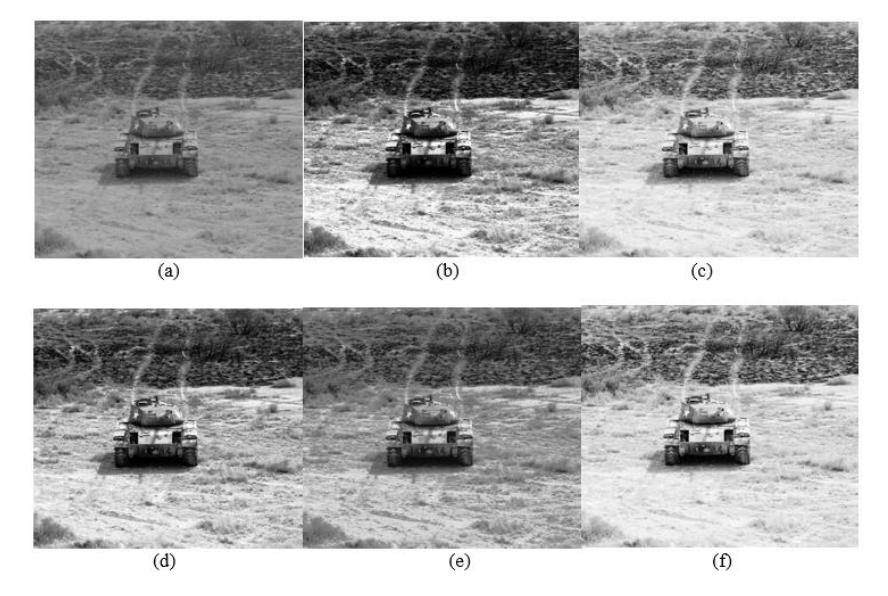
Figure 5 The results for the 7.1.08 image (Tank) from the miscellaneous dataset from the University of Southern California database: (a) original image, (b) HE, (c) AHEA, (d) ESIHE, (e) MVSIHE, and (f) the proposed GTSHE.
The proposed GTSHE and AHEA methods showed the clearest scene in comparison with the dark and noisy scenes produced by the other methods. In the case of Lena (Figure 6), the proposed GTSHE, HE, and ESIHE methods showed clearer, brighter, and more vibrant scenes compared to the other methods. In the case of the extremely low-contrast Aerial image (Figure 7), the proposed method produced the best output, showing all details clearly without under- or over-bright levels as observed in the results of the other methods. Finally, in Figure 8, the proposed GTSHE and HE methods provided satisfactory levels of gray-scale values compared to other methods. In summary, the visual results showed that the proposed GTSHE method performed well, whatever the characteristics of the input images, while the other methods performed well with some image types but failed with others.
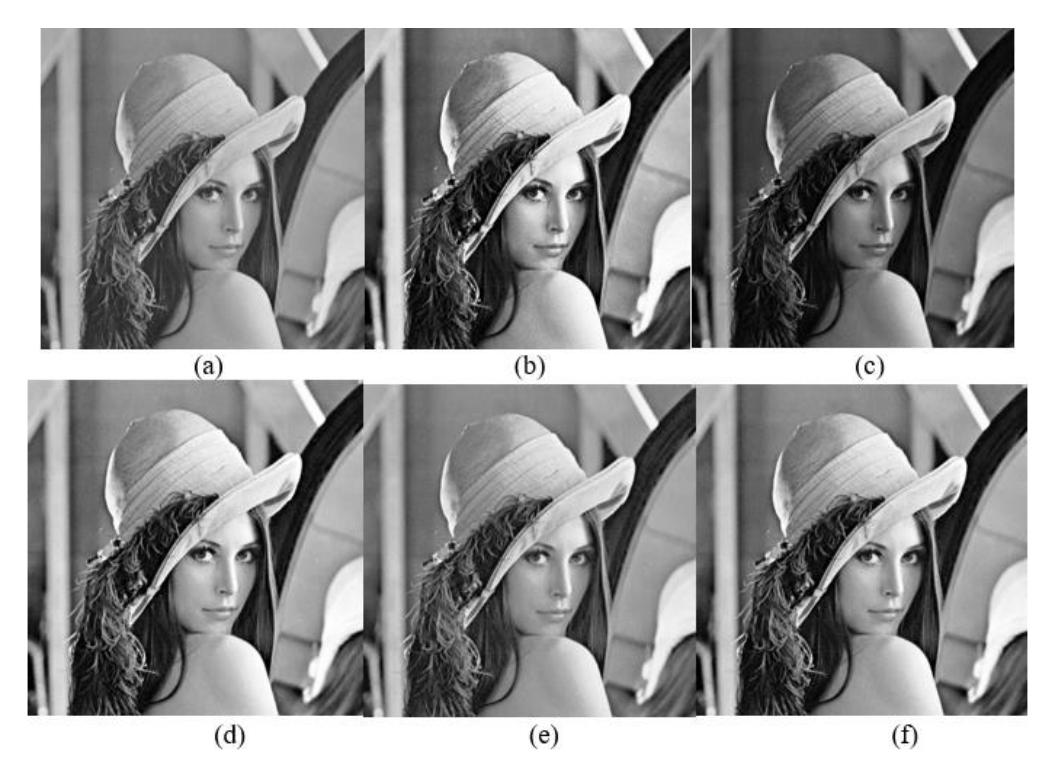
Figure 6 The results for the 4.2.04 (Lena) image from the Miscellaneous dataset from the University of Southern California database: (a) original image, (b) HE, (c) AHEA, (d) ESIHE, (e) MVSIHE, and (f) the proposed GTSHE.
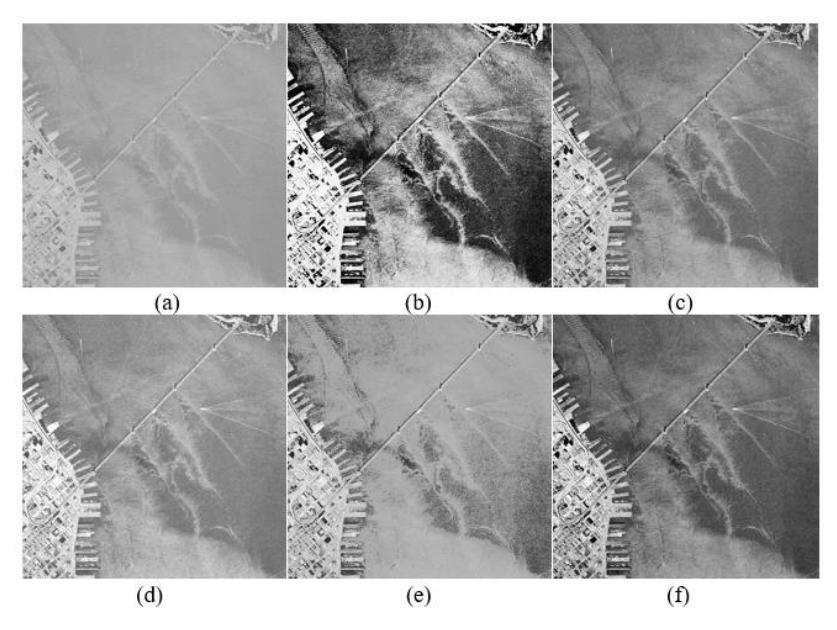
Figure 7 The results for the 2.2.06 (Aerial) image from the Aerials dataset from the University of Southern California database: (a) original image, (b) HE, (c) AHEA, (d) ESIHE, (e) MVSIHE, and (f) the proposed GTSHE.
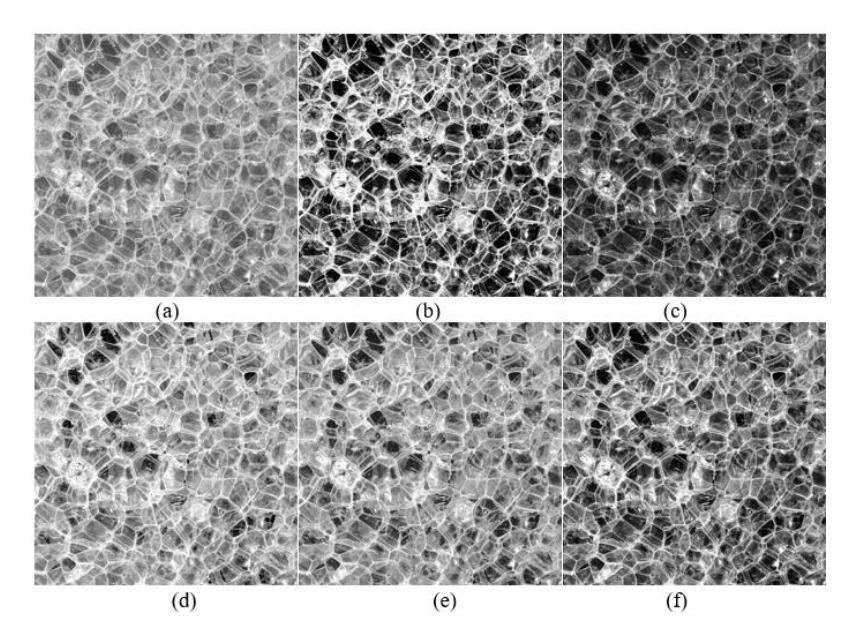
Figure 8 The results for the 1.3.13 image (Pores) from the Aerials dataset from the University of Southern California database: (a) original image, (b) HE, (c) AHEA, (d) ESIHE, (e) MVSIHE, and (f) the proposed GTSHE.
3.3 Statistical Evaluation
The visual evaluation showed simple and understandable results about the performance of the involved methods. However, this is not a scientific analytical measurement technique to evaluate the performance of the HE methods. The results' evaluation was not based on any benchmark or fair measurement. Moreover, human eyes may not recognize some problems and noise. To overcome these problems, a significant number of different images were analyzed with statistical benchmarks to evaluate the performances of the respective HE methods. The adopted benchmarks were peak signal-to-noise ratio (PSNR) [2,11,25] and average information content (entropy) [2,29,31].
PSNR measurement is a popular benchmark to evaluate histogram equalization performance by showing the value of contrast enhancement, which evaluates the quality enhancement of the resulted image compared to the original image. To represent PSNR, the mean squared error (MSE) of two gray-scale images was computed first using the following Eqs. (12) and (13):
\[MSE = \frac{1}{(X \times Y)} \sum_{x=0}^{x=X-1} \sum_{y=0}^{y=Y-1} (Orginal_{image}(x, y) - Processed_{image}(x, y))^{2}\] \[(12)\]
\[PSNR = 10 \log_{10} \left( \frac{255^2}{MSE} \right) \tag{13}\] where X and Y are the width and high of the image, respectively, while x and y are the positions of particular pixels in the image, \(1 \le x \le X\) and \(1 \le y \le Y\), respectively.
On the other hand, the average information content (entropy) is a widely used benchmark to evaluate the richness of the information in an image. The entropy can be represented by Eq. (14):
\[Entropy = \sum_{l=0}^{l=255} e(l) = -\sum_{l=0}^{l=255} p(l)log_2p(l)\] (14)
where l is the gray level value and p(l) is the probability of occurrences l in the image.
Table 1 shows the analytical evaluation of the images discussed in the visual evaluation section. Based on the results, the proposed GTSHE method produced better performance levels compared to the other methods in all cases. Additionally, the proposed method produced the highest PSNR values for all images compared to the other methods. In the galaxy image, GTSHE and MVSIHE produced the highest PSNR values, i.e. 21.819 and 21.505, respectively. On the other hand, the remaining methods produced low PSNR values. In the case of the cellule image, the proposed GTSHE method produced the highest PSNR value, i.e. 26.72. Additionally, this was also achieved for all the other image types; the proposed
method produced the best PSNR values for the Tank, Lena, Aerial, and Pores images, i.e. 23.079, 35.915, 24.373, and 31.429, respectively. In contrast, the MVSIHE method produced the second-best PSNR values for all images. The HE, AHEA, and ESIHE methods showed varying performance depending on the input image. Based on the entropy values in Table 1 it is notable that all methods had almost the same performance, which indicates that all methods provided the same ability to preserve the information in the images. This was expected because the involved methods are the state-of-the-art. In the case of the combination of both measurements, the proposed method displayed the best ability to enhance the visualization properties and image details.
Table 1 PSNR and entropy values of the HE, AHEA, ESIHE, MVSIHE, and proposed GTSHE methods for the selected images in the visual experiment.
| Galaxy | Cellules | Tank | Lena | Aerial | Pores | ||
|---|---|---|---|---|---|---|---|
| HE [12] | PSNR | 13.046 | 14.956 | 15.957 | 19.932 | 11.005 | 14.436 |
| Entropy | 3.831 | 4.549 | 6.19 | 7.487 | 5.695 | 7.228 | |
| AHEA [26] | PSNR | 19.646 | 17.237 | 13.336 | 15.977 | 16.896 | 11.642 |
| Entropy | 3.831 | 4.548 | 6.189 | 7.342 | 5.695 | 7.165 | |
| ESIHE [23] | PSNR | 15.86 | 22.407 | 16.768 | 22.528 | 21.644 | 23.219 |
| Entropy | 3.821 | 4.539 | 6.149 | 7.437 | 5.653 | 7.162 | |
| MVSIHE[11] | PSNR | 21.505 | 24.834 | 22.253 | 30.68 | 20.546 | 25.687 |
| Entropy | 3.812 | 4.505 | 6.151 | 7.404 | 5.596 | 7.145 | |
| Proposed | PSNR | 21.819 | 26.72 | 23.079 | 35.915 | 24.373 | 31.429 |
| Entropy | 3.82 | 4.51 | 6.158 | 7.444 | 5.663 | 7.161 |
The experiments were conducted on five different image datasets. The average of the results for each dataset is reported in Tables 2 and 3. Based on the results in Table 2 and Figure 9(a), the proposed GTSHE method achieved the best performance on all datasets except for the Biomedical dataset. Meanwhile, for the Galaxies dataset, the proposed method produced the highest PSNR value (24.078) followed by the MVSIHE method (23.868). Furthermore, the same appeared with the Aerials, Miscellaneous and Texture datasets, i.e. 28.243, 28.944, and 30.089 respectively for the proposed method, and 24.51, 27.607, and 28.722 respectively for the MVSIHE method. The only difference appeared with the Biomedical dataset; the MVSIHE and ESIHE methods produced the best performances, i.e. 30.52 and 26.796, respectively, followed by the proposed method with 24.175.
However, based on Table 3 and Figure 9(b), the proposed method produced the highest entropy value for the Biomedical dataset. This means that it is the best method in preserving the information for this dataset. In general, there was a minor difference between the methods in terms of information richness in the processed images. In contrast, the proposed method produced the highest entropy values for most cases (Galaxies, Biomedical, Miscellaneous and Texture datasets). Only for the aerial dataset images, the proposed method produced the second-best value (6.656) after the HE method (6.693).
Table 2 PSNR results of the HE, AHEA, ESIHE, MVSIHE, and proposed GTSHE methods for the galaxies, biomedical, aerial, miscellaneous and texture datasets.
| Galaxies | Biomedical | Aerial | Misc. | Texture | |
|---|---|---|---|---|---|
| HE | 12.277 | 16.31 | 14.087 | 15.672 | 16.822 |
| AHEA | 19.964 | 12.98 | 15.412 | 16.001 | 16.214 |
| ESIHE | 18.019 | 26.796 | 20.949 | 22.009 | 21.996 |
| MVSIHE | 23.868 | 30.52 | 24.51 | 27.607 | 28.722 |
| Proposed | 24.078 | 24.175 | 28.243 | 28.944 | 30.089 |
Table 3 Entropy results of the HE, AHEA, ESIHE, MVSIHE, and proposed GTSHE methods for the galaxies, miomedical, aerial, miscellaneous and texture datasets.
| Galaxies | Biomedical | Aerial | Misc. | Texture | |
|---|---|---|---|---|---|
| HE | 3.885 | 3.987 | 6.693 | 6.263 | 6.63 |
| AHEA | 3.846 | 3.361 | 6.65 | 6.041 | 6.108 |
| ESIHE | 3.873 | 3.962 | 6.648 | 6.209 | 6.567 |
| MVSIHE | 3.866 | 3.93 | 6.608 | 6.197 | 6.527 |
| Proposed | 3.967 | 4.144 | 6.656 | 6.545 | 6.668 |
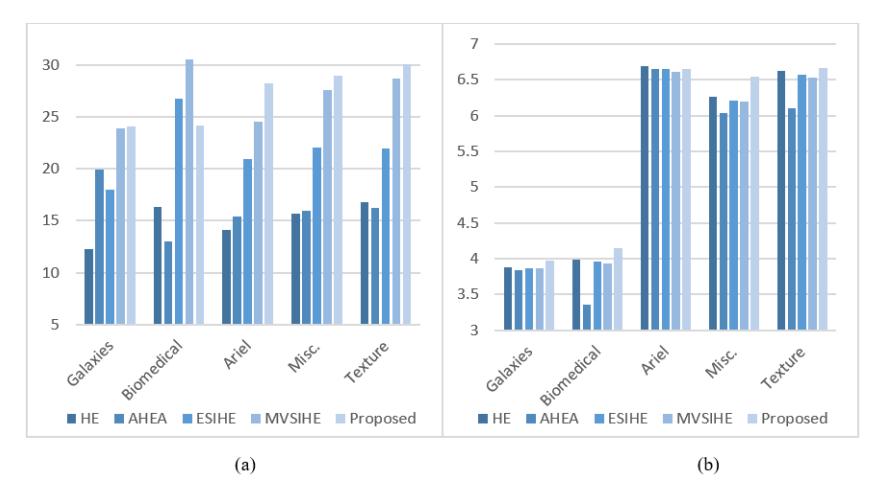
Figure 9 (a) The PSNR and (b) entropy results of the HE, AHEA, ESIHE, MVSIHE, and proposed GTSHE methods for the Galaxies, Biomedical, Aerials, Miscellaneous and Texture datasets.
3.4 Discussion
Based on the previous experiments, we compared the performance of the involved methods based on their ability to enhance the quality of the visual appearance and to preserve the details and information in the processed image. The HE [12], AHEA [26], ESIHE [23], and MVSIHE [11] methods are well-known methods that can overcome most of the histogram equalization challenges from previous HE-based works, as discussed in the literature review. Therefore, good performance by using the involved methods is expected but with shortcomings in some cases. Based on the results, we arrived at the following conclusions:
- 1. The HE method is simple, fast and effective for a wide range of images. Moreover, its methodology to modify all values of the histogram significantly affects the information in the image. Therefore, HE is a good method to preserve image information as indicated by its entropy results. However, the methodology of HE highlights unnecessary information in several images. This leads to undesirable effects and deterioration of the visual features, which is reflected in its PSNR results.
- 2. The AHEA method preserves the information and details in the processed images. Its ability to enhance the image contrast depends on the type of image used. However, AHEA fails with some images, which leads to overenhancement or under-enhancement in several cases. This decreases the average of its PSNR and entropy results.
- 3. The ESIHE method is one of the best methods to preserve the brightness details in the processed images. However, its results depended on image type. The performance was high with some image types and weak with some others. Moreover, some images with low contrast showed weakness points with respect to brightness and contrast levels.
- 4. The MVSIHE method preserves the brightness and the image details, and the contrast enhancement is effective. In the case of enhancement of image visibility, this method fared the best after the proposed method, except for biomedical dataset images. However, this method is not the best to preserve the information and details in the images. The ESIHE and the proposed method had the best performance (in terms of entropy) in most cases.
- 5. The proposed GTSHE method enhanced the brightness, image detail, and contrast effectively in most images as evident from the PSNR results. The GTSHE method did not enhance the visual properties of the biomedical dataset effectively. However, it was the best with the remaining datasets. Moreover, it preserved the information in the images effectively with most images. The results of the entropy were the best for four of the five involved datasets in the experiments.
Based on the above analysis, each method was effective, some more than the others. However, in general, the proposed method provided the most effective performance for most datasets than the other methods. The outcomes prove that the proposed GTSHE method performed best in terms of the enhancement of images visually and in terms of brightness and contrast for most images. Moreover, it preserves the images' information and details effectively for most images than in other methods. It did not display over-enhancement, under-enhancement, undesirable side effects, and noise with all image cases. Future works could adopt machine-learning algorithms to achieve high accuracy rates and outperform the traditional statistical enhancement methods.
4 Conclusion
In this work, an effective global two-stage based histogram equalization method called GTSHE for gray-level images was proposed. This method adopts the principle of the traditional HE technique and therefore it is simple to develop and fast in processing. This method enhances the image histogram based on two stages. The first stage equalizes the histogram after clipping unwanted data. Subsequently, the result of the first stage is equalized again using the proposed equalization method, which is based on flattening the values of the gray-level ranges equally. A series of experiments was conducted on several datasets from the Galaxies, Biomedical, Aerials, Miscellaneous, and Texture datasets. Additionally, the performance of the proposed method was compared using well-known HE-based methods, i.e. the HE, AHEA, ESIHE, and MVSIHE methods. The results showed that the proposed method performed better than the other methods.