
1 Introduction
Encryption is the transformation of readable text into cipher text that cannot be unscrambled except with the right decryption key. Encryption methods are important tools to guard secret information. Decryption is the reverse process of encryption to revert encrypted text to the original text [1]. Image ciphering makes it possible to transfer an image securely over the Internet to prevent illegitimate users from being able to decrypt the image. Image ciphering, video ciphering, chaos based encryption have implementations in numerous areas, such as Internet communication, transportation, medical imaging, telemedicine, militant communication, etc. The image data hold discriminatory features such as block capability, high redundancy and high pixel correlation. Conventional encryption algorithms, for example Data Encryption Standard (DES), International Data
Received November 14th, 2019, 1 st Revision August 31st, 2020, 2 nd Revision October 26th, 2020, 3rd Revision November 5th, 2020, 4th Revision November 15th, 2020, Accepted for publication November 30th, 2020. Copyright © 2020 Published by IRCS-ITB, ISSN: 2337-5787, DOI: 10.5614/itbj.ict.res.appl.2020.14.2.3
Encryption Algorithm (IDEA), Advance Encryption Standard (AES), etc., are not appropriate for multimedia encryption for several reasons, i.e. images require more time for encryption processing since image files are larger than text files; key sensitivity; and the decryption by conventional algorithms must be exactly identical to the real image. Multimedia systems have their own properties, such as large data sets, high pixel correlation and very high data frequency, which can eliminate the efficiency of encryption methods [2,3].
To adjust to those features of multimedia data and provide effective and highly secure image encryption, various methods have been proposed. Cryptographic schemes can use efficient methods to provide more secure image encryption with chaotic techniques. Chaos-based encryption schemes can be developed exploring the characteristics of chaos. Chaos theory analyzes the nature of dynamical systems that are extremely sensitive to the initial conditions, which makes them preferred in security applications. Small changes in the initial conditions (for example, in numerical calculations when rounding errors occur) yield widely diverging outcomes for such dynamical systems [4,5]. Chaotic cryptosystems have considerable advantages, such as: high degree of security, increased resilience and modularity, high flow rate of encryption, and computationally cheaper. All these merits make chaotic cryptosystems more appropriate for multimedia encryption [6,7]. Chaos properties such as unpredictability, randomness and disorder have been proven to provide good security schemes. These properties make chaotic scrambling of an image an attractive option in comparison with conventional encryption algorithms [8]. There are two essential schemes for using a chaotic cryptosystem. The first scheme uses pseudo-random sequence generation of the key to encrypt plain text in different ways. The second scheme uses the initial state, i.e. plain text, and encrypted text is generated from the orbit. These schemes are applied to encrypt images and videos, and to confuse and shuffle the plain text location. Generally, these two approaches are employed together in multimedia information encryption [9].
A chaotic map is a map that performs behavior that is chaotic to some extent, with probability parameterized by a continuous-time or a discrete-time parameter. It generates random pseudo-numbers that help to generate a sequence key. Properties of chaotic maps such as complexity, efficiency and speed have encouraged cryptographers to create novel encryption systems [10]. The 1D logistic map was developed to generate chaos functions that can be exploited in cryptography applications. 3D functions offer greater security against attacks such as brute force. A higher dimensional chaotic system has advantages compared to 1D chaotic systems, for example a larger key space and high speed in generating the sequence key. Therefore, this study used a 3D chaotic logistic map. The high unpredictability and apparently random properties of chaotic
outcomes constitute an intriguing aspect of deterministic chaotic systems that encourage different new uses [11].
Many researchers have promoted different image encryption techniques concentrating on the dimension of chaotic techniques, or using hybrid techniques. In [12] the authors developed a hybrid chaotic map algorithm utilizing three levels to generate the key. On the first level, the original image is decomposed utilizing Arnold's cat map, which changes the pixel positions. This is the first step of generating the secret key. Then, the pixels of the decomposed image are scrambled to provide extra erraticness and indiscriminateness. Lastly, the scrambled image is disseminated through a key produced by joining sequences created from Henon and logistic chaotic maps. The authors in [13] derived a chaotic logistic map that depends on encryption flow feedback utilizing a 256-bit foreign obscure key. The logistic chaotic map range is increased from 1.3 to 9.55 for the variable r. An image encryption method using 3D chaotic map has been developed in [14] by linking with a permutation-diffusion encryption design. The authors suggested performing the permutation twice and then revising the distribution of the grey levels with the diffusion operation. In [15] a chaotic cryptosystem based on Arnold transformation and pseudo-randomly enhanced logistic map (PELM) is proposed for medical image encryption. The encryption is accomplished by Arnold transformation, after which the pixel value is changed with a chaotic key sequence. The authors in [16] developed an adequate scheme using 3D logistic map along with SHA-3 and an ECG signal to deal with the leakage of a firm key and issues with additional invariance in the original image. The initial condition along with the control parameter is created using the ECG signal to fix the key robustness issue. The value is computed using SHA-3 to bypass the perceptivity of additional invariance.
In this paper, a combination of two chaotic maps is suggested to provide highly secure image encryption. The proposed method can be applied to greyscale, square and non-square images. Besides, it can also be used to encrypt color images after converting them to the YCbCr space model. The rest of this paper is arranged as follows: the combination of 3D logistic chaotic map and Arnold's cat map implementation is presented in Section 2; the proposed encryption method and the security analysis are discussed in Section 3; finally, the conclusion of the paper is provided in Section 4.
2 The Proposed Method
This paper adopted two chaotic maps (3D logistic map and Arnold's cat map) to encrypt the image. The general encryption procedure is shown in Fig. 1. Before showing the proposed encryption and decryption method, the 3D logistic map and Arnold's cat map are introduced first.
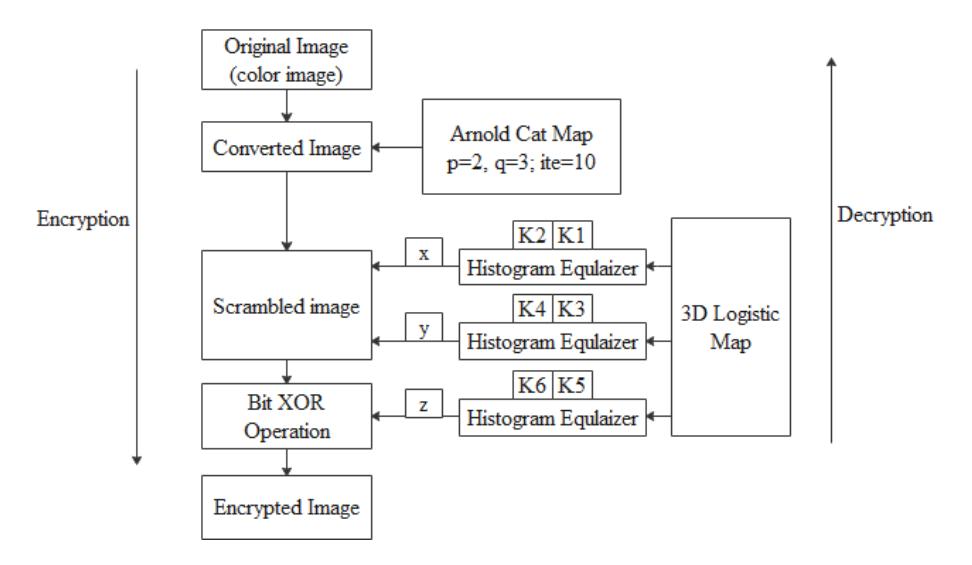
Figure 1 The proposed encryption method.
2.1 3D Chaos Logistic Map
3D chaos logistic maps are generated based on a widely used classic onedimensional chaotic logistic mapping system. 1D logistic map is a polynomial map that reveals chaotic conduct. The simplest form of logistic map is given by Eq. (1). \(\mu\) must be equal to 4 in order to give the chaotic characteristics.
\[x_{n+1} = \mu x_n (1 - x_n) for \ o < x_n < 1\] (1)
Liu [1] proposed 2D logistic maps to enhance security. Khade & Narnaware [11] proposed a 3D chaotic map with the following equations:
\[x_{n+1} = \gamma x_n (1 - x_n) + \beta y_n^2 x_n + a z_n^3\] (2)
\[y_{n+1} = \gamma y_n (1 - y_n) + \beta z_n^2 y_n + a x_n^3\] (3)
\[z_{n+1} = \gamma z_n (1 - z_n) + \beta x_n^2 z_n + a y_n^3\] (4)
The chaotic behavior is achieved with , x, y, x, initial condition (0-1), and the values \(0 < \alpha < 0.015\), \(0 < \beta < 0.022\), \(3.53 < \gamma < 3.81\). Figure 2 shows the chaotic behavior generation of 3D logistic map with the following values: x(1) = 0.2350; y(1) = 0.3500, z(1) = 0.3755, \(\alpha = 0.0125\); \(\beta = 0.0157\); \(\gamma = 3.8000\). The chaotic map generates numbers with a pseudo-random generator to assist in generating the sequence keys [3]; the initial conditions (x(0), y(0), z(0)), the control parameters \((\alpha, \beta, \gamma)\), and the random numbers (K1, K2, K3, K4, K5, K6) form the key.
Histogram equalization is a technique for enhancing image contrast. It transforms the average image brightness to the center of the allowable scope, hence it is inappropriate for consumer electronic outcomes while maintaining the original brightness is fundamental to evade annoying artifacts [17]. In this paper, an image with M x M dimension was equalized to have higher security using the following equations:
\[x = (integer(x \times K2)) mod M\] (5)
\[y = (integer(y \times K4)) \mod M \tag{6}\]
\[z = (integer(z \times K6)) mod 256 \tag{7}\] where K2, K4, K6 are large random numbers greater than 10,000 [3]. The histogram of the 3D chaotic map is shown in Figure 2.
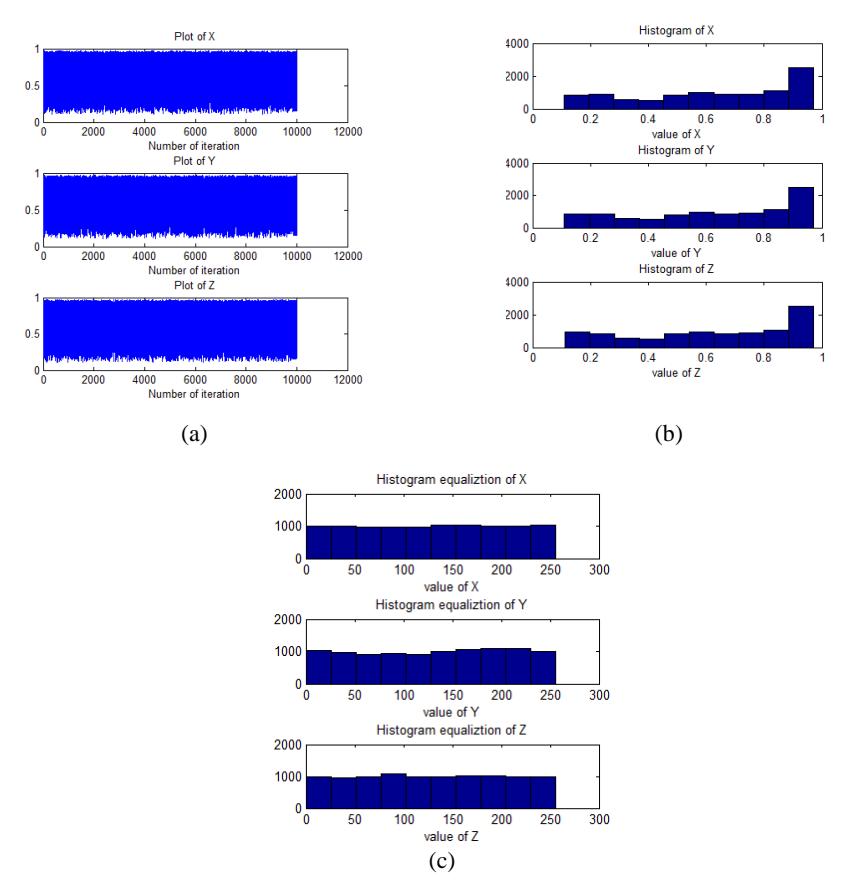
Figure 2 (a) Chaotic behaviors of 3D logistic maps, (b) histogram of x,y,z, (c) histogram equalization of x,y,z.
2.2 Arnold's Cat Map
Arnold's cat map is a fundamentally chaotic map that can be utilized for image encryption measurement. The initial secret key contains the initial condition and the control parameters of Arnold's cat map. It readjusts the locations of the image pixels that represent highly relevant information; however, after a certain amount of repetition it reverts to the locations of the original pixels and in that way generates the original image. Arnold's cat map is expressed with the following equation [12,18,19]:
\[[X_{m+1} Y_{m+1}] = [1 p q pq + 1][X_m Y_m] mod M\] (8)
where p and q are control parameters, ( ∗ ) is the image size, (, ) is the original image pixel position, and (+1, +1) is the new pixel position in the scrambled image after employing Arnold conversion.
2.3 Encryption Method
The proposed encryption method includes a mix of 3D logistic map and Arnold's cat map. The encryption method is applied with the following steps:
- 1. The control parameters for Arnold's cat map are set to p = 2, and q = 3 and the number of iterations = 10 in order to obtain an extra scrambled image. Arnold's cat map is applied to a converted color image (greyscale or YCbCr space model) square input image with size (M,M) to shuffle the pixel locations in proportion to Eq. (8). The new pixel locations are at +1,+1.
- 2. 3D logistic map generates three chaotic sequences (x,y,z) by applying the above-mentioned parameters in Eq. (5) to (7), respectively. For the pixel permutation process, circular row and column rotation is performed. Large random numbers are generated for K1 and K3 to be the indexing of row circular right rotation and column circular down rotation respectively. The rotation number conforms to the x chaos sequence and y chaos sequence, so the image pixel permutation is done along x and y. The aforementioned step is applied to the scrambled image for greyscale images as shown in Figure 3(a). For colored images it is converted to the YCbCr model. First the scrambled image (x,y) that resulted from step 1 is combined with Cb,Cr images and then the permutation process is performed as shown in Figure 3(b).
- 3. For more robust encryption, another step for changing the pixel value is required. The XOR operation changes the pixel values in a way that cannot be reversed without knowing the sequence key of the chaotic process. A large random number K5 is generated as the index of this operation. The XOR operation is performed between the sequence number (z) as generated from Eq. (7) and the converted (permutated and transformed) image to a one-
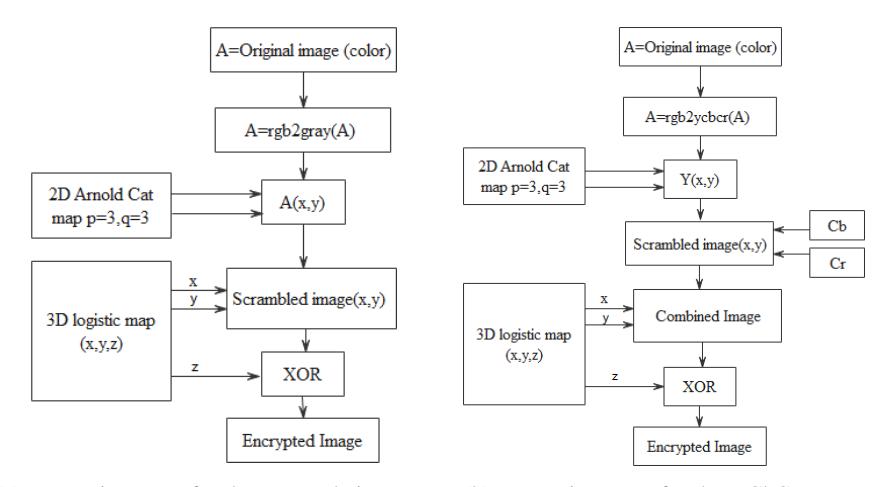
- (a) encryption steps for the greyscale image (b) encryption steps for the YCbCr space model
Figure 3 Encryption steps for the greyscale image and the YCbCr space model.
2.4 Decryption Method
The original image can be retrieved effectively by using the same parameters and applying the encryption method in reverse order: XOR operation, 3D chaotic map, and inverse Arnold's cat map.
3 Results and Discussion
The strength of an image encryption method can be measured by its invulnerability to any form of attack. Several performance tests can be implemented on the encrypted image to assess how robust it is toward various attacks. Six different types of security measurement metrics were used to assess the security of the proposed method. For simulation purposes, three images (Peppers, Lena, Mandrill) were used for both the color image encryption after conversion to YCbCr space and the greyscale image encryption with 256 x 256 size. A comparison with Ref. [3] was done to evaluate the proposed method. The simulation tests were performed using MATLAB R2015a.
The encryption and decryption processing time measurements for the greyscale image and the YCbCr space model were 0.992812 seconds and 1.394571 seconds respectively. The following parameters were used for the simulation:
(1) = 0.2355; (1) = 0.3510; (1) = 0.7355; = 0.0130; = 0.0200,
            = 3.8000; 2 = 4 = 6 = 100000,1 = 5000,
           3 = 6000,4 = 7000,  = 2,
            = 3,     = 10
3.1 Image Encryption Analysis
To encrypt the color image, first, the input image was converted to the YCbCr space model and then the encryption procedure mentioned in the previous section was utilized to encrypt the Y channel only, since the most important information resides in the Y-channel. In Figure 4, the top part shows the conversion of the color image to the YCbCr space model and the bottom part shows the histogram of each image.
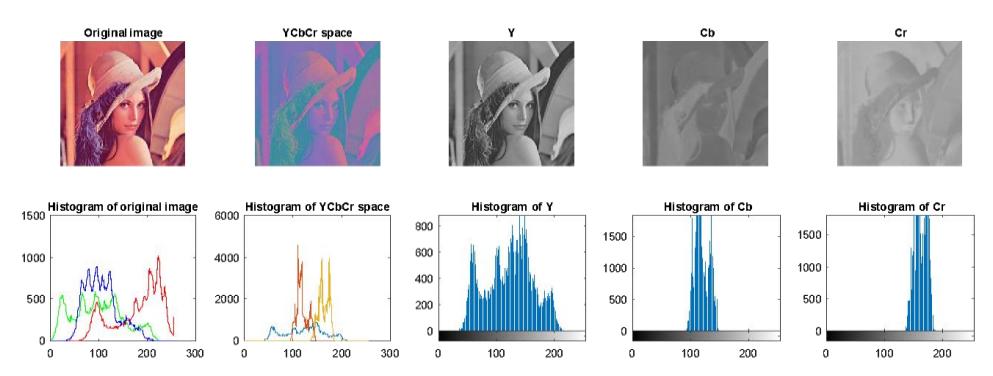
Figure 4 Top: image conversion to the YCbCr space model. Bottom: the histogram of each image.
Figure 5 shows the original image, the encrypted image from Ref. [3] and the proposed encryption method for both the greyscale image and the YCbCr space model. It is obvious that the image is diffused appropriately and very different from the original one. The decrypted images in Figure 5(f) and (h) resulted from the decryption procedure show the successfulness of the proposed method in decrypting the greyscale and color images.
3.2 Histogram Analysis
The image histogram presents the pixel distribution in an image by indicating the amount of pixels for every color concentration scale. The histograms of the encrypted images are very regular and considerably different from the histograms of the original images. They exhibit no statistical equivalence to those of the original images and thus there is no clear statistical clue for an attacker against the proposed method. Figure 6 shows the histograms of the original images and of the encrypted images.
Figure 5 Original images and encrypted images.
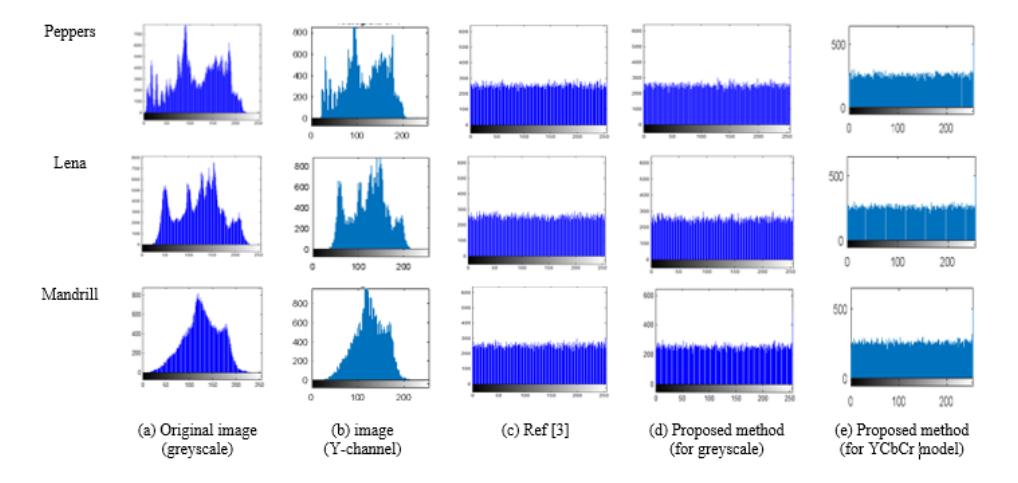
Figure 6 Histograms of original and encrypted images.
In this figure, (a) are the histograms of the original images; (b) are the histograms of the encrypted images in [3], (c) and (d) are the histograms of the greyscale and YCbCr encrypted images using the proposed method respectively. It can be observed that the pixel distribution is uniform, which makes it difficult for an attacker to deduce the original image.
3.3 Correlation of Adjacent Pixels
Digital images contain highly redundant information and pixels are highly correlated to their vertical and horizontal neighbor pixels. An attacker can adequately conclude pixel values through statistical analysis of weakly encrypted images. Signal autocorrelation shows the correlation between the signal and lagged form.
The subsequent procedure is performed to test the correlation between two neighboring pixels vertically and horizontally in a ciphered image. Initially, 2000 pairs of neighboring pixels are randomly selected from an image. Next, the correlation coefficient of every pair is determined by applying the following two equations [20]:
\[R = \frac{\sum_{i=1}^{K} (x_i - \underline{A})(y_i - \underline{B})}{\sqrt{(\sum_{i=1}^{N} (x_i - \underline{A})^2)((y_i - \underline{B})^2)}}\](9)
\[\underline{A} = \frac{1}{K} \sum_{i=1}^{K} x_i \tag{10}\]
\[\underline{B} = \frac{1}{K} \sum_{i=1}^{K} y_i \tag{11}\] where K is the number of selected neighboring pixels that is used to calculate the relationships in the image; xi and yi, are the values of neighboring pixels in the image; <u>A</u>, <u>B</u> are the average values in the vertical and horizontal directions. A viable encryption scheme provides low or close to zero correlation values for vertical and horizontal neighboring pixels.
Table 1 presents the correlation coefficient analysis report of the encrypted images both horizontally and vertically. The correlation coefficients of the encrypted images using the proposed method were nearly zero, proving that the proposed method can significantly eliminate adjacent pixel correlations in the image. Thus, it prevents statistical intrusion.
Mandrill Peppers Lena Ref [3] Proposed Proposed Ref [3] Proposed Proposed Ref [3] Proposed Proposed method method method method method method (grey scale) (YCbCr) (grey scale) (YCbCr (grey scale) (YCbCr) Horizontal -0.0024-0.0022-0.0034 -0.0043 -0.0093-0.0001 -0.0005 -0.0042-0.00040.0083
0.0067
0.0051
-0.0052
0.0036
Correlation coefficients analysis. Table 1
Figure 7 displays the correlation of 3 images with size 256 x 256 for both horizontal and vertical correlations. In Figure 7, (a) lists the correlations in the 0.0014
Vertical
0.0081
0.0102
original images, (b) lists the correlations in the encrypted images in Ref. [3], (c) and (d) lists the correlation of the greyscale and YCbCr encrypted images using the proposed method. It can be seen that the neighboring pixels in the original images were extremely correlated and located closely to the center while the encrypted images display a uniform distribution of pixels.
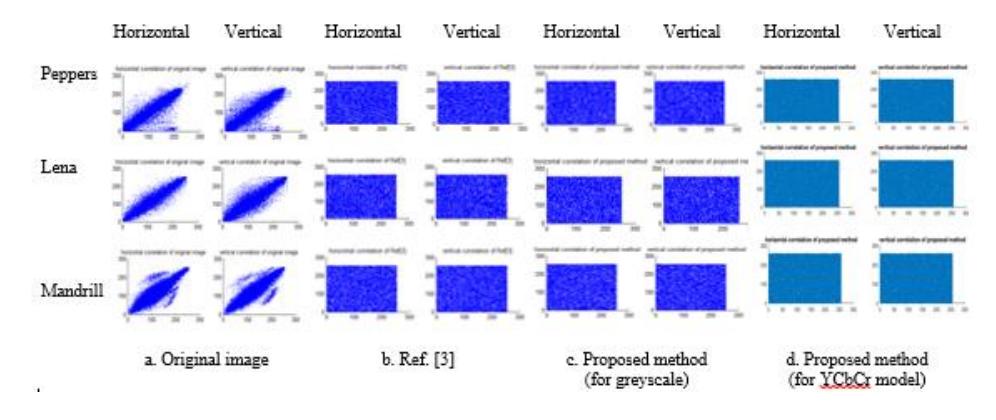
Figure 7 Correlations of original and encrypted images.
3.4 Information Entropy Analysis
Information entropy is a standard utilized to measure the concentration of an encryption algorithm. Information entropy is used to examine the randomness of the image. The ideal entropy is determined by the following equation [21]:
\[H(m) = \sum_{j=0}^{M-1} \left[ p_j \log_2 \frac{1}{p_j} \right]\] (12)
where M is the total number of symbols, (p) indicates the probability of incidence of symbol \(p_i\). In 8-bit messages with identical possibility, the information entropy will have a perfect value, i.e. 8, to prevent attackers from recognizing the information. Table 2 presents the computed entropy of both the original and the encrypted images. The results show that the values were near the ideal value, which means there is only insignificant information flow at the time of encryption. Thus the proposed method is robust against entropy intervention.
| Original | Ref [3] | Proposed method (greyscale image) | Proposed method (YCbCr model) | |
|---|---|---|---|---|
| Peppers | 7.7300 | 7.9896 | 7.9887 | 7.9881 |
| Lena | 7.7598 | 7.9890 | 7.9889 | 7.9883 |
| mandrill | 7.6790 | 7.9895 | 7.9885 | 7.9876 |
Table 2 Information entropy analysis.
3.5 Number of Pixel Change Rate (NCPR)
NPCR is a measurement used to assess the image encryption's robustness against differential attacks, where a high NPCR percentage means strong protection. It calculates the percentage between two different encrypted images when one pixel value of the original image is changed [22]. For two images, x and y, with (i, j) pixels at x(i, j) and y(i, j), the NPCR is expressed as follows:
\[NPCR = \frac{\sum_{i=1}^{H} \sum_{j=1}^{W} D(i,j)}{W*H} * 100\%\] (13)
where W is the width and H is the height of the two encrypted images and (i, j) is defined as:
\[\text{[rumus tidak dapat ditampilkan dengan baik — lihat PDF asli]}\] (14)
NPCR analysis helps to define the susceptibility of a scheme against various attacks. Table 3 presents the NPCR analysis of the encrypted images. It can be seen that the proposed method achieved perfect performance.
Table 3 NPCR of encrypted images.
| Peppers | Lena | Mandrill | |
|---|---|---|---|
| Ref [3] | 99.5972 | 99.6048 | 99.6368 |
| Proposed method (greyscale) | 99.6292 | 99.6307 | 99.6201 |
| Proposed method (YCbCr Model) | 99.6277 | 99.5926 | 99.6231 |
3.6 Unified Average Changing Intensity (UACI)
UACI calculates the mean intensity of variation between two images [23]:
\[UACI = \frac{1}{W*H} \left[ \sum_{i=1}^{H} \quad \sum_{j=1}^{W} \quad \frac{x(i,j) - y(i,j)}{255} \right] * 100\%\] (15)
Table 4 shows the UACI analysis records for the encrypted images. The one pixel change was high, since its impact can be seen from the UACI value, which was over 33%.
Table 4 UACI of encrypted images.
| Peppers | Lena | Mandrill | |
|---|---|---|---|
| Ref [3] | 33.5189 | 33.5044 | 33.6354 |
| Proposed method (greyscale) | 33.7432 | 33.8106 | 33.7635 |
| Proposed method (YCbCr Model) | 33.7837 | 33.6416 | 33.7296 |
3.7 Key Space Analysis
An efficient cryptosystem must have a large key space to defeat brute-force attacks. In the proposed encryption method, the key consists of two chaotic maps. The key forwarded from the control parameters of Arnold's cat map (p, q) ranges from 1 to M. The other key is generated from the initial conditions and a random number from 3D logistic maps, i.e. (1014) 6 and (105 ) 6 respectively. For example, an image with size 256 x 256, would provide a key space of 2562 × 10114 ≈ 2 360, which is large enough for computational security.
4 Conclusion
In this paper, a robust image encryption method was proposed for securing the transmission of images over the Internet, combining two chaotic maps. The proposed method was designed to encrypt both greyscale and color images. The combination of 3D logistics map and Arnold's cat map can strongly raise the effectiveness of image encryption by having a large number of secret keys. In order to investigate the efficacy of the proposed method, encrypted images were evaluated using different performance measurements, such as the correlation of neighboring pixels, the histogram, and information entropy. By analyzing the obtained results, the proposed method proved its effectiveness in securing the transmission of the encrypted images against statistical attacks.