
1 Introduction
Plants are an essential part of nature and a source of food for a wide range of animals, including humans. They are often characterized by having leaves, stems, roots, and seed-producing capabilities [1]. In particular, the outward appearance of plant leaves is a source of vital information towards ascertaining the wellbeing and productivity of a plant [2]. Thus, developing methods to effectively segment a single plant leaf from a complex background of other leaves is an important step toward the realization of improved precision agricultural systems. For example, the segmentation of a single leaf is important for conducting detailed plant analysis, recognition of crop species, detection and identification of crop
diseases, weed detection, plant growth assessment and monitoring diverse plant conditions to improve agricultural productivity and yield [2,3]. The segmentation process involves separating the leaf region of a plant or an entire individual leaf from an image with a complex background with similar textures, colors and shapes. Such an image processing task is a non-trivial requirement in identifying plant leaves [4,5]. Several approaches for plant leaf segmentation have been reported in the literature, including threshold based techniques, an edge-detection based approach, a K-means clustering technique, a region based technique, a random Markov field technique and an artificial neural network-based approach [1,6-8]. However, very few of these approaches are successful in separating an overlapping leaf from its complex background. For example, in [9] a model for plant leaf segmentation based on mean-shift color segmentation is proposed. Similarly, an approach for segmenting leaf images based on modeling the continuous edges of leaf shapes is reported in [10]. Ref. [11] presents an adaptive K-mean clustering technique for extracting tomato leaf images. A similar model forsegmenting cotton leaves based on improved watershed algorithm is presented in [12].
An approach based on the combination of local and global information of plant leaf images using an improved Chan-Vese model for the segmentation process is proposed in [13]. The simulation results showed promising performance in extracting a single plant leaf from an image. Similarly, an approach for leaf segmentation based on a parametric active polygon model is reported in [14]. However, these approaches are mostly used for segmenting a single leaf placed on a plain background, for a single leaf placed at the center of an image or for leaves with a plant stem near the center of the image [15]. In real-life applications leaves are situated against different backgrounds and may occur anywhere in the image. Thus, the aforementioned approaches may not be effective enough to segment an individual leaf from an overlapping and complex environmental background [15,16]. These complex natural backgrounds and the uncertainties of overlapping conditions of leaf surroundings make segmentation a difficult task [4]. In this regard, a number of segmentation techniques have been proposed, including a 3D leaf segmentation technique for extracting a single leaf from a heavy overlapping background based on mean shift clustering and an active contour model [16]. Similarly, an approach for segmenting overlapping leaves from a complex background image is proposed in [4,17]. However, a major limitation of most reported approaches is the high computational time requirement, the large datasets needed for training, and poor performance as a consequence of under- or over-segmentation of images with overlapping leaves.
An adaptive threshold algorithm that can automatically extract a single leaf from an overlapping background of leaves that were randomly taken from an online video stream is reported in [18]. The target leaf is segmented from its complex
background by Otsu's method and Canny operators. Thus, smooth, clear and accurate edges of the target leaf are obtained. Similarly, a study based on the challenges of the identification of single leaves in complex backgrounds is presented in [19]. The tangential direction (TD) segmentation approach is used to retrieve the leaf skeleton in the image and to determine the distribution of the leaf based on the number of pixels and its relative moment. The leaf's skeleton is based on the main skeleton and the branch skeleton. The proposed technique is capable of automatically detecting and recognizing leaves. Also, the system is adaptable to complicated crop images and real-time applications. The results obtained showed that the proposed approach was able to recognize an individual leaf and determine the leaf distribution in a complex image background. However, the developed system was unable to fully extract a single leaf from cropped occluded horticultural images.
Similarly, a popular approach for the segmentation of overlapping cucumber leaves from complex backgrounds using the Chan Vese (CV) model and the improved Sobel operator (SO), referred to as the Chan-Vese model and Sobel operator (CV-SO) algorithm, is proposed in [17]. The CV-SO algorithm uses only the image color, gradient information, and shape to effectively segment an overlapping leaf from a complex background in an image. The contours and edges of the leaves are extracted and fused together to obtain the target leaf. The experimental results demonstrated better performance compared to other similar approaches. However, the proposed approach is not fully autonomous as it involves the manual tuning and setting of a length penalty parameter value required to extract the contours of the leaves, which affects its performance.
Thus, the present paper proposes an approach that involves the development of a dynamic iterative model for the CV-SO algorithm towards improving its detection performance. This hybrid approach involves the removal of non-green leafy regions in the image in order to extract the contours of a single leaf using a dynamic iterative CV model. Thus, the extracted edges of the leaves based on the Sobel operator are obtained. The resulted contours and edges are fused together to obtain the target leaf. This proposed technique ensures a user-free interaction algorithm.
The rest of this article is structured as follows: Section 2 presents the proposed research methodology, the results and discussion are presented in Section 3 and conclusions are drawn in Section 4.
2 Proposed Methodology
This section presents the proposed automatic dynamic iterative Chan-Vese and Sobel Operator segmentation of a single leaf from images with a complex
background. A 64-bit, Core i5, 7<sup>th</sup> generation desktop system was used to implement the proposed algorithm in MATLAB and for simulations purposes. The overall process to demonstrate our approach is summarized in the block diagram in Figure 1, with an explanation of each block.
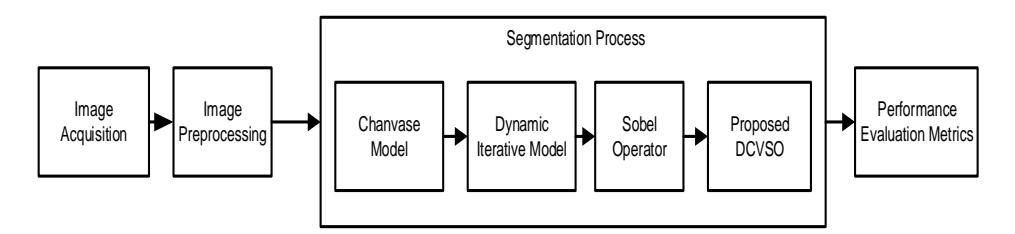
Figure 1 Proposed Dynamic CV-SO for automatic leaf segmentation.
2.1 Image Acquisition
In this section we provide details of the images used to conduct the experiments reported in this article. The image acquisition process was divided into two phases: the first phase comprised downloading images with an image resolution pixels 2000 2000 from an online about X http://www.agronet.com.cn and http://www.garden.org. The second phase entailed the real-time acquisition of images with cucumber leaves under natural atmospheric conditions in a local farmland using a Nikon D40 digital camera. These images were used to test the robustness and performance of the algorithm under different illumination conditions.
2.2 Image Preprocessing
The next stage of our methodology involved the processing of the input images, by resizing the input image to a size of 200 x 200 pixels with a resolution of 750 x 520 toward the segmentation process. Furthermore, the complexity of the background image was reduced by eliminating multiple objects other than the green leaves in the captured images. These included stems, cereals, roots, soil, petals and water pipes as part of the environment in which the images were captured. These non-leaf regions [2] were removed using an RGB color space model [20]. The green channel level in the model was used to effectively remove pixels that were not regarded as part of a leaf region.
2.3 Segmentation Algorithm
This section presents the proposed DCV-SO algorithm for segmenting a leaf from a complex background. The proposed DCV-SO algorithm is an improved variant of the CV-SO method, with incorporation of a design iterative function to eliminate the need for manual length penalty tuning as required in the original CV-SO algorithm from [17]. This makes the segmentation process of the overlapping leaves automatic. The proposed DCV-SO algorithm involves color feature extraction of the interested image from a complex background. A design dynamic iterative model was incorporated into the CV-SO model for the extraction of contours and edges of the leaf of interest. The contours and edges of the extracted leaf are fused together to extract the target leaf. Each stage of the algorithm is discussed in the following subsections.
2.3.1 Chan-Vese Model
The Chan-Vese (CV) model is a region-based segmentation technique. The model is robust to noise and does not depend on the image edges to stop evolving the curve around the desired contours [21]. The basic idea of the CV model is to look for an optimal contour C that divides the image I(x, y) into two separate sub-regions representing the target object [22] and the background region respectively [23]. The result of CV segmentation method consists of the general outline region of the target object including the contours of an overlapped leaf [24]. The output image of the preprocessing stage is fed as input I(x, y) into the CV model in the image domain Ω.
Figure 2 Preprocessed cucumber leaf image.
Let Ω be a bounded open set in 2 , with as its dynamic boundary. The preprocessed image is I(x, y) : , as shown in Figure 2. C is a piecewise parameterized curve whose mathematical structure is represented in Eq. (3). Let
\(\Omega_1\) and \(\Omega_2\) be the regions inside and outside C, respectively. Therefore, \(c_1\) and \(c_2\) are the average intensity inside and outside curve.
\[E(c_1, c_2, C) = \lambda_1 \int_{\Omega_1} |I(x, y) - c_1|^2 dxdy + \lambda_2 \int_{\Omega_2} |I(x, y) - c_2|^2 dxdy\] [3] where C is the curve, and \(\lambda_1\) and \(\lambda_2\) are fixed parameters. The CV model has some regularizing terms such as the length of the closed curve C and the area inside curve C, which controls the boundary smoothness [23]. Therefore, the energy function is defined as
\[E(c_{1},c_{2},C) = u.Length(C) + v.Area(C) + \lambda_{1} \int_{\Omega_{1}} |I(x,y) - c_{1}|^{2} dx + \lambda_{2} \int_{\Omega_{2}} |I(x,y) - c_{2}|^{2} dxdy\] (2)
where \(\mu\) and \(\nu\) are the length and area penalty, respectively. C is represented by a level set, hence C is the zero level set of the Lipschitz function \(\phi(x, y)\). We substitute the variable C by the variable \(\phi(x, y)\). Therefore, the energy function \(E(c_1, c_2, C)\) can be expressed as
\[E(c_{1},c_{2}, \phi) = \lambda_{1} \int_{\Omega} |I(\mathbf{x}, \mathbf{y}) - c_{1}|^{2} H(\phi(x, y) dx dy + \lambda_{2} \int_{\Omega} |I(\mathbf{x}, \mathbf{y}) - c_{2}|^{2} (1 - H(\phi(x, y)) dx dy + \mu \int_{\Omega} \delta(\phi(x, y)) |\nabla \phi(x, y)| dx dy + \nu \int_{\Omega} H(\phi(\mathbf{x}, \mathbf{y})) dx dy\] (3)
where \(H(\phi)\) represents the Heaviside function and \(\delta(\phi)\) is the Dirac function, as shown in Eqs. (4) and (5):
\[H(\phi) = \frac{1}{2} \left[ 1 + \frac{2}{\pi} \arctan\left(\frac{\phi}{\varepsilon}\right) \right] \tag{4}\]
\[\delta(\phi) = \frac{1}{\pi} \cdot \frac{\varepsilon}{\varepsilon^2 + \phi^2} \tag{5}\]
By setting \(\varepsilon = 1\), the energy function is minimized to \(\mathrm{E}(c_1, c_2, \phi)\) with respect to zero-level set \(\phi(x, y)\), using the Euler-Lagrange equation and the gradient descent method for \(\phi(x, y)\). The equivalent variational level set gradient descent formulation [23] is expressed in Eq. (6).
\[\frac{\partial \phi}{\partial t} = \delta(\phi) \left\{ \mu. \operatorname{div} \left( \frac{\nabla \phi}{|\nabla \phi|} \right) - \upsilon - \lambda_1 \left[ I(x, y) - c_1 \right]^2 + \lambda_2 \left[ I(x, y) - c_2 \right]^2 \right\}\] (6)
\[c_{1} = \frac{\int_{\Omega} I(x, y) H(\phi(x, y)) dx dy}{\int_{\Omega} H(\phi(x, y)) dx dy}\] \[c_{2} = \frac{\int_{\Omega} I(x, y) [1 - H(\phi(x, y))] dx}{\int_{\Omega} [1 - H(\phi(x, y))] dx}\] \[\phi(x, y, 0) = \phi(x, y)\]
The default parameters values are \(\lambda_1 = \lambda_2 = 1\), \(\nu = 1\) and \(\Delta t = 0.1\). Thus, Eq. (6) provides the CV model for extracting the contours of the leaf region by using the gradient information to control the deformation movement and the evolution of the contour curve. Eq. (6) is used for segmentation of leaf images based on the gradient information to regulate the deformation and the evolution of the contour curve [17].
2.3.2 Dynamic Iterative Model
The dynamic iterative model is proposed to automatically determine the optimal value of the length-penalty parameter. Thus, we avoid the manual parameter tuning approach used in the original CV-SO algorithm [17]. Our function was formulated based on the effect of the length-penalty parameter in the CV model, which is the range within which the threshold value is determined. The length-penalty parameter is determined by computing the mean and standard deviation of the CV model linearly and exponentially as shown in Figure 3.
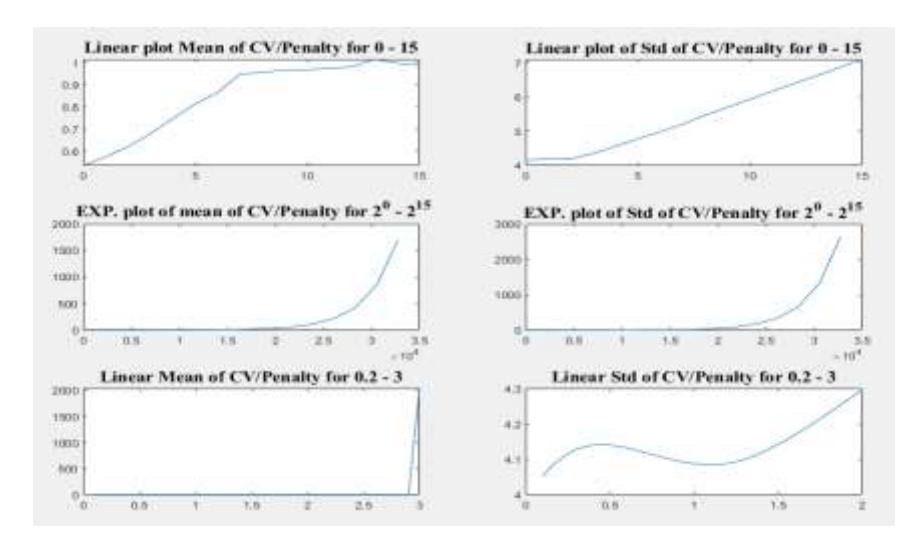
Figure 3 The graph of the mean and standard deviation for linear and exponential values of the length-penalty parameter.
A graphical representation of both the linear and exponential effect of the length penalty values is used to determine the maximum and minimum range of the threshold value in Eq. (7). The penalty value can then be computed using Eq. (8).
\[\alpha_{min} \le \beta \le \alpha_{max}\] \[\beta = \alpha_{min} + r(\alpha_{min} - \alpha_{max})\] (7)
where \(\alpha_{min}\) and \(\alpha_{max}\) are the minimum and maximum range of the length penalty, respectively, and \(\beta\) is the value selected between the inequalities.
\[\mu = e^{\beta} \tag{8}\] where \(\mu\) is the optimal dynamic length penalty parameter incorporated into the CV model for a smoother and accurate segmentation of the leaf contours.
2.3.3 Sobel Edge Detection Operator
The traditional Sobel operator (SO) is a first-order differential operator for identifying the edges of an image in a horizontal and vertical direction template of a 3 x 3 neighborhood [25]. The Sobel operator is utilized to detect the edges of leaf image I(x, y). The gradient of a given gray-scale image I(x, y), is expressed in Eq. (9).
\[g(\mathbf{x}, \mathbf{y}) = \left[ \frac{\partial I}{\partial x}, \frac{\partial I}{\partial y} \right]^{T} = \left| g_{x}, g_{y} \right|\] (9)
The magnitude and angle of direction are computed using Eqs. (10) and (11), respectively.
\[mag(\nabla g) = \left| \nabla g \right| = \left\lceil g_x^2 g_y^2 \right\rceil^{\frac{1}{2}} \tag{10}\]
\[\phi(\mathbf{x}, \mathbf{y}) = \arctan\left(\frac{g_x}{g_y}\right) \tag{11}\]
The edges of the target leaf and the underlying leaves can be unclear and discontinuous when using the traditional Sobel operator to detect the edges. Therefore, an improved SO is utilized to clearly detect the edges of the leaves by adding a six-direction template in addition to the two traditional Sobel operators. The 8 directions of the gradient operator used are \(0^{\circ}\), \(22.5^{\circ}\), \(45^{\circ}\), \(67.5^{\circ}\), \(90^{\circ}\), \(112.5^{\circ}\), \(135^{\circ}\) and \(157.5^{\circ}\). The weight matrices of the 8 directions were calculated using Pascal triangle correlation theory [26]. The direction templates of the 5 x 5 weight matrix that defines the edges are shown in Figure 4 and their respective directions from 1 to 8 are shown in Figure 4. The improved Sobel operator
accurately detects the edges of leaves in an image in multiple directions using Eq. (9) based on the template of the 8 directions in Figure 5.
\[\begin{pmatrix} 1 & 4 & 6 & 4 & 1 \\ 2 & 8 & 12 & 8 & 2 \\ 0 & 0 & 0 & 0 & 0 \\ -2 & -8 & -12 & -8 & -2 \\ -1 & -4 & -6 & -4 & -1 \end{pmatrix} \begin{pmatrix} 4 & 6 & 4 & 1 & 2 \\ 1 & 12 & 12 & 8 & 0 \\ 2 & 8 & 0 & -8 & -2 \\ 0 & -8 & -12 & -12 & -1 \\ -2 & -1 & -4 & -6 & -4 \end{pmatrix} \begin{pmatrix} 6 & 4 & 1 & 2 & 0 \\ 4 & 12 & 8 & 0 & -2 \\ 1 & 8 & 0 & -8 & -1 \\ 2 & 0 & -8 & -12 & -4 \\ 0 & -2 & -1 & -4 & -6 \end{pmatrix} \begin{pmatrix} 4 & 1 & 2 & 0 & -2 \\ 6 & 12 & 8 & -8 & -1 \\ 4 & 12 & 0 & -12 & -4 \\ 1 & 8 & -8 & -12 & -6 \\ 2 & 0 & -2 & -1 & -4 \end{pmatrix}\] (a) \(0^{\circ}\) (b) \(22.5^{\circ}\) (c) \(45^{\circ}\) (d) \(67.5^{\circ}\) (d) \(67.5^{\circ}\) (1) \(2 \cdot 0 \cdot 0 \cdot 0 \cdot 0 \cdot 0 \cdot 0 \cdot 0 \cdot 0 \cdot 0\) (e) \(90^{\circ}\) (f) \(112.5^{\circ}\) (g) \(135^{\circ}\) (g) \(135^{\circ}\) (h) \(157.5^{\circ}\)
Figure 4 The weight matrix templates of the 8 directions [17].
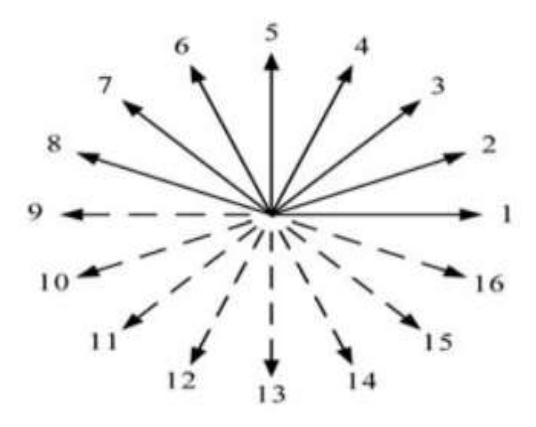
Figure 5 The 8 directions of the improved Sobel operator [26].
2.3.4 Performance Evaluation Metrics
The performance of the developed DCV-SO algorithm for automatic segmentation of the overlapping leaves was evaluated by computing the false negative rate (FNR), the false positive rate (FPR), and the error rate (ER). These metrics were compared against the corresponding values from the original CV-SO algorithm [17].
The accuracy of the proposed DCV-SO algorithm was measured by comparing manually segmented cucumber leaf images using the CV-SO algorithm with images segmented automatically using the DCV-SO algorithm. Pixels
categorized as target leaf area (TLA) were classified as one (1) [22], and pixels categorized as non-target leaf area (NTLA) pixels were labeled zero (0).
| Positive | Negative | |||
|---|---|---|---|---|
| TLA | True Positive TP | False Positive FP | ||
| NTLA | False Negative FN | True Negative TN | ||
Figure 6 Confusion matrix.
The performance of the proposed DCV-SO was evaluated using the receiver operating characteristic (ROC) curve [27]. Pixels correctly classified as actual target leaf region were defined as true positive (TP). Pixels classified as 1 that were in a non-target leaf region were defined as false positive (FP). If a non-target leaf pixel was detected in a non-target leaf region, it was classified as true negative (TN) [28] and pixels of the target leaf misclassified as being in a non-target region are referred to false negative (FN). The FN rate (FNR), FP rate (FPR), and error rate (ER) were computed using Eqs. (12)-(14), respectively. The confusion matrix used is shown in Figure 6.
\[FNR = \frac{FN}{TP + FN} \tag{12}\]
\[FPR = \frac{FP}{\text{TN} + FP} \tag{13}\]
\[ER = \frac{FN + FP}{TP + TN + FN + FP} \tag{14}\]
3 Result and Discussions
The experimental results of segmentation obtained by the proposed DCV-SO are presented in Subsection 3.1. The performance of the proposed algorithm (DCV-SO) was compared to the CV-SO reported by [17].
3.1 Results of Segmentation
This section presents the output of the cucumber leaf segmentation process. The input image is shown in Figure 7(a). It can be observed in Figure 7(b) that nongreen pixels in the background, representing objects such as soil, stems and water pipes, were removed from the input image. The output of this process was fed into the DCV model, whose output is shown in Figure 7(c). We note that the obtained result was not satisfactory due to a number of false contours obtained in the underlying layer as a result of leaf overlap.
The improved Sobel operator was then able to clearly and continuously detect the edges of the target leaf (see Figure 7(d)) by aiding the contour detection of the target leaf. Hence, accurate segmentation of the cucumber leaf was obtained using the fusion of the DCV and SO methods as shown in Figure 7(e).
The labeling of the segmented results is shown in Figure 7(f). We note generally that the overlapping cucumber leaf (see Figure 7(a)) was effectively segmented from other background regions after the fusion of the output of the proposed DCV and the SO process as shown in Figure 7(e).
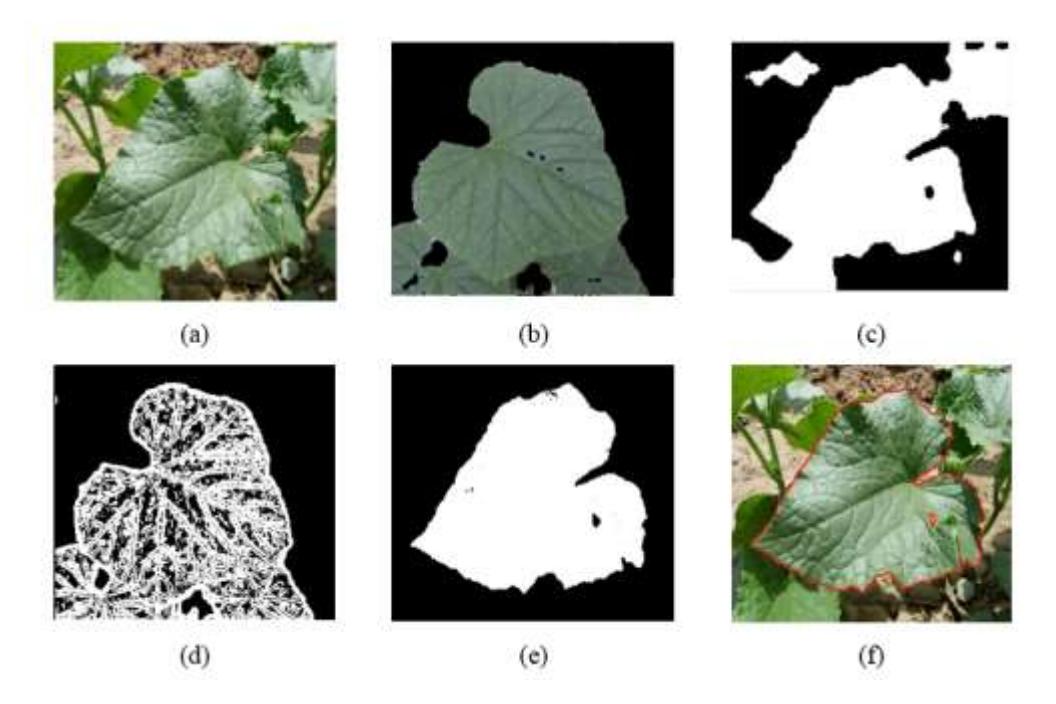
Figure 7 Segmentation results of cucumber leaf segmentation: (a) original leaf image, (b) result of background removal, (c) result of the DCV model, (d) result of SO, (e) segmentation result fusion, (f) segmentation result labeling.
In Figure 8, we present images of a typical segmentation process using the proposed DCV-SO and the CV-SO approaches. We note that the edges and contours of the leaves were accurately and smoothly segmented by DCV-SO, as shown by the red contours (see Figure 8(c)), when compared to CV-SO (see Figure 8(b)). This may be attributed to the iterative dynamic length penalty
incorporated in DCV-SO. Thus, the DCV-SO model fits the single cucumber leaf image more accurately and produces a smoother boundary of the target leaf.
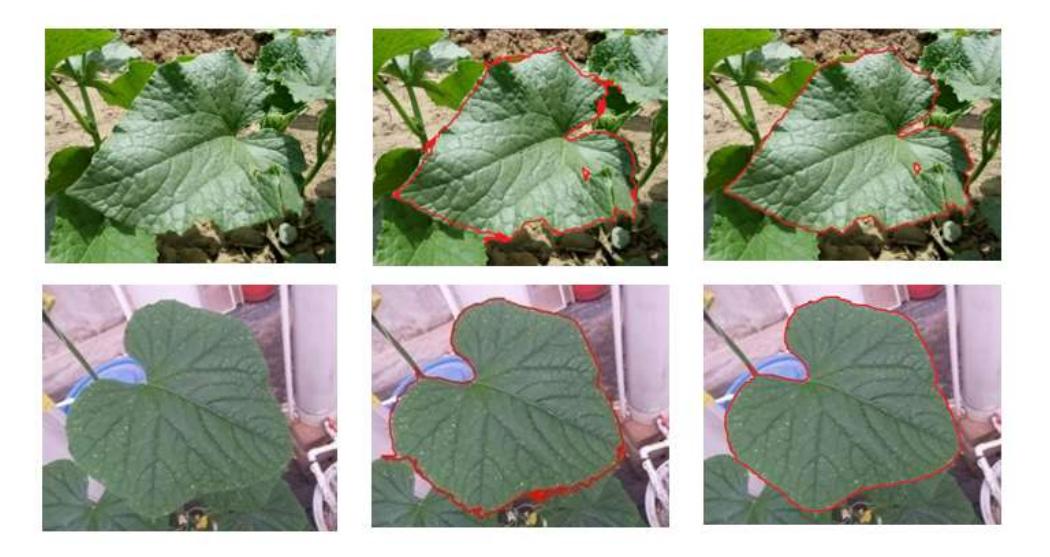
Figure 8 Two comparison groups of segmentation results for the CV-SO and DCV-SO methods: (a) original images of the leaves, (b) results of CV-SO segmentation algorithm, (c) results of the proposed DCV-SO segmentation algorithm.
3.2 Comparison and Analysis of the Segmentation Methods
The performance of the proposed DCV-SO approach was compared to that of the CV-SO algorithm. The color features of the leaves were extracted, such that all other pixels that were non-leaf pixels were set as background (0); then the proposed DCV-SO and the CV-SO technique were applied to the output image after the background removal process had been conducted.
The segmentation performance of the algorithm was evaluated using ER, FNR and FPR. The simulation results show that the proposed DCV-SO algorithm recorded a lower ER value of about 0.0476 compared to CV-SO, which produced an ER value of 0.0575 for the first group of input images (obtained from the online database http://www.agronet.com.cn/ and http://www.garden.org).
A similar ER trend was observed for the second group of input images obtained from real field image acquisition on farmland (local images), with a value of 0.0382 for the DCV-SO method compared to 0.0530 for CV-SO method (see Table 1).
Similarly, the FPR of the CV-SO method was found to be higher than that of the proposed DCV-SO method for both datasets (see Table 1), which implies that DCV-SO performed better than CV-SO. This may be attributed to the incorporation of the iterative length penalty, which aided in obtaining a smoother and more accurate segmentation of the leaf contours. We found the FNR of DCV-SO to be higher than that of CV-SO because the proposed method could accurately and smoothly segment the contours of the leaves.
Table 1 shows the statistics of the segmentation results for both CV-SO and DCV-SO in terms of FNR, FPR and ER. The ER of the proposed technique had lower mean and standard deviation ER values at 0.0429 and 0.0208 compared to 0.0552 and 0.0229 for CV-SO (see Table 2).
Table 1 Comparison of segmentation error rate of CV-SO and DCV-SO.
| Group of comparison | CV-SO | DCV-SO | ||||
|---|---|---|---|---|---|---|
| Experiment | FPR | FNR | ER | FPR | FNR | ER |
| First Group | 0.0370 | 0.0125 | 0.0575 | 0.0243 | 0.0158 | 0.0476 |
| Second Group | 0.0598 | 0.0244 | 0.0530 | 0.0470 | 0.0321 | 0.0382 |
Table 2 Result of image segmentation using CV-SO and DCV-SO.
| CV-SO | DCV-SO | |||||
|---|---|---|---|---|---|---|
| FPR | FNR | ER | FPR | FNR | ER | |
| Mean | 0.0484 | 0.0185 | 0.0552 | 0.0356 | 0.0239 | 0.0429 |
| Standard Deviation | 0.0269 | 0.0153 | 0.0229 | 0.0237 | 0.0169 | 0.0208 |
In this regard the proposed DCV-SO method achieved better segmentation performance compared with the CV-SO algorithm. The segmentation results of DCV-SO had a 1.23% decrease in mean error rate as compared to CV-SO. The relationship between the automatic segmentation methods for each of the 40 cucumber leaves is presented here in terms of FNR, FPR, and ER, as shown in Figure 9.
The red bars indicate leaves that were segmented with the proposed DCV-SO technique, while the blue bars represent the CV-SO technique. We observed that the proposed DCV-SO method achieved lower ER compared to the CV-SO algorithm, with a similar trend observed for the FPR for the individual input images, however, with a higher FNR compared to the CV-SO algorithm. This improved performance may be attributed to the incorporation of the iterative length penalty in the proposed DCV-SO method. Thus, the proposed DCV-SO approach produced a better segmentation output compared to the CV-SO method.
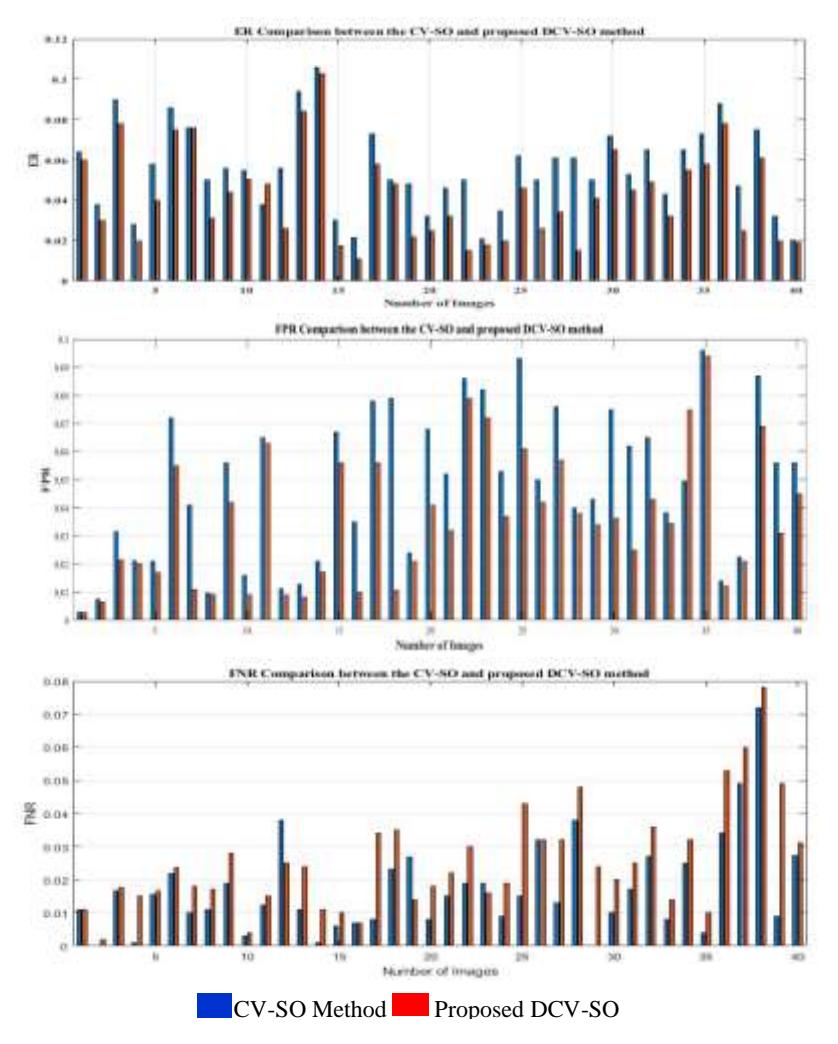
Figure 9 Comparison of the segmentation methods applied to 40 cucumber leaf images in terms of ER, FPR, and FNR. The red bars represent the leaves segmented with DCV-SO and the blue bars represent those segmented with CV-SO.
4 Conclusion
This paper presented a hybrid approach for the automatic segmentation of single leaves from an image with overlapping leaves using the new automatic DCV-SO segmentation method. Our proposed approach uses the green channel in the RGB color space to remove non-green regions from the image. A dynamic iterative function was developed and incorporated into the CV model to automate the tuning process of the length-penalty parameter for smooth segmentation of the leaf contours. The edges of the leaves are also extracted using the improved Sobel edge detection operator. The extracted contours and edges of the leaves are combined to obtain the target leaf. The results obtained in the experiment proved that the proposed DCV-SO technique could successfully segment a single individual leaf from an image with overlapping leaves with a high level of accuracy and low mean error rates. Future works will focus on developing an algorithm that can segment leaves of different shapes and agricultural-based systems for improved and accurate discharge of targeted plants.