
1 Introduction
The presence of social media makes it easier for people to communicate and exchange messages with anyone online without being separated by distance. The increasing popularity of social media sites such as Facebook, Twitter, and Instagram follows from the growing number of Internet users who can access information from around the world. Information spread on social media can be viral if it attracts the attention of the general public. Meanwhile, the rapid development of social media also impacts the increasing amount of hate speech aimed at certain people or groups. Hate speech is an act of communication by a particular person or group that aims to insult a person or a group based on their ethnicity, race, religion, gender, sexual orientation, or class [1]. Social media users are given the freedom to express their respective opinions through social media, which makes the amount of hate speech appear to be out of control [2]. The emergence of hate speech in social media is prominent during important events in the community, such as elections or other events involving the current
political situation. A lot of content on social media is unreliable due to false or misleading content (such as fake news), which can lead to the rise of harmful comments based on wrong information [3,4]. Handling hate speech on social media is difficult to do manually, given the large amount of content published on social media every day.
Various studies on the classification of hate speech in social media have been done, but most of them focused on how to classify hate speech in English texts [5-8]. These works mainly used baseline models such as Naïve Bayes, SVM, BLR, and RFDT [6]. The proposed baseline models utilized bag of words method such as TF-IDF features [1], n-gram, and sentiment features [3] for feature extraction. Up until now very few researches have been done on hate speech classification using the Indonesian language [8-10].
Recently, text classification models have been shifting towards deep learning models, such as CNN [4,11,12], RNN [13], GRU [10], LSTM and BiLSTM [14]. The Convolutional Neural Network (CNN) method is generally used in digital image processing but this does not rule out the possibility to use it in text processing [11]. A CNN model trained with word vectors extracted from various features can be utilized for hate speech detection [7,15].
We propose a CNN method for hate speech classification in Indonesian language tweets. This paper consists of the following 5 sections. Section 2 describes related works in text classification and hate speech detection studies. Section 3 describes our proposed method for hate speech classification. The results of the conducted experiment are discussed in Section 4. Finally, Section 5 contains our conclusions from the experimental results.
2 Related Works
Some researchers have studied various methods related to hate speech classification. Gitari, et al. [16] built lexicons for classification of hate speech from sentiment expressions in a document. Burnap and Williams [6] proved that typed dependency n-grams reduced the number of false positives of supervised classifiers such as BLR, RFDT, SVM, and Voting Ensemble with Max Probability to classify hate speech focused on race, religion, and ethnicity. Similarly, Watanabe, et al. [17] proposed a hate speech feature extraction approach to generate sentiment-based features, unigram features, semantic features, and sentence pattern features that gained 87.4% accuracy. McAvaney, et al. [2] proposed a simpler multi-view SVM hate speech detection method and also addressed misclassification of less hateful aggressive posts. Wadera, et al. [18] showed a comparison of NB, Decision Tree, RFDT, and KNN based sentiment analysis on a dynamic database of tweets.
Term weighting methods for feature extraction have been studied in various researches on text processing in both the English and the Indonesian language. Alsmadi and Goon [19] proposed a supervised approach for term weighting in short-text classification based on term strength and term distribution. Widyasanti, et al. [20] utilized TF-IDF weighting for text summarization.
While many researchers have proposed methods for English language hate speech, very few researches have been done on hate speech classification in the Indonesian language. Alfina, et al. [8] generated a new dataset for hate speech in the Indonesian language and classified it with the NB, SVM, BLR, and RFDT algorithms. Fauzi and Yuniarti [1] used Soft Voting and Hard Voting Ensemble methods to classify hate speech in Indonesian language texts. Ibrohim and Budi [9] tested NB, SVM, and RFDT methods with simple word n-gram and character n-gram features to detect abusive language in Indonesian social media. Indonesian swear words usually come from animals, conditions, objects, or professions in a derogatory context. Detecting abusive words in the Indonesian language is tricky because Indonesian netizens often use swear words from foreign languages and their local language, and sometimes they repeat several characters or remove vowels while typing to avoid exceeding character limits. Patihullah and Winarko [10] proposed a combination of word2vec and Gated Recurrent Unit (GRU) for Indonesian hate speech detection that performed better than traditional supervised learning methods, however the word2vec feature performed poorly when compared to the TF-IDF feature.
Recent studies were focused on deep learning architectures for text classification, specifically sentiment analysis. Gambäck and Sikdar [7] discussed the classification of hateful texts with CNN. Feature extraction was done using word2vec, random vector, and n-gram character. The word2vec model without n-gram characters gave the best results with 86.6% precision, recall of 72.4%, and F1-score of 78%. Chen, et al. [21] proposed a CNN method with twodimensional TF-IDF extraction to classify aggressive texts. Hassan and Mahmood [11] proposed a joint CNN and RNN deep learning model for sentence classification. This model utilized RNN as an alternative to using a pooling layer and achieved an accuracy of 93.2% for the IMDB dataset and 89.2% for the Stanford Sentiment Treebank (SSTb) dataset. Jianqiang, et al. [15] indicated that their GloVe-DCNN model outperformed bag of words models by capturing context more efficiently while remembering the word order. Yang and Yang [22] proposed a Modified Convolutional Neural Network (MCNN) with stochastic gradient descent (SGD) as a dropout layer in the output layer to avoid overfitting. MCNN-DS achieved recognition levels as high as 99.97%. Agarwal, et al. [13] proposed 4 different variants of RNN (GRNN, LRNN, GLRNN and UGRNN) to perform multimodal sentiment analysis including text, video, and audio. Bisht, et
al. [14] attained an accuracy of 86% by performing hate speech classification on a three-layer LSTM/Bi-LSTM model.
In relation to the spike of hate speech, false information detection has also become a focus of research. Vishwakarma, et al. [4] proposed a novel algorithm based on a reality parameter to classify fake news images/text. Malhotra and Vishwakarma [12] leveraged Graphical Convolutional Networks with RoBERTa based encodings for rumor detection that outperformed tree structured RNN and CNN & RNN propagation path.
3 Research Method
The model proposed in this paper consists of two processes, as illustrated in Figure 1, namely a training process and a testing process. The training process is the process of generating a CNN training model used for fitting to a training dataset. The testing process is the process of evaluating the performance of the generated training model by fitting it to a separate dataset.
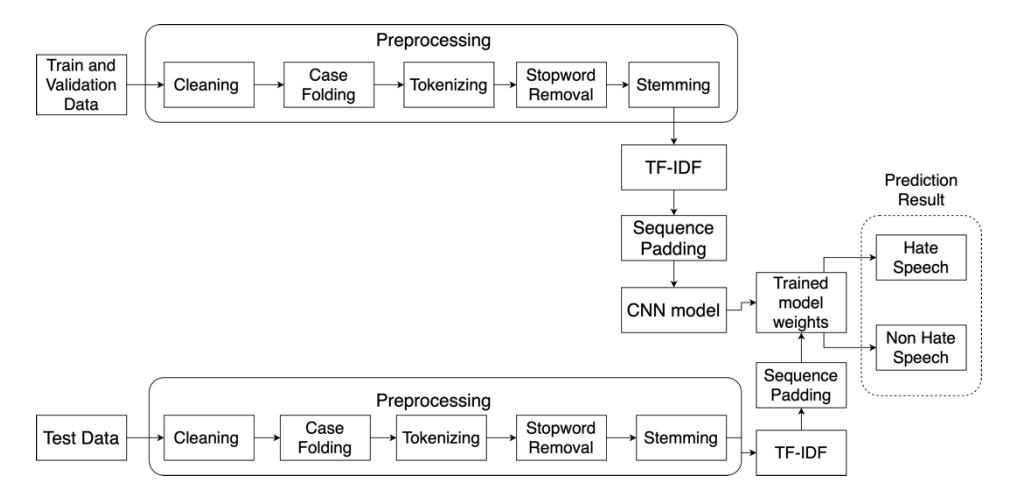
Figure 1 Proposed hate speech classification model.
3.1 Data Acquisition
Data acquisition is the process of collecting the text data that will be used in the classification process. All the data used in this paper were acquired from Twitter using the Twitter Streaming API [3,18]. We constructed a Python script using the Tweepy library in order to utilize the Twitter Streaming API for scraping tweets automatically based on keywords/hashtags and the date range of the tweet posts [23]. Batches of tweets collected in this process were saved into a JSON file, after which they were labeled manually.
3.2 Preprocessing
Preprocessing is the stage of preparing unstructured data as the result of data acquisition to become ready-to-process data [20]. This process is done to gain better data quality and improve the classification accuracy. In the preprocessing stage a few steps have to be conducted: cleaning, case folding, tokenization, stopword removal, and stemming.
Cleaning is the process of removing unimportant characters in the dataset [23]. This process includes the removal of punctuation and special characters that are usually found on Twitter (such as retweet/RT, username, and hashtag), URLs, and Unicode emojis inside the dataset [10]. Indonesian slang words and informal abbreviations found in the dataset were converted into their formal synonyms in this process [24]. We built a dictionary of 4423 commonly used Indonesian slang words and possible word misspellings paired with their corresponding standard words. Each word in the text dataset was checked to see if it matched with words in the slang word dictionary. The slang word or misspelled word was then replaced with the formal version of the word if it was found in the slang word dictionary.
Case folding or lowercasing is the process of converting all characters from the clean text dataset into lowercase [10]. This process is done to avoid errors towards identifying a specific term in the dataset [25].
Tokenization is the process of splitting sentences from the text dataset into tokens (words) [26]. Spaces serve as delimiters in the tokenizing process [27]. This process is done by implementing the word_tokenize function from NLTK library for Python.
Stopword removal is the process of eliminating words from the dataset that have a relatively large prevalence and are considered unnecessary [10]. The collection of stopwords to be used was collected in a stoplist. Each token in the dataset will be matched with the stoplist and a word will be removed if it matches a stopword included in the stoplist. In this paper, the stoplist used was based on the Tala stoplist dictionary provided by NLTK library for Python [1].
Stemming is the process of returning derivative words into their original form [20]. This process is done by eliminating the affix (prefix, suffix, or infix) of derivative words in the text. We used Sastrawi library for Python to omit affixes from Indonesian language words and return the words into the base word list [27]. The algorithm implemented in Sastrawi library is based on the Nazrief-Adriel algorithm, which was later improved with the ECS (Enhanced Confix Stripping) algorithm [26,27].
3.3 TF-IDF Feature Extraction
The TF-IDF (term frequency-inverse Document Frequency) method is used to represent the features of a text dataset [18]. The TF-IDF method is a combination of TF (Term Frequency) and IDF (Inverse Document Frequency). TF-IDF forms a vector between a document and the terms contained in it [9,10,20]. TF is the number of times a term appears in a document. The term with the highest frequency is a good representation of a category [19]. The term frequency tf of the ith term in the jth document is calculated by dividing the total frequency of term t in document t with the sum of the term numbers in the document t as shown in Eq. (1).
\[tf_i = \frac{freq_i(d_j)}{\sum_{i=1}^{k} freq_i(d_j)}\] (1)
Inverse Document Frequency (IDF) is a parameter that indicates how many documents contain a particular word [20]. The IDF value of term i is calculated by Eq. (2), where D is the ratio of total number of documents and d is the number of documents containing the i<sup>th</sup> term.
\[idf_i = \log \frac{|D|}{|\{d : t_i \in d\}|} \tag{2}\]
The TF-IDF value is obtained from the result of multiplying the TF value with the IDF value, as shown in Eq. (3) [24]:
\[(tf - idf)_{ii} = tf_i(d_i) * idf_i\] (3)
We used the word n-gram feature model from the clean text to implement the TF-IDF method. Word n-gram is defined as the sequence of words with the amount ranging from 1 to n [6]. The word n-gram features implemented were word unigram (where n=1) and word bigram (where n=2). The maximum number of features picked for the TF-IDF process was set to 1500. The TF-IDF process results in a feature matrix, with the matrix width representing the maximum number of features and the matrix length representing the number of used text datasets. The TF-IDF matrix is then converted into a one-dimensional array before feeding it into the CNN model.
3.4 CNN Model
Convolutional Neural Network (CNN) is a multilayer perceptron model that utilizes convolution operations [22]. The CNN method was originally developed for image recognition and was proven to provide very accurate results [11].
Figure 2 CNN hate speech classifier.
Figure 2 describes an overview of the hate speech classification system's architecture. The sentences matrix generated from the TF-IDF process is used as input for the one-dimensional convolutional layer in the CNN architecture [21]. We set 16 filters for the first convolutional layer with a size of 3 for each filter. A max pooling layer with a size of 3 reduces the dimensionality of the convolution result without feature loss. Another one-dimensional convolutional layer with 8 filters is applied to the first max pooling result, where each filter has a size of 3 and between the ReLU and the sigmoid dense layer, followed by another max pooling layer with a size of 3. The flattened layer comes after the second max pooling layer, followed by a fully connected layer that consists of dense ReLU and sigmoid activation function layers. Dropout layers are applied after each max pooling layer and after the dense ReLU layer. We used dropout rates of 0.5 for the first dropout layer, 0.4 for the second dropout layer, and 0.5 for the third dropout layer. The output layer provides predicted values for each category from the CNN input. The trained CNN model was saved into a .h5 file to be used in the testing process.
Inside the convolution layer, a filter is applied repeatedly to the input [7]. The filter provided is a kernel that moves from the upper left corner of the matrix until it reaches the lower right corner of the matrix. The kernel maps the input features and feeds the feature map (as the convolution result) to the pooling layer. However, the TF-IDF matrix as input of the convolution layer consists of onedimensional sequences of data. The kernel in the one-dimensional convolution layer slides along sequence by sequence in one direction. Together with the convolution layer, ReLU (Rectification Linear Unit) is used as a nonlinear activation function. ReLU has the benefit of having low complexity in computation, since the ReLU function sets the threshold to 0 [21].
Pooling or subsampling is the process of resizing the convolution results. The pooling layer changes all text from the convolution layer into a vector with a fixed length [7]. The max pooling layer used in the CNN architecture divides the output of the convolution layer into several small parts and then takes the largest value from each part. The max pooling layer changes the convolution results to reduce the complexity of the training model and prevent overfitting.
Dropout is a regularization technique that helps reducing overfitting, which is done by temporarily removing or 'dropping' random units from the neural network to reduce calculation. Nodes retained by the dropout layer appear according to a fixed probability. Dropout prevents the neural network to be too reliant on certain neurons and also keeps the training process accurate even if some information is not available [22].
The flattened layer connects the pooling layer with the dense layer by converting the pooled feature matrix into one single vector before feeding it into the fully connected layer [22]
The fully connected layer determines which features are most correlated with a particular class by giving the output of probability for each class based on the input from the flattened pooling layer results. The dense process performs addition of flattened data into the fully connected layer with the ReLU activation function. The sigmoid activation function is applied as a nonlinear function to convert the flattened values into outputs that are mapped in the range between 0 and 1 [22].
\[S(x) = \frac{1}{1 + e^x} \tag{4}\]
The sigmoid activation function as declared in Eq. (4) has a major disadvantage, where the function gradient tends to reach the value 0 when many weight values approach extreme values of 0 and 1. This causes the inability of the neuron to make significant updates, which will result in a less optimal backpropagation process [21]. Despite this disadvantage, the sigmoid function can predict the probability between two classes (that only exist from 0 to 1).
4 Results
This section briefly explains the text dataset used in this research and gives a comprehensive analysis of the results of the conducted experiments.
4.1 Dataset
This research was conducted with a text dataset containing tweets related to two political events, namely the 2017 Jakarta governor election and the 2019 Indonesian presidential election. The majority of tweets used in this dataset were collected from the Twitter Streaming API [18]. Tweets related to the 2017 Jakarta governor election in the training dataset were also taken from the hate speech dataset created by Alfina, et al. [8] with a total of 520 tweets. Each tweet in the dataset was manually labeled into two categories, namely 'HS' for tweets containing hate speech and 'Non_HS' for tweets not containing hate speech. The dataset for training included 630 tweets in each category.
The datasets we used for testing had various numbers of tweets, i.e. 25, 50, 75, 100, 150, and 200 tweets in each category. All the datasets used for training and testing were saved in text (.txt) file format. Table 1 shows an example of the training data before and after preprocessing.
Table 1 Training data example.
| Label | Tweet | Preprocessed (Stemmed) Tweet |
|---|---|---|
| Non_ HS | Bersaudara sebagai sebuah bangsa, lanjutkan pembangunan di Papua. #2019TetapJokowi pic.twitter.com/ | saudara sebuah bangsa lanjut bangun papua |
| pIp42TqCDn | ||
| HS | @WahabisLokal Babi china halu Hidup di indo menjilat kepentingan cukong china | babi china halu hidup indonesia jilat penting cukong china |
4.2 Training Result
The method for hate speech classification in the Indonesian language using CNN was built with Keras (version 2.3.1) library for Python 3.7. The dataset used for training was split into 70% (882 tweets) for the training set and 30% (378 tweets) for the validation set. The experiment was conducted for 10, 15, 20, 50, and 100 epochs. From the experimental results shown in Table 2, the 100th epoch had the highest training accuracy and validation accuracy result. However, the validation loss started to increase gradually after 45 epochs, while the training loss kept decreasing, which caused the model to overfit when trained longer. Both training loss and validation loss by the 50th epoch hit the lowest percentage, respectively 22.51% and 33.07%. The model checkpoint stopped saving at 45 epochs, therefore it achieved the most optimal result at a training accuracy of 90.85%, a training loss of 23.2%, a validation loss of 33.3%, and a validation accuracy of 88.34%.
| Epoch | Accuracy (%) | Loss (%) | Validation Accuracy (%) | Validation Loss (%) |
|---|---|---|---|---|
| 10 | 83.73 | 39.27 | 83.79 | 39.77 |
| 15 | 84.82 | 36.82 | 84.58 | 37.20 |
| 20 | 86.99 | 32.80 | 86.56 | 36.18 |
| 50 | 90.55 | 22.51 | 87.75 | 33.07 |
| 100 | 93.37 | 17.58 | 93.37 | 75.50 |
Table 2 Comparison of accuracy and loss in training and validation.
Figure 3(a) shows that the training accuracy and validation accuracy started to overlap each other around the 12th epoch while both the training and the validation accuracy kept increasing, which shows that the model generalized better towards the training dataset. The validation accuracy was lower than the training accuracy because the validation dataset separated randomly from training dataset had some significant discrepancies in word usage compared to the training dataset.
The training loss according to Figure 3(b) was higher than the validation loss before the validation loss became slightly higher than training loss at the 12th epoch. The use of dropout in the training process affected the higher training loss at the beginning because dropout was active during the training process but deactivated in the validation process. The model had already seen the training dataset when the validation process occurred since the validation dataset was a separate set of the data the model considered as new data. Hence, the model noticed the pattern from the training dataset and started to fit it into the validation data. The ability to generalize the validation set influenced the slight increase of validation loss.
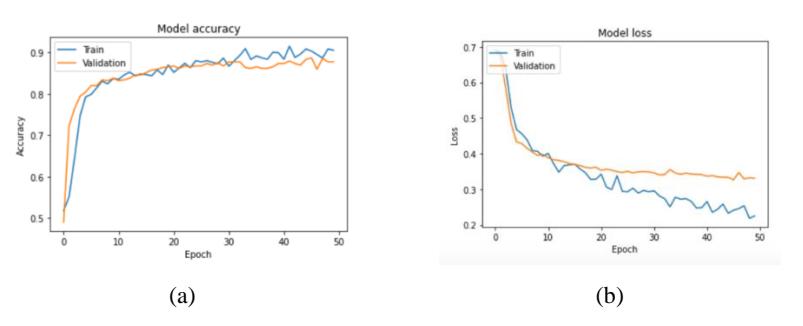
Figure 3 Training and validation: (a) accuracy graph; (b) loss graph for 50 epochs.
4.3 Testing Result
The hate speech datasets used for testing contained derogatory words that were also common in the training dataset. The tweets used in the testing dataset also contained new words that did not exist in the training dataset, especially tweets in the non-hate speech category. The amount of TP (true positive), FP (false positive), FN (false negative), and TN (true negative) in each testing experiment was calculated for different testing datasets. TP results refer to hate speech tweets that were identified by the system as hate speech. FP results refer to non-hate speech tweets that were falsely identified as hate speech. FN results refer to hate speech tweets that were falsely identified as non-hate speech tweets. The comparison of accuracy results is shown in Table 3.
| Table 3 | Comparison of testing accuracy results. |
|---|
| Test Data in Each Class | TP | FP | FN | TN | Accuracy (%) |
|---|---|---|---|---|---|
| 25 | 20 | 4 | 5 | 21 | 81% |
| 50 | 39 | 6 | 11 | 44 | 82.5% |
| 75 | 57 | 10 | 18 | 65 | 81.34% |
| 100 | 77 | 13 | 23 | 87 | 81.75% |
| 150 | 104 | 28 | 46 | 122 | 75% |
| 200 | 143 | 50 | 57 | 150 | 73% |
The highest testing accuracy was achieved with the dataset that used 50 testing data in each class with an accuracy of 82.5%, and the lowest was 73% for 200 testing data in each class. More test data generally provided a more accurate prediction since larger test datasets have more words that are similar to the words used in the training dataset. In spite of the varied accuracy results, testing accuracy percentages were similar for testing sets of 25 to 100 samples per category. Table 4 shows an example of results from the testing dataset, where their predicted labels are compared with their actual labels.
Table 4 Comparison of predicted label and actual label.
| Tweet | Predicted Label | Actual Label |
|---|---|---|
| Prabowo Sandi menguasai masalah, kompak dan saling melengkapi dalam mencari solusinya #MetroTVIndonesiaMemilih #DebatPilpres2019 | Non_HS | Non_HS |
| Siapa saja yg dukung Penista Agama adalah Bajingan yg perlu di ludahi muka nya | HS | HS |
A text can be classified as hate speech from the frequency of derogatory words used. More tweets or sentences were classified with a true negative result than a true positive result. Based on the higher number of TN results, classifying nonhate speech tweets accurately was proven to be harder because hate speech tweets usually have similar sentence structures that include derogatory words, making it easier for the trained model to predict hate speech. However, non-hate speech sentences containing negative words (usually expressing criticism or disappointment) can be falsely identified as hate speech since the model may perceive most negative words in the training dataset as derogatory words. Misclassification of hate speech sentences can also apply to sentences containing
words with an ambiguous meaning, where a certain word can be offensive or not, depending on the context. Testing datasets with new words that did not exist in training dataset was also prone to misclassification.
The false acceptance rate (FAR) in this study was defined as the number of tweets incorrectly categorized as hate speech while they did not contain hate speech. The false rejection rate (FRR) in this study was defined as the number of hate speech tweets incorrectly categorized as not containing hate speech.
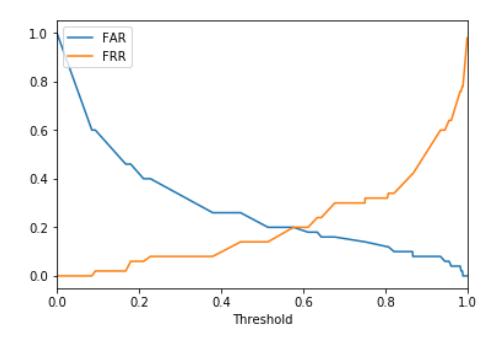
Figure 4 FAR and FRR graph.
Figure 4 shows the FAR and FRR graph, where the equal error rate (EER) value obtained was 0.19 with a threshold of 0.57. A lower EER value indicates a higher accuracy of the hate speech classification model. A threshold value of 0.5 is deemed to be the most optimal value because the highest TP and TN value was achieved with a threshold of 0.5.
5 Conclusion
The results of this study showed that the most optimal training accuracy generated from hate speech classification with CNN was 90.85% with a training loss of 23.25%. The best testing result was achieved with a threshold value of 0.5, whereas the best EER value was obtained with a threshold of 0.57. The testing accuracy increased a little each time the dataset size was increased and then decreased, with the highest testing accuracy at 82.5%. The accuracy of hate speech classification is influenced by a number of factors, i.e. the frequency of derogatory words, the similarity of words in the testing dataset and the training dataset, and the connotation of words in the dataset. In future works regarding hate speech classification in the Indonesian language, the training dataset should be added with more data to improve the accuracy. Different methods of feature extraction such as word2vec or fastText may be applied to train word sequences instead of word frequencies.