
1 Introduction
The brain-computer interface is a clinical application that can restore bodily functions for people with disabilities. Generally, the brain-computer interface is a communication method based on neural activity produced by the brain, which is independent of the natural outflow system, including nerve and muscle movements [1]. The brain-computer interface can provide control over prosthetics, electronics, and communication directly arising from brain signals. This technology has been studied over the past decade using different methods for recording and processing neural signals [2]. The hardware of the braincomputer interface can capture brain signals and various features, including local field potential, electrocardiogram, single-agent activity, and the brain's main signal, electroencephalography. The recording and analysis of electrophysiological brain signals is the basis for research and development related to the brain-computer interface.
Due to the fact that brain signal processing can be used in the field of smart medical engineering there are different methods for analyzing this data based on data mining. Data mining methods can be used to extract features or classify brain signal data, which enables the discovery of new knowledge from the data. Electroencephalographic signals contain vital information about the various behaviors and movements of the body. Based on the analysis of these signals, the processing system can obtain useful information. Therefore, being able to analyze the different behaviors of electromagnetic signals using a smart method is an attractive capability that can be used widely in the medical sciences. One of these uses is to improve diagnosis of diseases, for example epilepsy and multiple sclerosis [1].
The P300 component is one of the most important signal components associated with cognitive brain activity. The challenge is the detection of this component based on training patterns and artificial intelligence. It is necessary to consider a data set with EEGs from different individuals as input. First, normalization is performed on the data. Further, training and data testing is carried out based on the use of Twin Support Vector Machine, followed by classification. After that it is also necessary to identify and extract features to be able to detect different movements based on the available data. In this study, a recurrent neural network was used for this task because of its fast learning convergence in improving the space state, i.e. the EEG signal.
In recent years, companies and organizations have strongly focused on developing the quality of their products and services, justified by increasing consumer demand and fierce competition between companies. Competition is very prominent between companies and organizations in relation to product introduction. It is often seen that companies are reluctant to take innovative risks or adopt cutting-edge technologies, generally called strategies. Strategic innovations are costlier than other innovations and lead to related research that may take a long time. Risks can be facilitated by using collaboration strategies. However, collaboration can also be an obstacle, especially when companies and organizations are looking to work with technology partners who want to communicate intensively. Technology innovations may face another challenge, i.e. the inherent risk of science-based innovations, which is often difficult to define and measure. Organizations may face significant financial losses and future opportunities when the development or implementation of new products and their supply in an organization is shut down. Research in the field of knowledge-based networks focuses mainly on concepts, mechanisms and components.
The idea behind knowledge-based networks is similar to that behind normal supply chain management, i.e. the usual knowledge chain aimed at adapting
resources such as product supply chains to customer demand. As a general rule, knowledge-based networks can be used in a variety of sectors, including universities, institutes, hospitals, manufacturers, retailers, customers, and more. A knowledge-based network includes all the processes of acquiring, creating and transforming knowledge. Although knowledge is considered in the form of data or information, the flow unit can be seen as a potential value that is added to a company, which in turn creates or concentrates activities. In general, knowledge is intended to improve overall performance by turning it into available products by expanding the shared vision of companies that focus on physical, information or financial chains. Knowledge refers to specific information in universities, companies, organizations, hospitals and other institutions that can be used to create a product or process innovation.
The rest of this paper is organized as follows. In Section 2, related studies are reviewed to identify opportunities and challenges, datasets, methods, algorithms and results. After that, considering the challenges, a new method is proposed to solve these problems. Then the simulation conducted on the MATLAB platform is discussed and the obtained results are analyzed by making comparisons with other methods to validate the proposed approach. Finally, the last section contains the conclusion.
1.1 Literature Review
Many studies have been done on the brain-computer interface to detect motion from vital signals and to identify abnormalities. Firstly, we review motion detection techniques from vital signals and methods for detecting P300 and its application for motion detection and abnormalities are discussed. A lot of research has been done to visualize and detect the motion of fingers based on electrocardiograms and electroencephalographic signals. In [3], for example, the ability to use electrocardiograms and electroencephalographic signals with visualization was used to control a one-dimensional computer pointer in a robust and accurate way. Finger movements start from pyramidal and non-pyramidal cells in the cortex. The pyramidal cells as the main nerve output send axons to the spinal region. The movements of the fingers have three modes: motion, curvature, and constant [4]. Reference [5] proposes a method that can accurately use electrocardiogram and electroencephalogram signals to decode the flexural moment of the fingers. In [6], the use of a Gaussian sparse process with a pseudo input such as electrocardiogram and electroencephalogram signals is presented to decode the folding state of the fingers. Similarly, in [7] a method is introduced called dynamic non-parametric systems. In [8] and [9], decoding of the folding bends of electrocardiogram signals using amplitude modulation and specific bond characteristics in these signals is discussed. The same operation based on electrocardiogram signals is proposed in [10], using selective linear models. In
[11], various methods for classification of five-finger curvature in electrocardiogram signals based on Fisher's linear discriminate methods, the support vector machine, and K nearest neighbor are presented. Also, the main component analysis method was used to extract the scattering property and a matrix for feature selection.
In the study presented in [12], a Markov model and a support vector machine were used to detect body movements in electrocardiograms and EEG signals. In [13], the classification of a multichannel electrocardiogram signal according to individual finger movements is presented. This approach, based on a method called redundant spatial projection, yielded significant results in the classification of individual finger movements. In [14], a new study on the processing of electrocardiogram signals, the decoding of states to attain a natural understanding of the electrocardiogram signal is presented. Considering the three components of the electrocardiographic signal, i.e. low-pass filtered, low-frequency, and highfrequency domain modulation, decoding and precision measurements of all natural states in individuals were conducted. In [15], the decoding of various gestures and finger movements in the initial sense of the cerebral cortex using a high-density electrocardiogram signal is proposed.
Detecting the P300 component in vital signals, especially electromagnetic signals, for detecting and identifying characteristic behaviors was considered in [16]. The use of a convolutional neural network for detecting the P300 component in this research has been used before as an idea, which showed that the proposed method has high accuracy. In [17], a combination of two principle component analysis methods and a cross-covariance technique was used to extract distinct information from electroencephalographic signals. In order to make this data extraction robust, a multilayer perceptron neural network, a least squared support vector machine and logical regression were used. The results showed that the proposed method has a high degree of accuracy, about 99%. In [18], measurements of mental and physical activity were performed with an electromagnetic signal based on a probabilistic Gaussian distribution in two dimensions. The results showed that using the P300 component to measure mental and physical activity was 95.54% accurate. In [19], evolutionary computing algorithms were used to select and extract major features from electroencephalographic signal data to recognize emotions that occurred in a networked environment using sensors. The use of various data sets, including BCI Competition IV EEG, MAHNOB, and DEAP in the field of electromagnetic field signals, was proposed as a new challenge and the results suggested that the proposed method was accurate. In [20], sparse-matrix analysis was used to diagnose diseases and disturbances in the EEG signal. In [21], the brain-computer interface as measurement and control system is presented. This article surveyed several measurement and control systems, static as well as dynamic ones, for brain-computer interfaces that use EEG signals. A number of features of EEG signals in the sleep stage were extracted and classified in [22]. A classification method was proposed based on an artificial neural network for automatic sleep stage detection with major features that are extracted for processing. References [16-19] used the same data set as was used in the present study, called BCI Competition IV EEG data. Thus, the proposed could be evaluated by making a comparison with previous methods in terms of several criteria, such as accuracy, sensitivity, specificity, and others.
2 Proposed Method
First, it is necessary to first primary noise reduction on the EEG signal, which is done by using a median filter. Next, we repeat the stimulation of the average EEG signal to detect the P300 component. For voice stimulation, P300's average latency is about 300 ms (hence, the name P300), which is due to the positive polarity, but for other stimuli this may increase up to 1000 ms, for example for visual stimulation. In order to obtain an accurate and regular waveform, a Gaussian filter with a cut-off frequency of 8 MHz was applied to the average signal. It is necessary to extract features from the input signal with the P300 component, i.e. the series of features listed in Table 1 with their empirically determined coefficients.
| Features | Coefficient |
|---|---|
| PD437 | 0.020 |
| PD312 | 0.011 |
| CD437 | 0.010 |
| PT312 | -0.009 |
| PD62 | -0.009 |
| FT937 | 0.007 |
| FD937 | -0.006 |
| PD187 | -0.005 |
| FA531 | -0.003 |
| Constant value | -0.188 |
A method is needed for extracting the features in the presence of overlap and noise in order to detect the presence of the P300 component in the recurrent neural network coding blocks, which are basically categorized into three categories that contain a common spatial pattern. This research used a common time pattern method that influences the structure of the neural network to extract and select the best features. The existence of overlap and noise as well as interference with the brain-to-computer interface signals are among the most important issues that exist between adjacent and non-target parts. When the target character appears, the EPR protocol is obtained in the course of the target character. It is also located in adjacent non-target courses. These two adjacent periods are different in terms of the temporal patterns; a common time pattern is used for this purpose. Obtaining the time filters and extraction of the characteristics is done by Equation (1) with respect to the normal covariance matrices \(\widetilde{R_1}\) and \(\widetilde{R_2}\), and the time composition coincidence matrix \(\widetilde{R}\) according to Eq. (2):
\[\widetilde{R_a} = \frac{1}{n} \sum_{i=1}^{n} \frac{X_a'(i)X_a(i)}{\text{trace}(X_a'(i)X_a(i))}, \ a \in \{1,2\}\] (1)
\[\widetilde{R} = \widetilde{R_1} + \widetilde{R_2} \tag{2}\]
For each learning input vector in the recurrent neural network training rules, the network calculates the output unit response and then determines whether an error has occurred for this template. Here, an error means that the output calculated by the network is not the same as the target value. The learning of this rule is similar to the Hopfield law, with the difference that the weight only changes when the network response for the input is an error. The recurrent neural network distinguishes between errors in which the calculated output of the zero network (the unregulated area) has a target value of 1. It does not detect errors with calculated outputs of +1 and a target value of -1. In each case, the learning rule changes the network weights in the direction in which the response is aligned with the target value. In this network, only the weights on the connections from the linking units that send a nonparametric signal to the output unit will change, for the simple reason that these signals have caused the error. Therefore, according to the training rules the recurrent neural network, if an error occurs in the input pattern of the training set, the weights vary according to Eq. (3):
\[w_i(\text{new}) = w_i(\text{old}) + ax_i t \tag{3}\] where t indicates the target value, either +1 or -1. The learning rate determines the speed of the weight changes. In the network, if an error occurs, the weights will not change and the training will continue until there is no error. Recurrent neural networks are a group of neural networks that have a feedback loop from the output to their input. These networks are more powerful than feeder networks, since recurrent neural networks are able to recognize and recall temporary patterns in addition to spatial patterns. The complexity of these neural networks is a bit higher than that of other networks.
The convergence theorem of the learning rule of the recurrent neural network describes that if there are weights that allow the network to generate the correct answer for all instruction patterns, then the learning method of the recurrent neural network finds values when determining the weight. This means that the recurrent neural network will be able to solve the problem or learn the desired category. Additionally, the network will find these weights several times with a limited number of repetitive trainings. The key idea behind the neural network is that after training it has the ability to be generalized, so that new input patterns can be added. This makes it possible to identify unknown patterns in the tracks by training. In other words, the neural network is an appropriate regression for fitting the hidden function associated with inputs and outputs. One of the advantages of using a neural network is that it can bring a more complex division into the network structure.
Many experiments have been done to find the number of neurons in the hidden layer in a recurrent neural network. The hidden layer is a layer whose existence is necessary because the patterns are divided into several classes. The multilayer perceptron neural network is trained using an error-back propagation algorithm. The back propagation algorithm for multi-layer networks, such as the recurrent neural network, is an extension of the LMS algorithm. Both have the same efficiency index, which is the mean squared error. This algorithm reduces the mean square of errors between the desired output and the actual output, which is a function of the stimulus used, called the Levenberg Marquardt algorithm, also known as trainlm. The transfer function is a linear or nonlinear function of type n. The transfer function is used to determine the properties of the neuron in order to solve various problems. Like Gaussi-Newton's method, the Levenberg Marquardt algorithm was designed to approach a quadratic equation without computing the Hessian matrix. When the efficiency function has a view of the sum of the squares, the Hessian matrix is calculated with Eq. (4); its gradient is in the form of Eq. (5).
\[H = J^{T}J \tag{4}\]
\[g = J^{T}e (5)\] where J is a Jacobi matrix that contains the first derivatives of the network errors by considering weight and bias; e is the network error vector. The Jacobian matrix can be calculated using the standard back propagation error method, which has less computational complexity than the Hessian matrix. The feature extraction section is one of the most important parts of the P300 component detection system. In Table 1, the features are listed that are supposed to be extracted and used in order to enable visualization of motion in the classification stage. The feature vectors can be extracted by using Eq. (6):
\[Z = XH' \tag{6}\]
By multiplying the production filters in the training section and testing the recurrent neural network in the extraction phase of the features in the preprocessed data X, the property vectors Z can be obtained. H is a time-space filter.
For learning purposes, the network uses two layers of the trainlm actuator function with 10 neurons. The number of neural network iterations is 1000, the network mutation rate is 0.001 and the weight of each layer is 1. In order to train, 70% of the input data is used for training and 30% for testing. Now that the features have been identified and dimming, selection and extraction of the best features based on the initial features in Table 1 is conducted, after the detection of the P300 component it is necessary to do classification and to determine for each section which mode of motion is located on the wrist, elbow or shoulder. This operation is based on Twin Support Vector Machine.
Twin Support Vector Machine is a powerful computing tool for learning with monitoring, which is currently performing better than many other systems in a wide variety of applications. However, one of the main challenges of this method is the high computational cost that comes with major quadratic programming problems. The training dataset in the support vector machine is classified in order of classification by Eq. (7):
Data = \[\{(x_i, y_i) | x_i \in \mathbb{R}^p, y_i \in \{-1, 1\}\}_{i=1}^n\] (7)
where y is 1 and 1, and each xi is a real p-dimensional vector. The goal is to find the separator superconductor with the maximum distance from the margin points that separate the points with yi = 1 from the points with yi = 1. Each vector can be written as a set of points x that satisfy Eq. (8):
\[\mathbf{w}.\,\mathbf{x} - \mathbf{b} = \mathbf{0} \tag{8}\] where w is the normal vector, which is perpendicular to the superposite. It must choose w and b so that the greatest possible distance between the parallel clouds that separate the data is created. If the learned data is linearly separable, then two super-vectors can be considered at the margin of the points so that they have no common point and then we try to maximize their distance. The kernel structure of the support vector machine is twin-like and does not compute as a classical state, i.e. single-to-single data, but does pairwise comparisons. Here, the kernel will be defined in the form of Eq. (9) and w will be calculated with the help of the alpha terms in Eq. (10):
\[k(x_i, x_j) = x_i \cdot x_j \tag{9}\]
\[w = \sum_{i} \alpha_{i} y_{j} x_{i} \tag{10}\] where k is the kernel, the alpha value for all i is positive, and w is a soft state. In general, in the classification stage there are two main objectives: 1) the separation of the signal into two groups containing P300 and non-P300 components; 2) visualization of motion after detecting the presence or absence of the P300 component in the wrist, elbow and shoulder in the area of the arm. Basically, there is a two-way relationship between the extracted blocks and the classification. The longer the information vector of attributes is from the separated classes, the simpler the classification structure. The overall structure of the proposed approach is depicted in Figure 1.
Figure 1 Proposed method structure.
2.1 Simulation and Results
The standard data set used by this study was the BCI Competition IV EEG dataset based on the research mentioned at http://www.bbci.de/competition/iv. The data set can be downloaded directly from https://sccn.ucsd.edu/~arno/ fam2data/ publicly_available_EEG_data.html. The first dataset at this address was used for the classification of continuous EEG signals without trial structure (data set 1), i.e. 64-channel electroencephalogram signals in a frequency range of 0.05 to 200 Hz, with a sampling rate of 1000 Hertz and 2 classes (healthy and patient), based on movement recognition and the P300 component. This dataset was entered as input into the proposed system. The data include movements of the left hand, the right hand, the left and the right leg. Three areas were considered as moving parts, i.e. the right wrist, the right knee, and the left shoulder joint. The entire BCI Competition IV EEG data set was entered as input; the data file EEG_100.MAT was optional. In this case, the matrix of the signal was 3 × 10,000. The motor features of three areas, namely the right wrist, the right knee, and the left shoulder joint, were considered. To reduce the noise in the signal and to improve the signal space, a normalization step including noise reduction with a median filter was performed on the signal. Then, Twin Support Vector Machine was used to classify the signal data. In this section, the data in the row and column of the dataset are compared to each other according to two distinct classes. The classification was based on the data in the input signal, each of which has a certain range. The purpose of classification was to distinguish three areas of motion, i.e.
the right wrist, the right knee, and the left shoulder joint. Disruptions were also considered. In the next step, the recurrent neural network was used to extract the most important features from the classes.
Initializing the parameters is essential. The recurrent neural network iteration number was set to 100. The training method used was back propagation error. The threshold of the vector carriers was set to 0.8 and the total number of classes according to the number of different states in the input EEG signal and its website was 100. The first three features of the P300 component were detected according to Table 2 and the values contained therein.
Table 2 P300 component used features.
| Features | Coefficient |
|---|---|
| PD437 | 0.020 |
| PD312 | 0.011 |
| FT937 | 0.007 |
The P300 component was detected from the EEG signal within the core of the training and testing data by the recurrent neural network. After this, the three features mentioned in Table 2 were extracted with the recurrent neural network. The initial frequency of the signal was 1.42 Hz, the sampling frequency of the input signal was 350 Hz, and the amount of motion in the EEG signal was set to 26 by default. Then the fast Fourier transform was applied to the signal data in the training phase of the recurrent neural network to determine the frequency of the signal. Figure 2, shows the input signal.
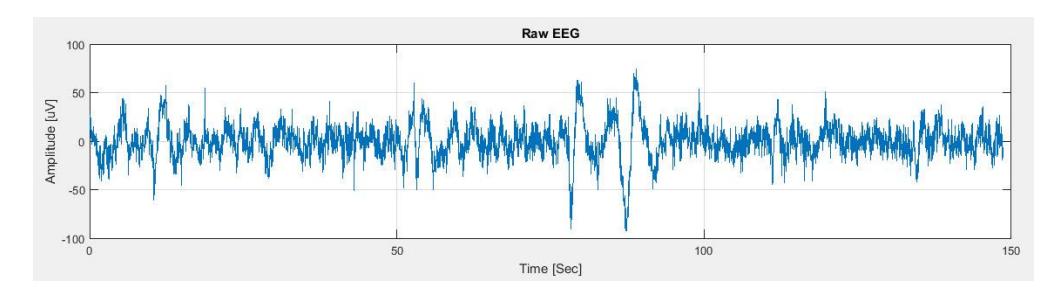
Figure 2 The input signal.
Identifying the P300 component in the signal was performed as shown in Figures 3 and 4. With a magnification of up to 3 times in an area, the P300 component can be determined.
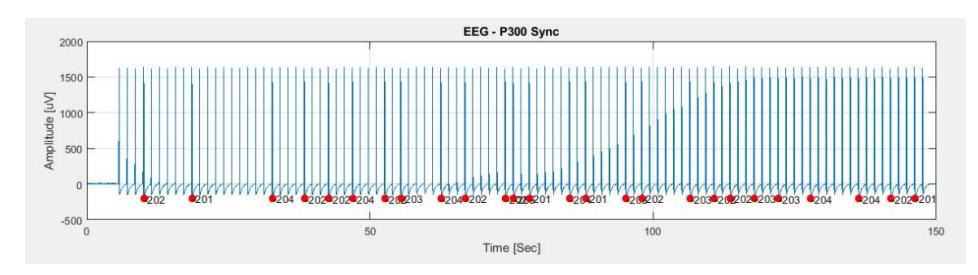
Figure 3 P300 determination in the signal.
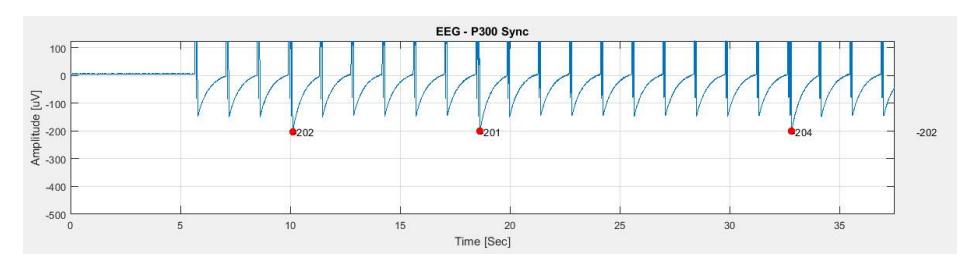
Figure 4 Zooming 3x in an area to determine the P300 component.
Then, the fast Fourier transform was used to identify the signal range in the input data (upper part of Figure 5), and then the peak of the frequency domain was determined, also using the Fourier transform (lower part of Figure 5), which was 0.2219 Hz.
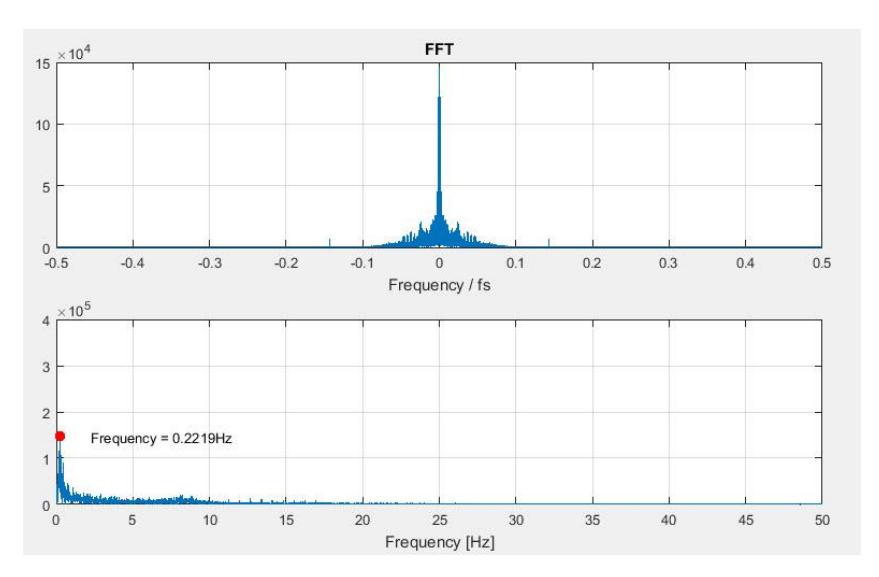
Figure 5 a) Upper part: determination of the signal range in the input data; b) lower part: frequency domain peak at a rate of 0.2219.
Three features (PD437, PD312 and FT937) were used to reveal the P300 component, the various stages of which can be seen for 8 steps with PD437 in Figure 6, for 8 steps with PD312 in Figure 7 and for 8 steps with FT937 in Figure 8.
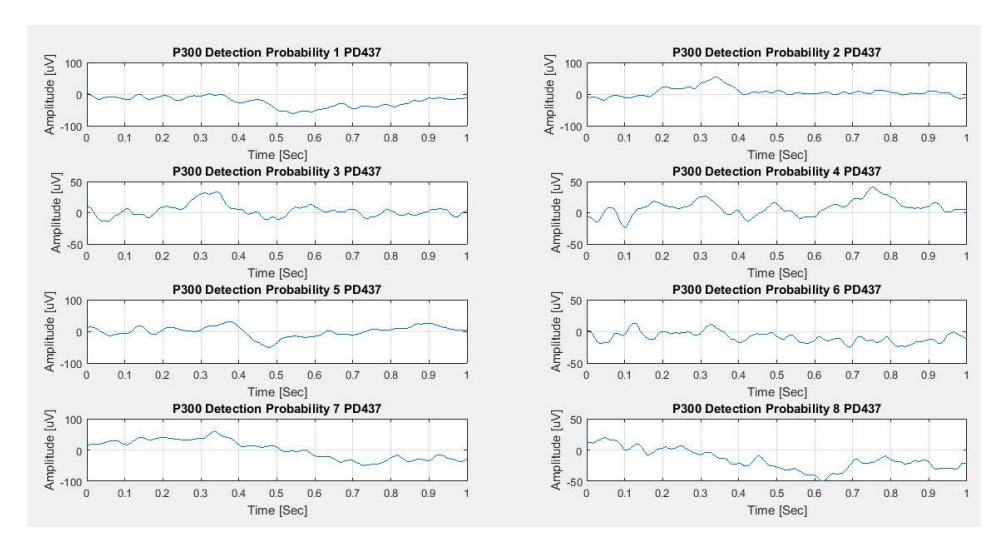
Figure 6 Eight steps with PD437.
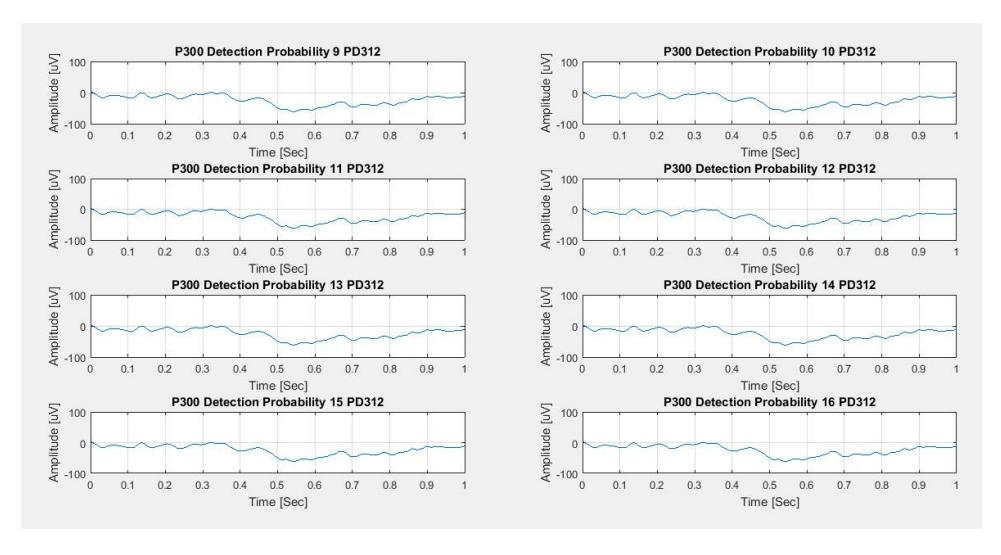
Figure 7 Eight steps with PD312.
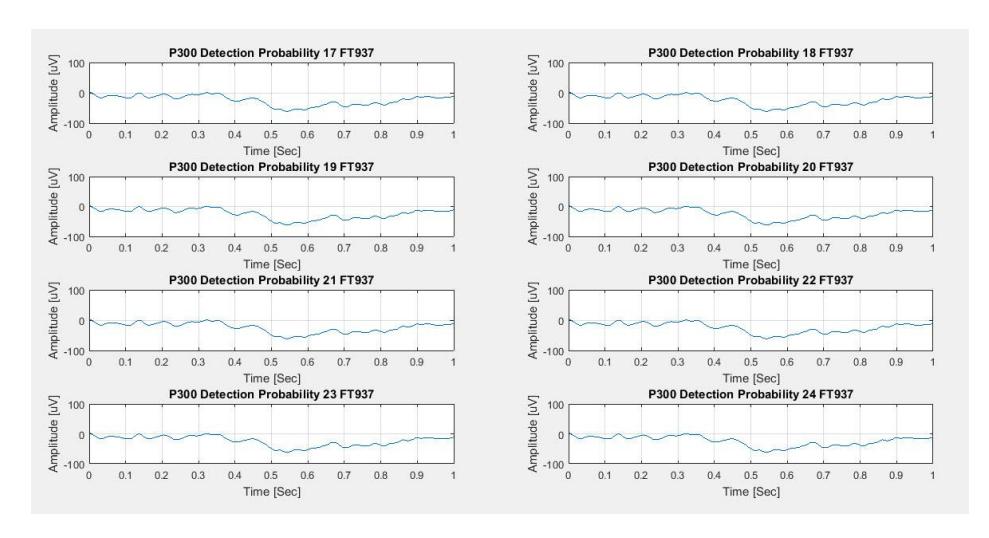
Figure 8 Eight steps with FT937.
Finally, after a total of 24 processes, the P300 component was detected in processes 25 and 26, the result of which can be seen in Figure 9. The reason for conducting the previous 24 steps was that each component with an adjusted coefficient should be processed as much as possible so that the accuracy and precision of P300 component detection is improved, after which the correct macro properties can be extracted during classification.
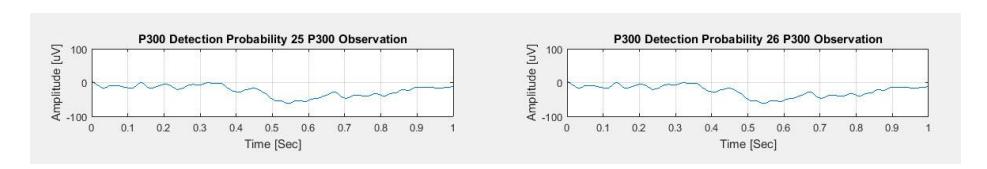
Figure 9 P300 detection.
During each of the 8 steps, the extraction of the features was done by two-to-two comparison. Four comparative operations were performed, giving a total of 8 steps for each feature, which is a total of 24 processes involving 12 comparisons, after which the P300 component was detected. Then followed a double-to-two comparison and in the final phase, the 26th process, the P300 signal was clearly detected. Now that feature extraction was completed, motion visualization was done by using the vector-based backup settings and classification based on the extracted features. It should be noted that no toolkit for modeling the recurrent neural network was used in the previous steps. After extracting the primary macro features, the three areas of motion were visible, i.e. the right wrist, the right knee, and the left shoulder joint, as shown in Figure 10. In Figure 10, the common angles are represented by degrees in relation to time in the three joints. It is also
possible to observe the features of disturbances in the time interval of the total EEG signal after detecting the P300 component, as well as disturbances and motor disorders in the three areas of motion, i.e. the right wrist, the right knee, and the left shoulder joint. The output of this section is given in Figure 11.
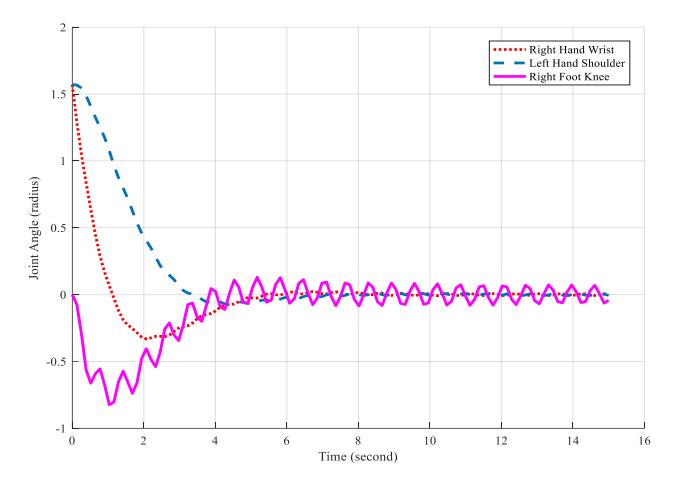
Figure 10 Angles and output of three movement areas, i.e. right wrist, the right knee, and the left shoulder joint.
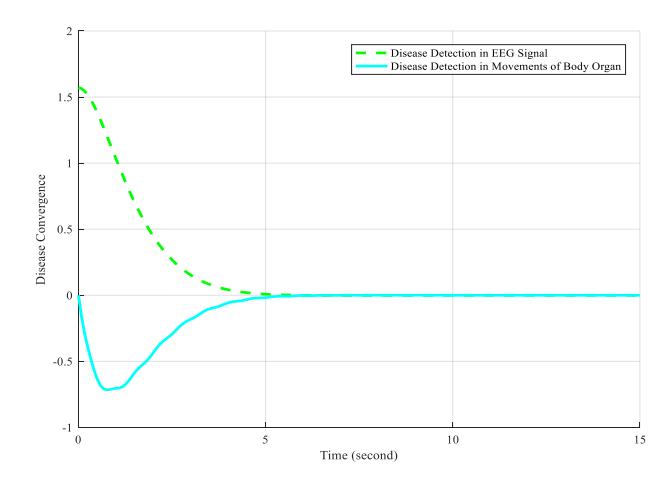
Figure 11 Disease and disturbances in movements in the total EEG signal.
As can be seen in Figure 11 there were disturbances in the initial EEG signal of one individual for a total duration of 15 seconds, where the graph is reduced to zero (Fragmented line). Also, the diagnosis of abnormalities in the movement of organs of the body, i.e. the right wrist, the right knee and the left shoulder joint, can be observed, reaching zero and converging to zero (line). Thus, with the proposed approach we were able to visualize motion after detecting the related P300 component in the EEG signal and then identifying disturbances and abnormalities in it. The evaluation criteria were derived after the proposed approach was applied. The results are presented in Table 3.
| Table 3 Evaluation crit | eria after applying | the proposed method. |
|---|
| Specificity (%) | Sensitivity (%) | Accuracy (%) | SNR (dB) | Mean Square Error |
|---|---|---|---|---|
| 100 % | 99.01 % | 99.75 % | 126.4325 dB | 0.0056 |
Finally, a comparison was made with other methods in terms of extracting classification-based features based on the evaluation criteria in Table 4 and Figure 12.
Table 4 Feature extraction based on classification comparison.
| References | Accuracy (%) | Sensitivity (%) | Specificity (%) |
|---|---|---|---|
| Zarei, Roozbeh et al., 2017, [31] | 99.66 % | 98.99 % | 100 % |
| Murat Yilmaz, Cagatay et al., 2018 [32] | 95.54 % | - | - |
| Nakisa, Bahareh et al., 2018 [33] | 98.87 % | 97.20 % | 95.72 % |
| Samiee, Kaveh et al., 2016 [34] | - | 71.60 % | 99.20 % |
| Proposed method | 99.75 % | 99.01 % | 100 % |
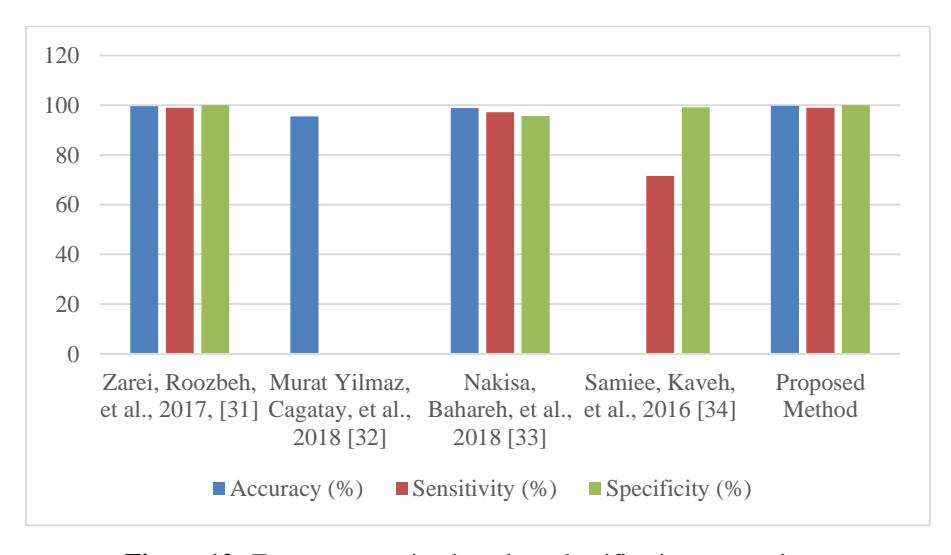
Figure 12 Feature extraction based on classification comparison.
3 Conclusion
Smart medical diagnosis and the brain-computer interface are important areas in the field of smart medicine. Today, medical science relies on the brain computer interface and intelligent medical diagnostic systems to help doctors make the best decisions related to a patient's situation, preventing problems in the future as much as possible. One of the most important parts of smart medicine is the study of the human brain, which carries out many processes that are virtually unknown to date. By capturing brain activity in EEG signals, information from the condition of the brain can be obtained. EEG signal processing can help doctors in various stages of the disease. Therefore, it is essential to provide an smart medical diagnostic system for EEG signal processing. One of the most important components of the brain is the P300 component. Intrinsic to this component is noise, which can be removed by extracting the appropriate information on the condition of the brain and the organs attached to it. Therefore, the first scope of this research was to detect the P300 component in EEG signals.
To this end, we needed an appropriate dataset. We chose the BCI Competition IV EEG dataset, which contains EEG signals that are unique to one person. It is necessary to first reduce the noise in the signals with a median filter. Then extraction of EEG signal characteristics was done using a recurrent neural network, by training and testing to identify three features of the main P300 component, i.e. PD437, PD312 and FT937. In the final phase, i.e. the selection and extraction of features, pairwise comparison was performed for each component in 4 stages and a total of 8 processes. This involved a total of 24 processing steps in order to determine the classes and define the final class of the P300 component. After detection of the P300 component classification was performed using Twin Support Vector Machine to extract the major features from the EEG signal. In this phase, the aim was to identify and visualize motion in three areas, i.e. the right wrist, the right knee and the left shoulder joint. The results showed that this could be detected in access based on the angle of motion in terms of time (in seconds). Convergence was done to find abnormalities and disturbances in these three areas. Finally, a comparison with previous methods was done, which showed that the proposed approach had better results than the previous ones.