
1 Introduction
Indonesia is very vulnerable to tsunamis [1], the worst event being the Aceh tsunami on December 26, 2004, which caused more than 230,000 fatalities [6]. In the last two years, a landslide tsunami occurred in Palu Sulawesi on September 28, 2018 [2-4] following an earthquake event, while a volcanogenic tsunami occurred in the Sunda Strait on December 22, 2018 [5]. These events confirmed that the tsunami threat still exists in Indonesia and can cause large numbers of casualties and property losses. Since 2005, through the contribution of the German-Indonesia Tsunami Early Warning System (GITEWS), the Indonesian Agency for Meteorology, Climatology, and Geophysics (BMKG) operates the
Indonesia Tsunami Early Warning System (InaTEWS) [7]. InaTEWS is the National Tsunami Warning Center (NTWC) for the Indonesian region and is also a Tsunami Service Provider (TSP) for the Indian Ocean region [8].
Tsunami warning information can be estimated through numerical tsunami modeling [9-11]. Furthermore, studies from Rakowsky, et al. [11], Immerz, et al. [12] and Harig, et al. [8] have produced the tsunami scenario database of TsunAWI, including inundation data and covering all Indonesian fault zones. As a result, InaTEWS is able to issue early warning information on tsunamis caused by earthquakes that occur in area A of NTWC (see Figure 1). The tsunami warning information consists of estimated wave height (EWH) and estimated time of arrival (ETA) resulted from the TsunAWI model and presented in the form of warning zones for all cities and regencies along the Indonesian coastline. A warning level for each zone is determined based on EWH and categorized into three threat statuses, as described in Table 1. However, the existing tsunami early warning system does not cover inundation and tsunami impact predictions.
Table 1 InaTEWS warning levels [13].
| Threat Status | Estimated Wave Height |
|---|---|
| Advisory | 0.25m ≤ mwh ≤ 0.5m |
| Warning | 0.50m < mwh ≤ 3.0m |
| Major warning | 3.0m < mwh |
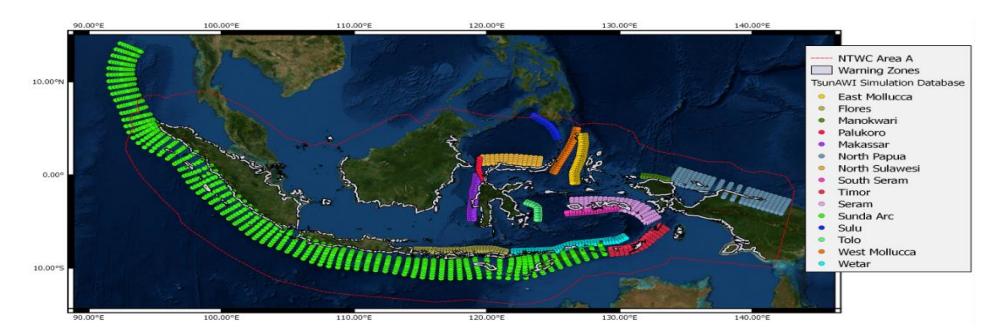
Figure 1 A brief description of InaTEWS: NTWC area A, warning zones for each city/regency, and TsunAWI simulations coverage.
In another study, Lekkas, et al. [14] have proposed the new integrated tsunami intensity scale (ITIS-2012), which horizontally correlates the flow depth of inundation used in the present study and tsunami impact categories. This intensity scale is compatible with European Macroseismic Scale 1998 (EMS1998) [15] for structure vulnerability and Environmental Seismic Intensity Scale 2007 (ESI2007) [16] for geo-environmental effects.
In the context of tsunami early warning systems, inundation and tsunami impact prediction can provide more detailed tsunami warning information. Inundation prediction covers an estimation of flow depth and inundation distance for each city/regency. Furthermore, inundation prediction is also useful in providing tsunami risk assessments and a basis for planning disaster mitigation [17]. Since inundation predictions are very important, the next generation of tsunami early warning systems should have the capability of providing inundation predictions within a short amount of time [18].
The inundation data resulted from the studies of Rakowsky, et al. [11], Immerz, et al. [12], and Harig, et al. [8] are available in mesh resolution data products that cannot be used directly for tsunami early warning purposes. The inundation data needs to be analyzed and processed first in order to develop inundation predictions and tsunami impact predictions.
To complement these previous studies, this research proposes a tsunami impact prediction system based on TsunAWI inundation data and ITIS-2012 for tsunami impact categorization. The proposed method was applied to the 2004 Banda Aceh tsunami as an example. The Banda Aceh tsunami was chosen because the TsunAWI inundation data set for the Banda Aceh region has a high mesh resolution (50 m) in the TsunAWI model. Also, the inundation in the Banda Aceh area has been evaluated in previous studies by Jaffe, et al. [19], Harig, et al. [20], and Dermadi & Bandung [21]. A high resolution of the inundation data enables better depiction of forthcoming tsunami threats [18]. However, the pre-calculated scenarios are based on simplified sources, which poses limitations on the realism of predicted inundations since the quantities depend strongly on the actual shape of the source.
The proposed system is divided into a main system, a pre-calculated inundation database, and a client. As the output, the system provides inundation predictions incorporated in a generated tsunami warning bulletin, inundation map, and a tsunami impact prediction for each related city/regency. In addition, the system provides automatic sea level anomaly detection from tide gauge sensors by applying the tsunami detection algorithm proposed by Mofjeld [22].
2 Methodology
Data analysis was conducted to evaluate a large amount of inundation data, using analytical and logical reasoning to examine each component of the data provided and to reveal new insights [23,24]. Figure 2 shows the steps of the data analysis process carried out in this research. Several parts are data preprocessing steps [25].
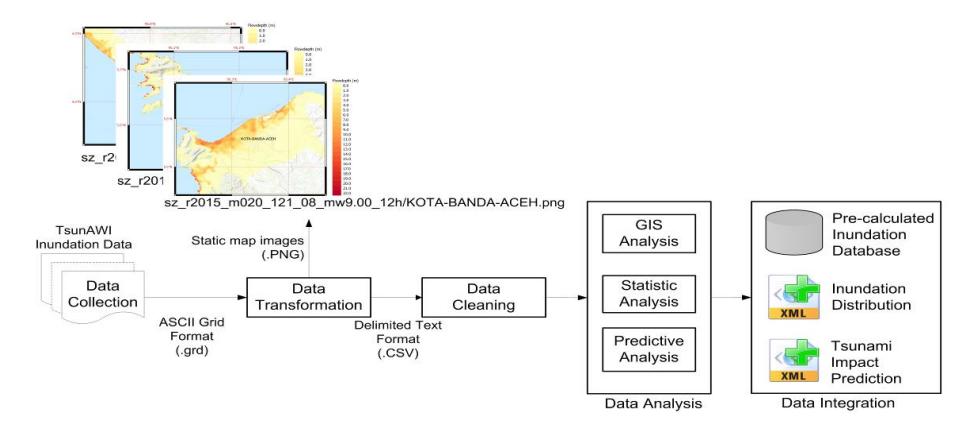
Figure 2 The steps of data analysis carried out in this study.
2.1 Collection of the Inundation Data Set
The TsunAWI inundation data set is provided in binary grid (.grd) format for each scenario. It has a unique file naming structure to provide convenience in terms of data retrieval and easy recognition. Figure 3 shows a small part of the Sunda Zone (SZ) simulation scenarios, more specifically designated to the position of the SZ_r2015_m020_121_08_mw9.00_12h.grd inundation data for illustration purposes. Note that the hydrodynamic value contained in the inundation data shows the flow depth value and one position of the index consists of several tsunami simulation scenarios.
| 93.0°E ,123, 2 | 121, 4 | 121, 16, 121, 18, 121, 14 119, 2 121, 10 119, 2 121, 8 119, 12 121, 6 119, 12 121, 6 119, 12 | , 22 | ACEH-JAYA | 96.0°E INRA PIOLE BIREL | 975°E JEN ZAC T-UTĀRĀ BĀGĪĀN TĀRIJS | |
|---|---|---|---|---|---|---|---|
| 4.5 | Lon | lat | name | 1 | 1 8 | ||
| 93.924560 | 5.0058000 | SZ_r2015_m020_121_08_mw7.00_12h | 121 | 8 15, 16 14 | ACEH-BARAT | ACEH | |
| 93.924560 | 5.0058000 | SZ_r2015_m020_121_08_mw7.20_12h | 121 | 8 | 118 | ||
| 93.924560 | 5.0058000 | SZ_r2015_m020_121_08_mw7.40_12h | 121 | 8 | 3, 18, 113, 16 MAGAN-RAM | ||
| 93.924560 | 5.0058000 | SZ_r2015_m020_121_08_mw7.60_12h | 121 | 8 113, | 13, 14 12 | ||
| 93.924560 | 5.0058000 | SZ_r2015_m020_121_08_mw7.80_12h | 121 | s 113, 10 | 111, 20 | 11, 18 | |
| 93.924560 | 5.0058000 | SZ_r2015_m020_121_08_mw8.00_12h | 121 | 8 3, 8 | 111, 16, | ||
| 93.924560 | 5.0058000 | SZ_r2015_m020_121_08_mw8.20_12h | 121 | 8 | ACEH-SELAVAN BAGIAN UTARA | ||
| 3.0 | 93.924560 | 5.0058000 | SZ_r2015_m020_121_08_mw8.40_12h | 121 | 8 | 109, 20 109, 18 | |
| 93.924560 | 5.0058000 | SZ_r2015_m020_121_08_mw8.60_12h | 121 | 8 | 111, 8 | 109, 14 ACEH-SELATAN BACCINE | |
| 93.924560 | 5.0058000 | SZ_r2015_m020_121_08_mw8.80_12h | 121 | 8 111, 6 | 7 | 109, 12 | |
| 93.924560 | 5.0058000 | SZ_r2015_m020_121_08_mw9.00_12h | 121 | 311, 4 | 96.0°E | 109, 10 ACEU-SIN |
Figure 3 A small distribution of the Sunda Zone (SZ) tsunami simulation scenario, which also represents the position index of the scenario in its fault zone with the values of i and j.
2.2 Data Transformation
Data transformation changes or consolidates original data into a form suitable for analysis needs. In a broader sense, data transformation relates to normalization and aggregation [25]. The inundation data analysis in this research refers to the coastal forecast zones/warning zones of the Indonesian tsunami warning center, InaTEWS. To obtain the inundation data based on the coastal forecast zones (CFZ) of all cities/regencies along the Indonesian coastlines, we use the GIS software analysis tool to process and combine the binary grid data of inundation with the vector data of CFZ and then convert it to the XYZ vector format. This data transform mechanism is illustrated in Figure 4.
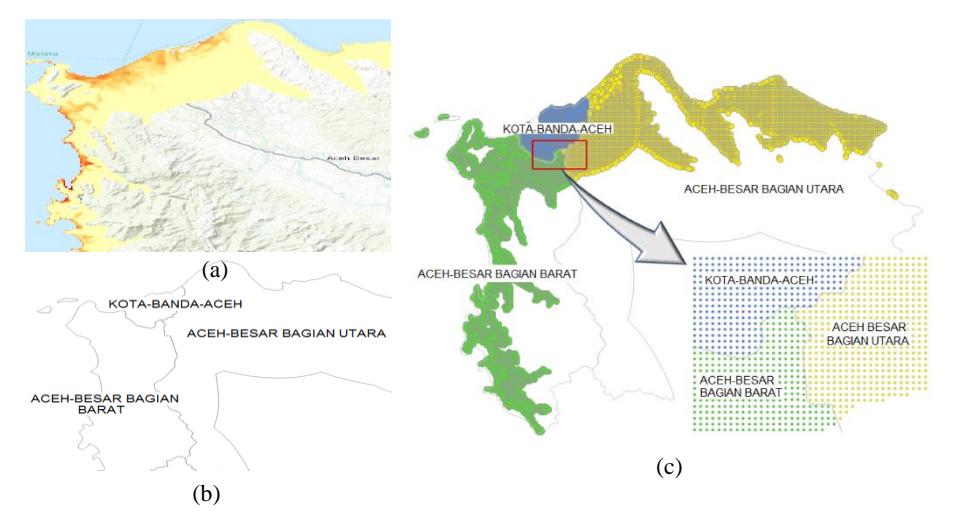
Figure 4 The data transform mechanism: (a) the TsunAWI inundation data in binary grid format; (b) the coastal forecast zones of all cities/regencies in Shapefile format; (c) the TsunAWI inundation data based on cities/regencies incorporated in the XYZ vector format.
2.3 Data Cleaning
The data cleaning process is related to eliminating outlier data, removing unnecessary data, smoothing insufficient data, and dealing with inconsistent data [25]. We eliminate the zero-value of flow depth, remove innate attributes that are not needed in the analysis, and take essential parts such as object ID as unique values for every single point in the inundation records, flow depth (grid_code), city/regency (PLACE_NAME), province (BOX_NAME), latitude, and longitude, as illustrated in Figure 5. Flow depth is the estimated tsunami height above the ground in decimeters.
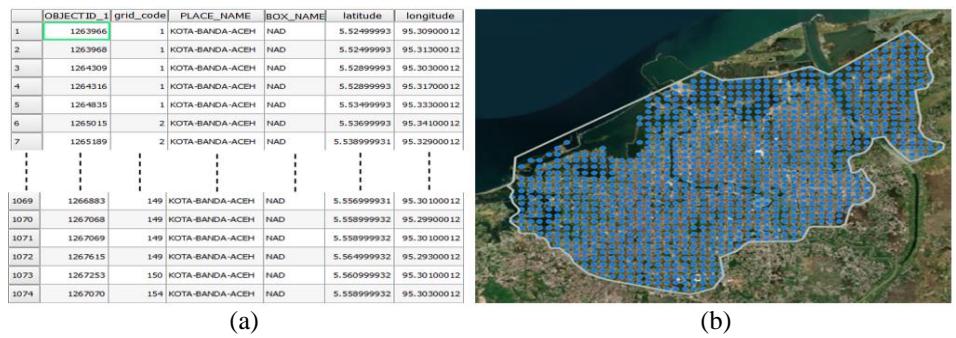
Figure 5 Inundation data cleaning result for each city/regency. Taking KOTA-BANDA ACEH as an example: (a) tabular view of inundation data; (b) map view of inundation data.
2.4 Data Analysis
In a tsunami early warning system, a large number of calculations on a large amount of inundation data records take a long time to execute and require large computation resources if the analysis is carried out in real-time [26]. Off-line analysis of the inundation data set was conducted to produce a new data product, a pre-calculated inundation database. Measuring the shortest distance from a known coordinate can be resolved using the nearest neighbor distance matrix approach [27]. We perform GIS analysis using the distance matrix analysis tools in QGIS software version 2.18.28 to measure the inundation distance. We use the full resolution coastline data of GSHHG [28] and make some simplifications for computational efficiency, as shown in Figure 6.
Figure 6 The shortest inundation distance calculation through GIS analysis: (a) coastline data simplifications per city/regency; (b) distance matrix result (hub lines) of inundation data measured to the closest coastline.
We perform a predictive analysis to estimate the tsunami impact adapted from the Integrated Tsunami Intensity Scale 2012 (ITIS-2012) as shown in Table 2. To summarize the inundation predictions that the system can quickly access, we carry out a simple statistical calculation of the inundation data per city/regency. An example result of these calculations can be seen in tabular view in Figure 7.
| Table 2 | Tsunami impact p | orediction adapted | from ITIS-2012. |
|---|
| Intensity Scale | Impact | Flow Depth (f) | Intensity Scale | Impact | Flow Depth (f) |
|---|---|---|---|---|---|
| I - IV | Not felt – largely | 0 m < f < 0.5 m | IX | Destructive | \(5 \text{ m} \le f < 7 \text{ m}\) |
| observed | X | Very | \(7 \text{ m} \le f < 9 \text{ m}\) | ||
| V - VI | Strong - slightly | \(0.5 \text{ m} \le f \le 1 \text{ m}\) | Destructive | ||
| damaging | XI | Devastating | \(9 \text{ m} \le f < 10 \text{ m}\) | ||
| VII | Damaging | \(1 \text{ m} \le f \le 2 \text{ m}\) | XII | Completely | \(f \ge 10 \text{ m}\) |
| VIII | Heavily damaging | \(2 \text{ m} \le f \le 5 \text{ m}\) | Devastating |
| Flow | Depth | Inundation | Distance | Not Largely | Felt - Observed | Str Slightly | ong - Damaging | Dan | naging | Heavily | damaging | Dest | ructive | Very De | structive | ||||
|---|---|---|---|---|---|---|---|---|---|---|---|---|---|---|---|---|---|---|---|
| - Copie | 0.5m | 0.5m < | = fl < 1m | 1m <= | = fl < 2m | 2m <= | fl < 5m | 5m <= | fl < 7n | 7m <= | fl < 9m | ||||||||
| Σ Data | Avg | Min | Max | Min | Max | Σ | % | Σ | % | Σ | % | Σ | % | Σ | 96 | Σ | 96 | ||
| 1074 | 4.3 m | 0.1 m | 15.4 m | 0.4 Km | 7 Km | 30 | 3% | 97 | 9% | 83 | 8% | 511 | 48% | 177 | 16% | 137 | 13% |
Figure 7 Example result of the simple statistical calculations for inundation and tsunami impact prediction for BANDA-ACEH (NAD).
2.5 Data Integration
This inundation data analysis produces new data products for InaTEWS, including the pre-calculated inundation database, inundation maps for each city/regency, and tsunami impact prediction. These data products are used in the tsunami impact prediction system and are included in the tsunami early warning bulletins. In general, the database consists of two types of tables, as shown in Figure 8. Besides that, the inundation distribution and tsunami impact predictions are integrated into XML format to speed up the access to the system when loading the data. Every data product is integrated with a file-based structure and the file naming is based on scenario ID and city/regency.
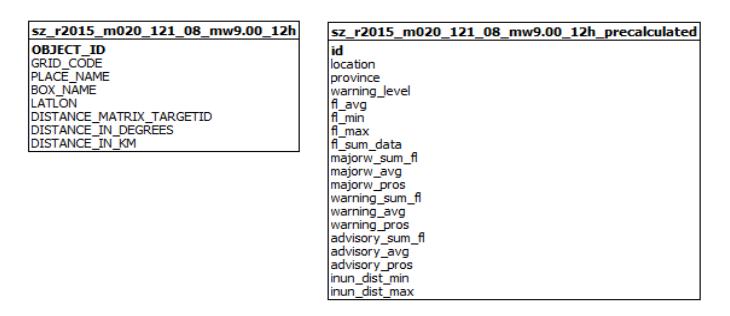
Figure 8 Two types of tables of the pre-calculated inundation database scheme.
2.6 System Functionality
Based on the system architecture and system workflow in Figures 9 and 10, the system functionalities can be described as follows:
- 1. The proposed system is able to receive the earthquake parameters and the related tsunami scenario from the tsunami observation and simulation terminal (TOAST) of InaTEWS through a flag messaging service.
- 2. In parallel, the system is able to collect sea level observation data from tide gauge sensors and provides automatic sea-level anomaly detection by applying a tsunami detection algorithm as background processes of the system.
- 3. Find the specific best inundation data from the pre-calculated inundation database based on the tsunami scenario ID of the event.
- 4. The system is able to provide the inundation prediction information and the impact prediction information for each city/regency in the form of a tsunami warning bulletin and visual display as the output of the system.
2.7 System Architecture
The system architecture of the tsunami impact prediction system is shown in Figure 9. The main system runs with the Ubuntu 18.04 64-bit operating system and consists of NGINX web server v.1.17.0, PHP v.5.4.6 web script, LeafletJS v.1.3.1 for web GIS, a free version of Fusioncharts v. 1.2.3F and several scripts, such as Perl v.5.10.0 and a shell script with bash version 4.4.19 for modularly handling the background processes. The database system runs on the Ubuntu 18.04 64-bit operating system, with MySQL as the database management system for the pre-calculated inundation database.
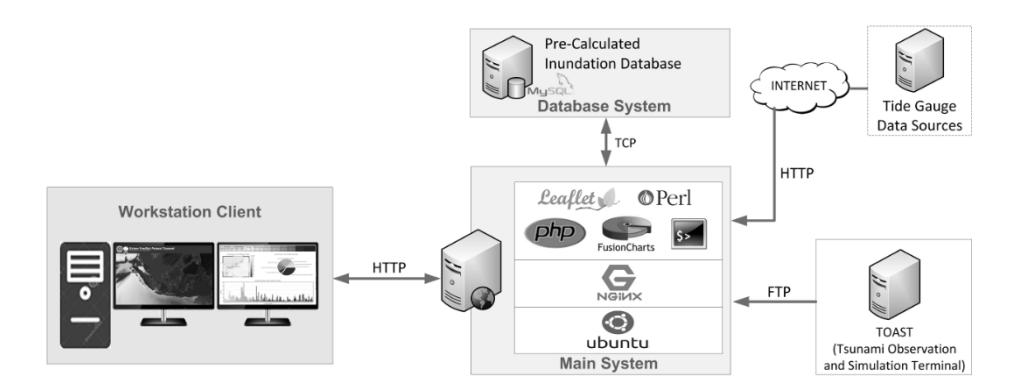
Figure 9 System architecture of the tsunami impact prediction system.
2.8 System Workflow
The system workflow consists of three interconnected parts: data handling, data processing, and output visualization, as described in Figure 10. The data processing mainly consists of data acquisition to retrieve sea-level observation data, the tsunami detection algorithm module to detect arrival time and maximum amplitude, a pre-calculated inundation database, the control center, and the subroutine program.
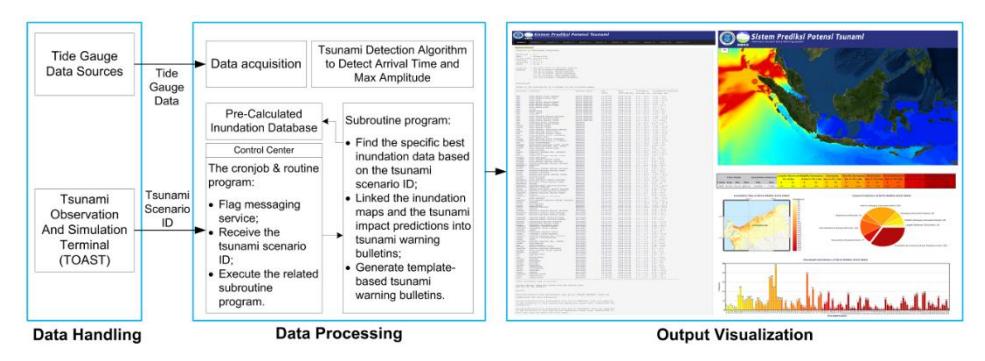
Figure 10 Workflow of the tsunami impact prediction system.
3 Results and Discussion
3.1 Experimental Scenario
The system was implemented based on the system architecture described in Section 2.7. The implementation and experiment were conducted on the main system with Intel Xeon CPU W3503 @2.40GHz 2 Cores, 16 GB of RAM, and NVIDIA Device 0a38 128 MB VGA Card. The database system was equipped with Intel Xeon Gold 6128 CPU @ 3.40GHz 12 Cores, 32 GB of RAM, and Matrox Device 0538 16 MB VGA Card while the client was equipped with Intel Core i7-2617M CPU @1.50GHz, 4GB RAM, and Intel HD VGA Card.
An experimental scenario was conducted based on the system workflow shown in Figure 10. As trigger event for the tsunami impact prediction system, we manually reran the 2004 Banda Aceh tsunami on the TOAST system by using the earthquake parameters of the 2004 Banda Aceh tsunami with a slight modification of the fault dimensions in order to get the worst-case TsunAWI scenario described in Figure 11.
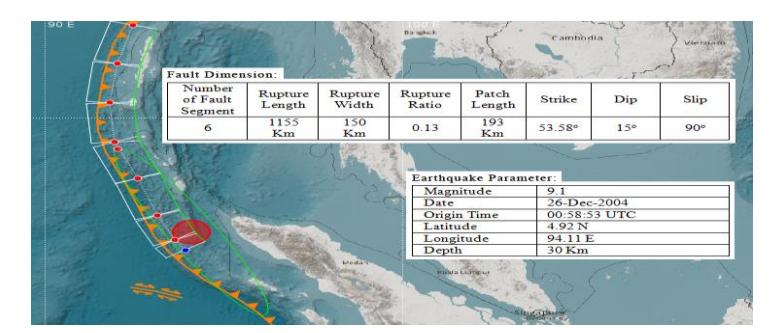
Figure 11 The earthquake parameters and fault dimension used in the experiment as trigger event for the tsunami impact prediction system.
3.2 Tsunami Impact Prediction System Performance
To provide the complex information contained in the output visualizations in an intuitive and convenient way, the first screen output on the client monitor presents a dynamic map of the tsunami simulation result from a situation perspective, as shown in Figure 12. The second screen displays tsunami warning bulletins from a decision perspective, as shown in Figure 13. Each warning level of the affected city/regency has a specific link that provides more detailed tsunami impact prediction information, as shown in Figure 14.
Figure 12 Output visualizations of the tsunami impact prediction system: dynamic map of the related tsunami simulation result in a web GIS.
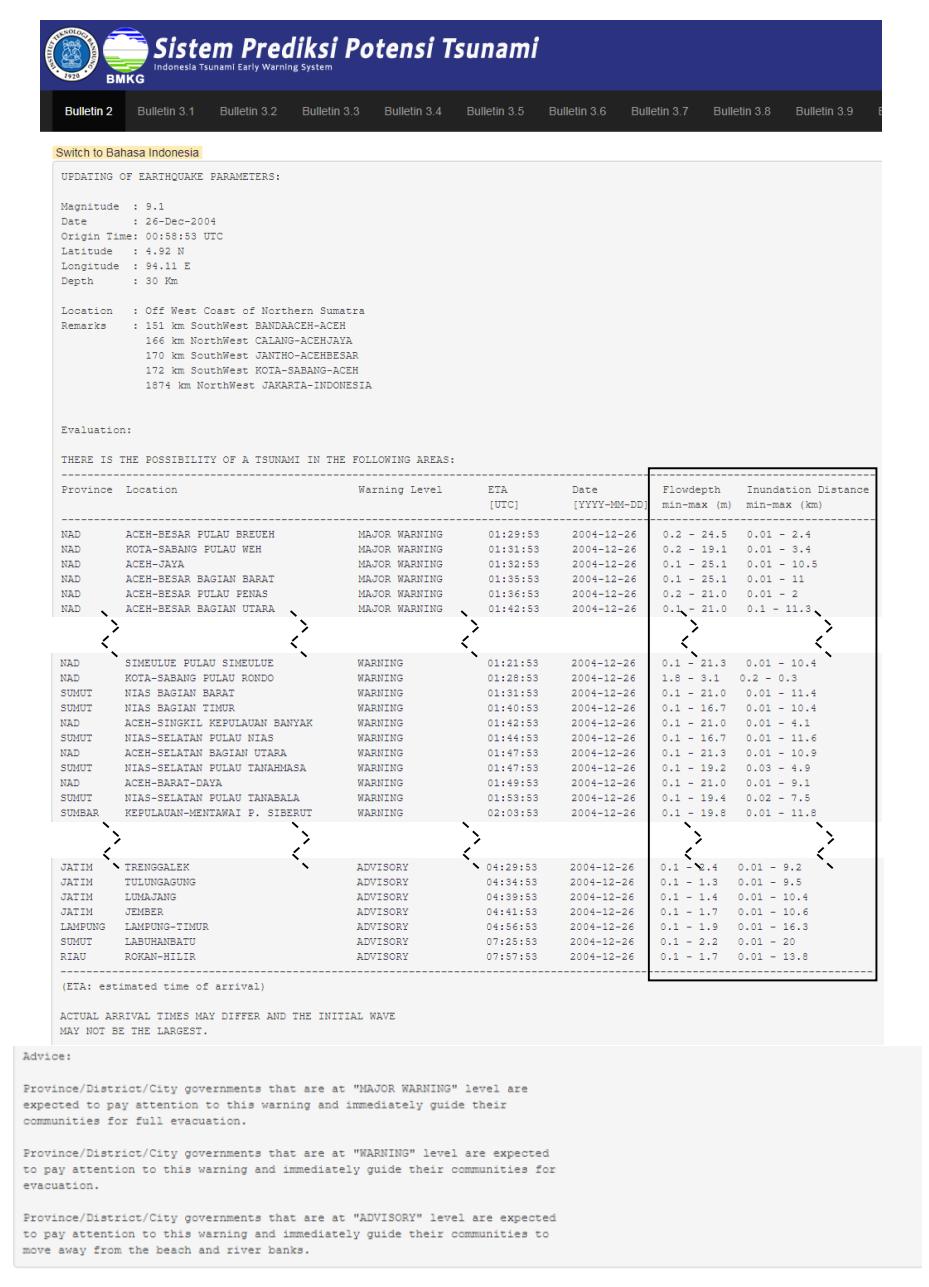
Figure 13 Output visualizations of the tsunami impact prediction system: the inundation prediction (in the rectangle) incorporated in the generated tsunami warning bulletin.
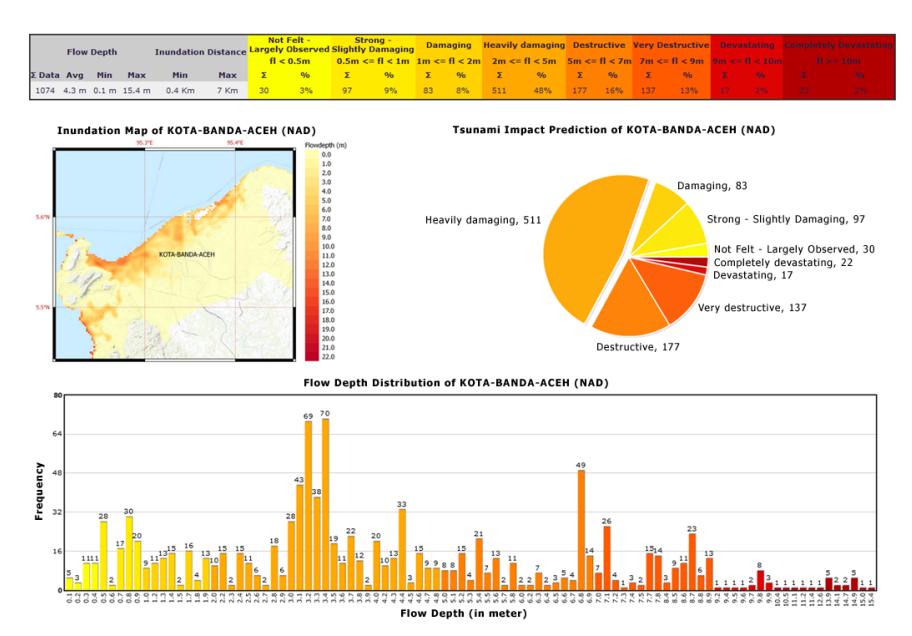
Figure 14 Output visualizations of the tsunami impact prediction system: the tsunami impact prediction for the related city/regency.
3.3 Evaluations
Various evaluations were conducted, including data set evaluation through the tsunami fragility curve, accuracy measurement of the prediction results by root mean squared error (RMSE), and a system performance evaluation.
3.3.1 Data Set Evaluation
The data set used in this research has been evaluated in a previous study by Dermadi & Bandung [21]. Figure 15 shows the tsunami fragility curve for the data set evaluation related to the Banda Aceh scenario in this study. It shows a similar trend as Koshimura, et al. [29]. There is a slight difference in the maximum inundation depth, which reached 100% of damage estimation at 8 m inundation depth, while in this research it was at 8.5 m inundation depth.
From the tsunami fragility curve in Figure 15 we can conclude that at an inundation depth of 2 m, the damage probability was below 20% and at an inundation depth of 3 m it increased to below 50%. The damage probability reached 100% at an inundation depth of 8.5 m. The overall estimated results on this fragility curve are highly positively correlated with the prediction results in this study, as shown in Figure 14.
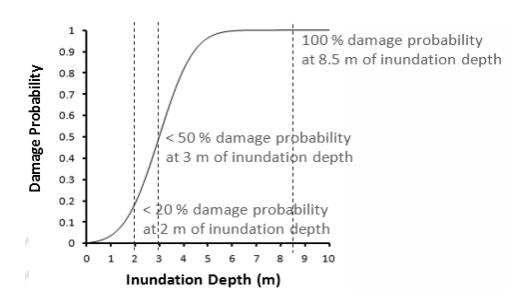
Figure 15 The tsunami fragility curve resulted from the TsunAWI inundation data.
3.3.2 Accuracy of the Prediction Results
The RMSE was calculated based on Eq. (1) between the flow depth resulted from the TsunAWI model (\(Z_{pi}\)) and the 62 point locations of the field survey measurements (\(Z_{oi}\)) conducted by Borrero, et al. [6] after the 2004 Banda Aceh Tsunami. The prediction results for Banda Aceh and surroundings are quite reliable compared to the field survey data, giving an RMSE value of 2.35, as shown in Figures 16 and 17.
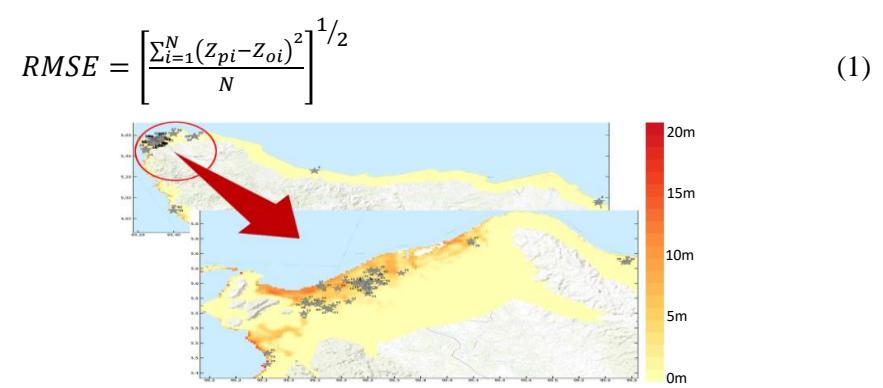
Figure 16 The 62 point locations of the field survey measurements (star marked) and the TsunAWI inundation data for Banda Aceh and surroundings.
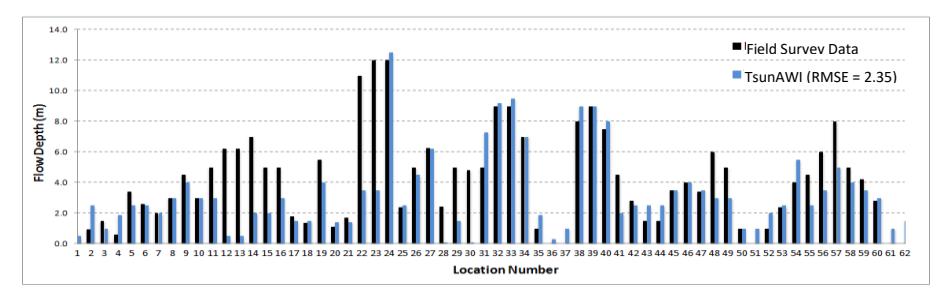
Figure 17 Comparison between flow depth and field survey measurements.
3.3.3 Tsunami Detection Algorithm Performance
The application of the tsunami detection algorithm is an additional feature of the proposed system. A simulation was conducted to examine the performance of the tsunami detection algorithm in detecting sea level anomalies using two recent case studies: a potential earthquake-tsunami in North Maluku on 14 November 2019 and a non-tectonic tsunami in the Sunda Strait on 22 December 2018. Table 3 summarizes the test results from each case, respectively. Chart visualization using free and non-commercial licenses charting from Highcharts.com is shown in Figures 18 and 19.
| Tsunami Detection Algorithm (TDA) | |||||||||
|---|---|---|---|---|---|---|---|---|---|
| TG STATION | Arrival Time (UTC) | RMS Error (m) | MaxAmplitude (m) | ||||||
| BITUNG | 14-11-2019 17:41 | 0.037 | 0.23 | ||||||
| JAILOLO | 14-11-2019 16:48 | 0.019 | 0.14 | ||||||
| TERNATE | 14-11-2019 16:48 | 0.019 | 0.13 | ||||||
| CIWANDAN | 22-12-2018 15:21 | 0.149 | 1.33 | ||||||
| SERANG | 22-12-2018 14:39 | 0.353 | 2.45 | ||||||
| KOTA AGUNG | 22-12-2018 15:47 | 0.202 | 1.09 | ||||||
| PEL PANJANG | 22-12-2018 15:56 | 0.156 | 1.26 | ||||||
Table 3 Test results for each case.
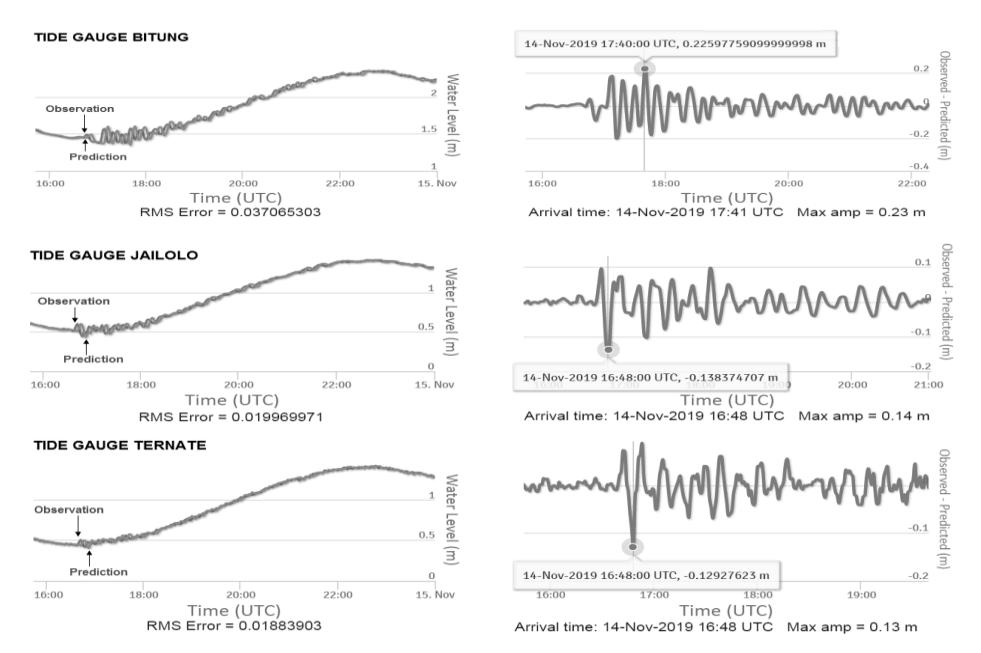
Figure 18 The tsunami detection algorithm test results for each tide gauge station in Bitung, Jailolo, and Ternate for the North Maluku potential earthquake-tsunami on 14 November 2019.
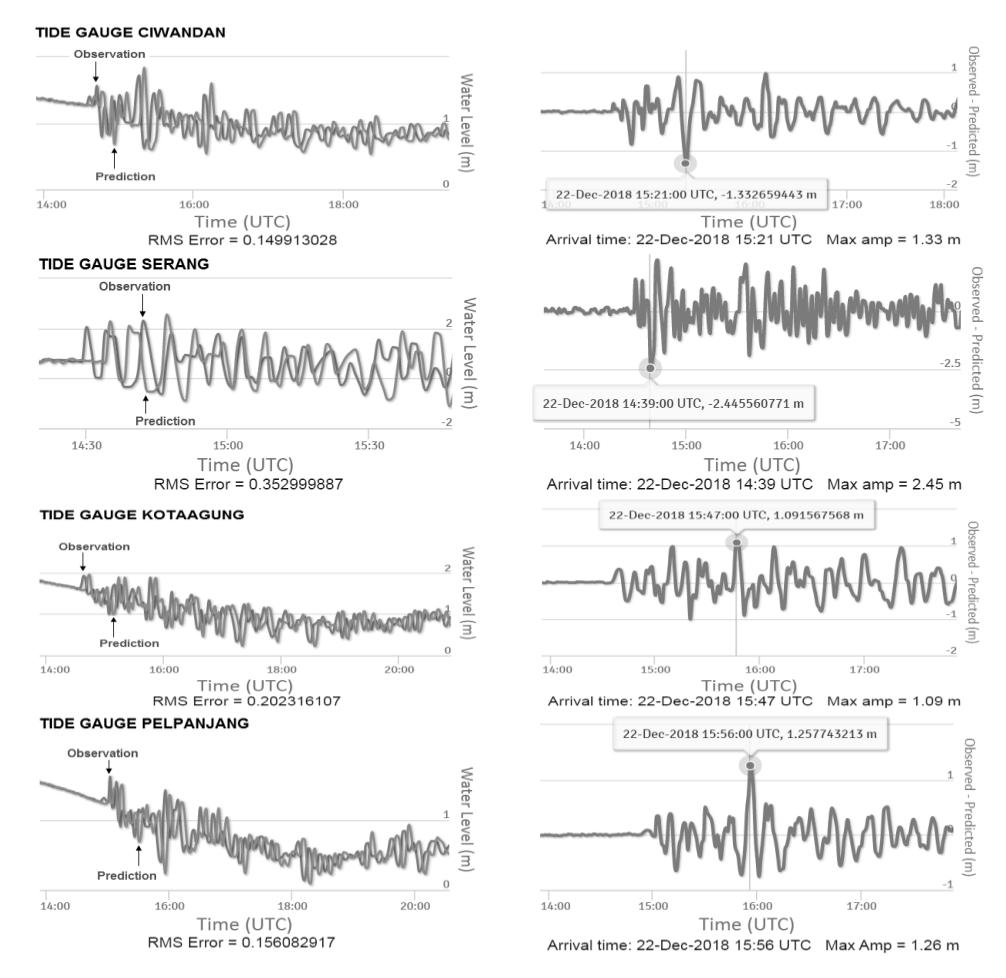
Figure 19 Test results of the tsunami detection algorithm for each tide gauge station in Ciwandan, Serang, Kota Agung, and Pelabuhan Panjang for the nontectonic tsunami event at Sunda Strait on December 24, 2018.
3.3.4 System Performance Evaluation
The execution time calculation was used to measure system performance in this study since timing behavior is very important in real-time systems [30]. The experiment was conducted five times to calculate the execution time for each system functionality as stated in Section 2.6. The execution time measurements were performed using two different methods. First, the executable of the GNU Linux time program was used to measure the execution time of the background process [31]. Second, DevTools of Chrome browser version 83.0.4103.97 (64 bit) was used to perform the execution time of the web-based visualization on the client subsystem. Table 4 summarizes the average execution time. Figure 20
shows the execution time for each system functionality and the total execution time for each experiment.
Table 4 Summary of the average execution time (in seconds) for five experiments of each system functionality.
| System Eunstienelity | Experi | -A vorege (coconde) | ||||
|---|---|---|---|---|---|---|
| System Functionality | 1st | \(2^{nd}\) | 3rd | 4th | 5th | -Average (seconds) |
| Flag messaging routine program | 0.360 | 0.340 | 0.376 | 0.394 | 0.429 | 0.380 |
| Control center routine program for tsunami | 0.357 | 0.342 | 0.380 | 0.395 | 0.428 | 0.380 |
| simulation reception | ||||||
| Subroutine program to find the specific best | 0.231 | 0.210 | 0.252 | 0.210 | 0.209 | 0.222 |
| of the inundation data from the pre- | ||||||
| calculated inundation database | ||||||
| Subroutine program to generate the tsunami | 20.745 | 20.505 | 20.567 | 20.712 | 20.527 | 20.611 |
| warning bulletin | ||||||
| Dynamic map of the tsunami simulation | 6.071 | 5.923 | 5.820 | 5.681 | 5.680 | 5.835 |
| Tsunami warning bulletin | 2.534 | 2.548 | 2.452 | 2.754 | 1.322 | 2.322 |
| Tsunami impact prediction information | 4.161 | 4.153 | 3.902 | 4.325 | 3.930 | 4.094 |
| Σ Execution Time | 34.459 | 34.019 | 33.749 | 34.472 | 32.525 | 33.845 |
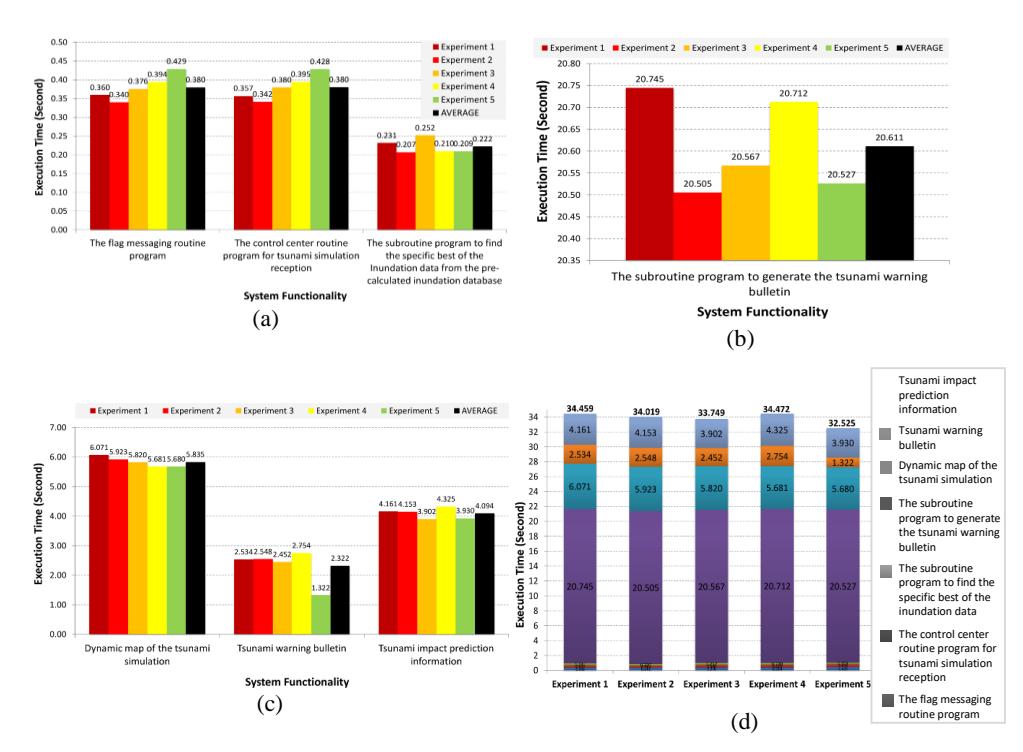
Figure 20 Execution time for each system functionality: (a) number 1-3; (b) number 4; (c) number 5-7; and (d) total execution time for each experiment.
Based on Figure 20(d), the average execution time for each system functionality was approximately 33.845 seconds. Based on this result, it can be concluded that the proposed system has good performance.
4 Conclusions
Analysis of inundation data obtained from the TsunAWI model was successfully conducted by implementing the steps as explained in this study and utilizing several approaches, namely GIS analysis, predictive analysis, and simple statistical analysis. The TsunAWI inundation data analysis generates inundation predictions and inundation distances for cities/regencies. The results are then stored in a pre-calculated inundation database. A tsunami impact prediction system was constructed and proposed in this study by applying the pre-calculated inundation database. Some evaluations were carried out to examine the performance of the proposed system. Based on the performance evaluation, it was concluded that the tsunami impact prediction system has good performance, with 33.845 seconds as the average execution time for each system functionality. Furthermore, the pre-calculated inundation database produced in this study constitutes an enhancement of the tsunami warning product of InaTEWS.
Inundation estimation depends strongly on the tsunami source model used as well as on the quality of the available bathymetry and topography data. Pre-calculated inundation products rely on simplified source models and are based on elevation data with limited accuracy. The parameters of the tsunami event from December 2004 in Banda Aceh were used in a benchmark experiment, taking advantage of the high resolution of the numerical mesh in the region. The results cannot be transferred one-to-one to the whole coast of Indonesia. The provision of highresolution inundation data is needed for all trenches around the Indonesian region, apart from Banda Aceh, Padang, Cilacap, Bali, and Lombok, to better depict future tsunami threats in the warning products. Therefore, the results for the remaining part were presented as is.
Given the lack of a pre-calculated database that is limited to seismic sources, it is important to note that the proposed system currently does not consider events that are influenced by landslides and volcanic activity. Since the TsunAWI model has limited coverage on near-field tsunamis inside NTWC area A, the proposed system cannot be used to conduct inundation and impact predictions outside this area.
Acknowledgments
We are grateful to all colleagues at the Alfred Wagener Institute (AWI) Germany, Dr. Sven Harig, Dr. Natalja Rakowsky and Antonia Immerz, for their valuable
input and discussion during this study and also to our colleagues at the Agency for Meteorology, Climatology, and Geophysics (BMKG – earthquake and tsunami warning center). We also would like to thank BMKG for providing supporting research facilities. This research was partially supported by the Ministry of Communication and Informatics (Kominfo) through the Master Degree Scholarship Program and was conducted at the School of Electrical Engineering and Informatics, Bandung Institute of Technology, Indonesia.