
1 Introduction
Breast cancer is the second most deadly form of cancer in India [1]. Out of 115,251 people affected by breast cancer, 53,592 were estimated to have died in the year 2008 [2]. The average prevalence of the disease is 22.9 for every 100,000 Indians, which is nearly one third compared to the western countries [3-4]. In 2016, the number of new cancer cases was predicted to be 1,450,000, which could cause the mortality rate to be as high as 600,000-700,000 [5-6]. The pathologist reports based on tissue investigation in clinical laboratories are also proportionate with the predicted population [7]. A report based on the Times of India Study in 2007 found that 210 out of 339 talukas (townships) in the state of Maharashtra do not have a pathologist [8].
Thus, the need for advanced and automatic image processing techniques to qualitatively analyze histopathological images is obvious. Suspicious tissue growth and the definite nature of suspected cancer cells can be confirmed through histological assessment. Histology, in a general sense, is the microscopic analysis of living tissues. More than 70% of diseases, most predominantly tumor cells, are first diagnosed through histopathology. Clinical diagnosis involves biopsy of tumor cells or tissue by a pathologist under a magnifying lens. The morphology of tissue patterns can be studied by the pathologist to identify the different stages of ailment in the tissue [9]. Computer-aided analysis could facilitate the pathologist's work and help to identify diseases better. Elston and Ellis in the NGS protocol [10] proposed that morphological patterns can be better diagnosed by analyzing histology tissue image processing techniques. Also, the computeraided analysis of tissue nuclei is a great method for distinguishing between patients with a good or bad diagnosis [11].
Image pre-processing is the primary step used to remove noise from nuclei regions and the surrounding white space. This step is implemented based on identification of morphological features from the image. The digital image preprocessing tool Contrast Limited Adaptive Histogram Equalization (CLAHE) is used to enhance the image's local contrast. CLAHE involves computing histograms for various sections of the image to distribute contrast uniformly and also defines each region of the image clearly rather than by histogram equalization. As color-based morphological features play a vital role in the distinguishing of cancer nuclei from surrounding regions, CLAHE preprocessing is required. Segmentation is another vital tool in image processing utilized to segment the nuclei region in histopathological images. This helps in extraction and further classification. It is enabled by a deep convolution neural network to detect the nucleus of tumor cells.
2 Methods
The input histopathological breast cancer images used in this study were acquired from the Databiox public access dataset. It contains 922 images in total, with three-grade classification of invasive ductal breast carcinoma and four different levels of magnification, i.e. 4x, 10x, 20x and 40x. The dataset contains 259 grade-1, 366 grade-2 and 297 grade-3 breast cancer histologic images [12].
2.1 Network Architecture
The complete network structure of the current work is illustrated in Figure 1. The structure was stirred with a convolutional residual network [13] that contains an encoding track, i.e. a convolutional network and a decoding track network. Retrieval of the desired features from the input histopathological images and transformation to a multidimensional feature vector provides feature extraction through object segmentation of the convolutional network [14]. Various scales of feature retrieval with multiple resolution levels is contained within the convolutional and residual parts. The architecture in the present work was built using several types of architectural blocks. The block shown in Figure 2 is a residual block. It consists of triple convolutional layers (filters such as 1 × 1, 3 × 3, 1 × 1 respectively) and each convolutional level is trailed by a ReLu (rectified linear unit) as activating function. A batch normalization layer is sandwiched between every convolution layer/ReLu pair, where the batch normalization layer minimizes the internal covariance shift and increases the speed of the training process.
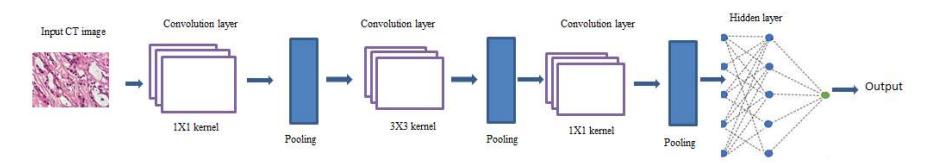
Figure 1 Deep convolutional neural network architecture.
Down sampling of the histopathological image is performed by a max pooling layer within the convolutional part for feature compression. Likewise, the input images are put together by pooling. Thus the pooling provides the pixel probability for every defined label. The ResNet-50 architecture was utilized in the present work for breast cancer segmentation. The residual block is established with a short skip connection and the convolutional part with a long skip connection in order to preserve spatial information that may be lost during the pooling operation. The previous layer is connected directly through the short skip provision rendered by the residual block. Arrangement of nested long and short connections enhances the flow of data among the various layers of the network.
The residual type of convolutional network with long and short residual layers performs end-to-end segmentation of raw histopathological image data to achieve the final segmentation result.
2.2 Deep Convolutional Neural Network
For breast cancer segmentation, transfer learning combined with a deep convolutional neural architecture is involved [15]. Arranging a greater number of stack layers allows for better distinguishing capability but is challenging during training of these networks, whereas shallow networks are comparatively easier to operate during training. Thus, increasing the number of stack layers not only leads to degradation of the network performance but also to poor convergence of the network.
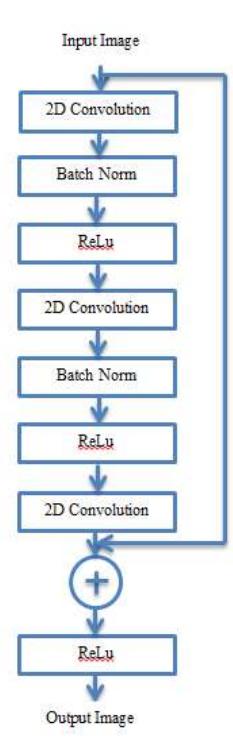
Figure 2 Residual network architecture.
This degradation problem can be overcome efficiently by incorporating hidden layer blocks, because accuracy and convergence evidently improve tasks carried out with ImageNet and MSCOCO [16]. The deep learning method involved in the deep residual network effectively solves the degradation problem and eases network optimization through skip connection and activation after addition [17].
The deep layer residual element in Figure 2 is used to build the deep neural network. A hidden layer in the deep neural unit transmits the signal between the blocks through skip connection. Every single neural layer contains triple convolutional layers with filters such as \((1 \times 1, 3 \times 3, 1 \times 1)\) and each convolutional layer followed by a batch normalization layer. The neural network is trained by learning the following function:
\[x_l + 1 = x_l + R(x_l, w_l) (1)\] where R denotes the residual function, i.e. a double convolutional layer stack accompanied with batch normalized layers as shown in Figure 2; \(x_1\) and \(x_1 + 1\)are the input and output features of the l-th ResNet unit; and \(w_l\) is a set of weights and biases associated with the l-th ResNet unit.
3 Results
Segmentation of cancer cell regions in standard hematoxylin and eosin (H&E) stained histopathological images of breast cancer tissue (and a number of other tissues) is a key finding of computer-aided review and assessment of histopathological slides. Segmentation of cancer cell regions is a basic way of automatically categorizing stained histochemical slides of tumor-holding cells. This is a safeguard against mistakenly analyzing the supporting tissue of an organ rather than tumor stromal zones. The evaluation system was created according to the manner in which pathologists analyze tumor slides, as shown in Figure 3.
Estimating the density of tubules is among the most imperative predictors to determine the grade of breast cancer. The occurrence rate of tubules formed by tumors indicates the grade of tumor distinction and also to what extent the breast cancer cells affect its surrounding regions or other normal cells. Identification of tubules in histopathology images is done by observing white or pale pink colored lumen bounded by the nuclei of cells, as depicted in Figure 4.
This color morphology and nearby lumen region with nuclei boundary helps to predict the incidence of a tubular region. However, tubular region identification with these data could lead to erroneous detection of fat or supporting tissue regions instead of tubules. This kind of tubular detection is observed manually with the interpretation of surface knowledge. Various tissue regions from the inputted breast cancer histopathological image are identified by color variations due to H&E staining (cytoplasm and connectivity = pink, lumen and fat = white, and cell nuclei = purple). Extraction of lumen nuclei along with their surrounding region is done through spatial and proximity features.
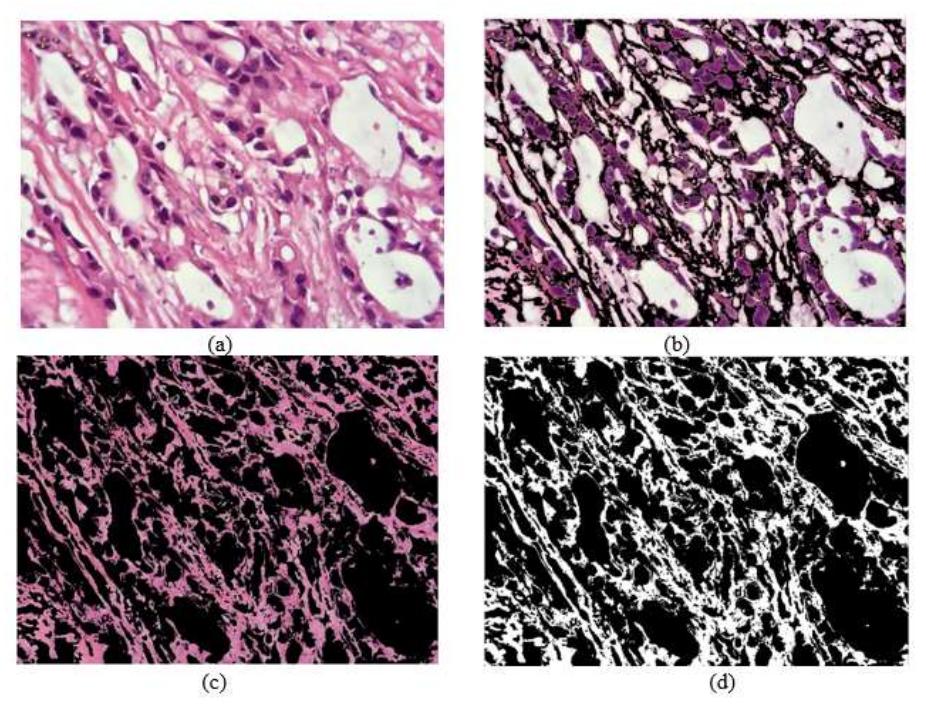
Figure 3 Clustered biopsy images: (a) normal image, (b) nuclei region, (c) stoma cells and connective region, and (d) white region.
Figure 4 Tubular region identified in a histopathological image.
3.1 Evaluation Parameters
The accuracy of the current technique can be quantitatively evaluated by using a performance measure such as the Dice coefficient (DC). This parameter helps to compute the variance between automated segmented output and manually
segmented reference standard output. DC in Eq. (2) is predicted by computing the ratio between two times the intersection of binary masks by the sum of total the number of elements in each set, i.e.
\[DC = \frac{2(A_S \cap B_m)}{|A_S + B_m|} \tag{2}\] where \(A_s\) is a binary mask created in the current method and \(B_m\) is the binary mask of the manual reference standard. DC always lies in the range of [0, 1], where 1 indicates 100% overlap and 0 indicates no overlap between output and reference standard [18,19]. Sensitivity is defined by:
Sensitivity = \[\frac{TP}{FN+TP}\] (3)
The equation for specificity is defined by:
Specificity = \[\frac{TN}{FP+TN}\] (4)
The equation of accuracy is defined by:
\[Accuracy = \frac{TP + TN}{FP + FN + TP + TN}\] (5)
where, TP is the number of true positives (actual affected nuclei identified correctly), TN is the number of true negatives (non-affected nuclei predicted as affected nuclei), FP is the number of false positives (affected nuclei not predicted as affected nuclei), and FN is the number of false negatives (non-affected nuclei predicted correctly).
The detection module is trained with a mix of histopathological images of all three grades, consisting of 554 and 368 test images. The accuracy level between the training and the test dataset is given in Figure 5.
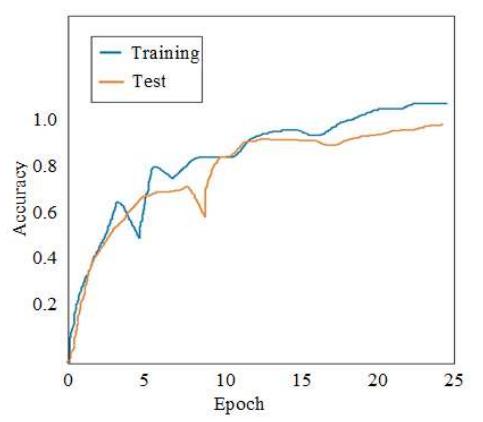
Figure 5 Validation of DCNN for the given dataset.
4 Discussion
The current work focused exclusively on the detection, segmentation and classification of regions of interest in breast tumor histopathological images. Breast tumor identification and classification was done based on heterogeneous surroundings of cancer nuclei. This synchronizes well with a previous single-cell pathology study that analyzed the stromal surroundings of the tumor [20]. Feature extraction of tumor cells using CNN with a UNET architecture that establishes long skip connections has been done in a previous study. It produced a Dice coefficient for tumor identification of 0.88 [21], while the current work achieved about 0.90. Also, the long skip connection was avoided in the current work through step-by-step adding of a deep residual CNN architecture. Based on their shape, size and appearance, the nuclei regions can be identified in H&E stained breast histopathology images using the marked point process technique [22,23]. This kind of marking process may result in misidentification of fat tissues instead of tumor regions. Comparison of classification of benign and malignant tumor images as in the current study has not been done previously. One study has previously reported the detection of mitosis cells in histopathology breast cancer images by morphological features such as color of the nuclei and cytoplasm in the tumor location. The classification of mitosis and non-mitosis was carried out to help pathologists. A detection rate of 71% was achieved based on statistical features [24].
This color morphology identification coincides well with the present study, but by incorporating deep residual convolutional training, the classification achieved better accuracy. A review study found that a complete digital workflow of histopathological breast cancer images is lacking in many places, so incorporation of artificial intelligence through deep learning algorithms could produce better results in classification and detection [25]. According to the recommendation, a deep convolutional neural network was employed for classification of tumor regions present in breast tissue. The comparison of performance metrics for sensitivity, specificity and accuracy are shown in Figures 6, 7 and 8 respectively. Specificity indicates the likelihood of a classifier that produces a negative result when disease is absent. This is also known as the true negative (TN) rate. The sensitivity analysis in Figure 6 provides the proportion of positive cases that are classified correctly and reveals the ability of the classifier to correctly predict positive cases, as shown in Figure 7. Accuracy indicates the general prediction capability of the projected deep learning model. True positives and true negatives indicate the capacity of the classifier to correctly predict the presence and absence of breast cancer. Fig. 8 compares the accuracy of several existing method and the proposed method, where the X axis represents the number of images taken for analysis and the Y axis represents the accuracy values obtained in percentage.
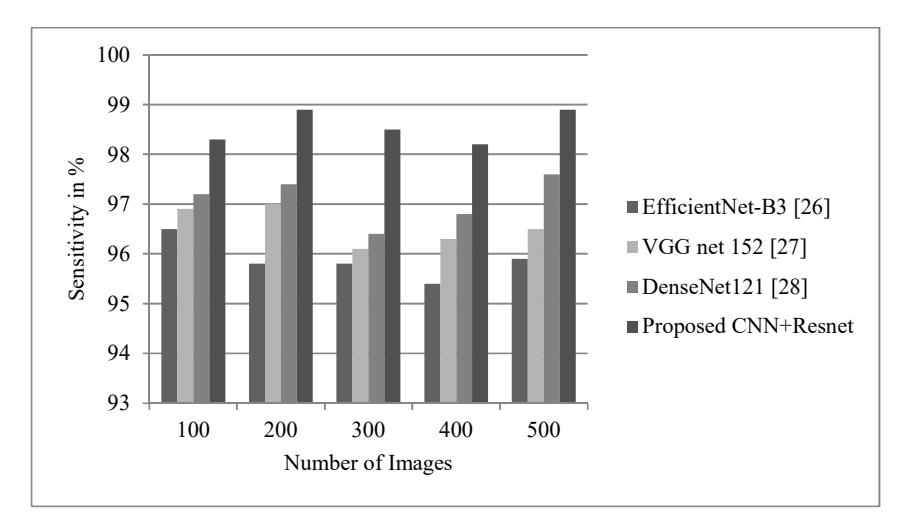
Figure 6 Comparison of the sensitivity parameter between EfficientNet, VGGNet, Densenet121 and ResNet.
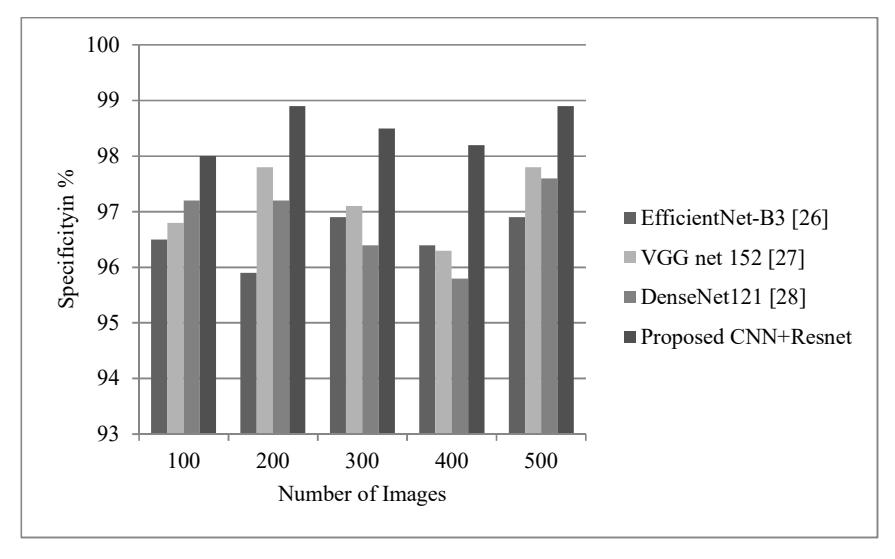
Figure 7 Comparison of the specificity parameter between EfficientNet, VGGNet, Densenet121 and ResNet.
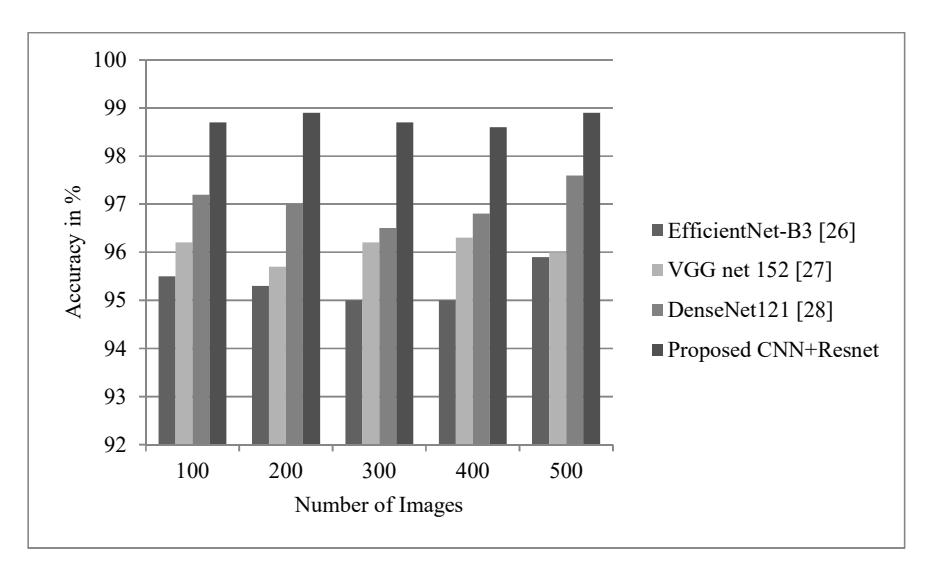
Figure 8 Comparison of the accuracy parameter between EfficientNet, VGGNet, Densenet121 and ResNet.
An early study of breast cancer classification using EfficientNet-B3 reported an accuracy level of 97%. The method was found to be image-specific, i.e. the classifier was abstractive to multi-resolution images except for its input [26]. Meanwhile, the proposed method consisting of CNN + ResNet achieved an accuracy of 98.82% for input images with four different resolutions.
The classifier with VGGNet was observed doing classification between normal and malignant breast cancer cells. It achieved an accuracy level of 96.19% and a specificity level of 93.33% [27]. The current work involved more efficient detection of multiple classes of input images with better accuracy and specificity (98.68%). A study on a DenseNet deep classifier with a pooling layer has previously been reported, using more parameters to achieve better classification with histopathological images. It had a complex sub-network with inflated model size and over-fitting network layers [28]. The present study with ResNet utilized optimum parameters in the hidden layer model to over-fitting limitations.
5 Conclusion
The present work developed an enhanced histopathological image analysis technique for segmentation and classification of objects of interests related to breast cancer, taking advantage of digital image processing to detect tumors in histopathological images. It can detect various graded breast cancer images correctly through proper segmentation while overcoming obstacles due to uneven
stacking of residual layers. Morphological features of tubular structures are detected through robust segmentation algorithms. This segmentation preceded automatic detection and extraction of nuclei and lumen regions from H&Estained breast cancer histopathological images. The classification of breast cancer nuclei as benign or malignant is achieved through a ResNet-based deep convolutional neural network. The detection and classification of tumor-affected breast nuclei regions were qualitatively analyzed in terms of Dice coefficient, specificity and accuracy.