
1 Introduction
Stereo vision is a key topic in image processing studies, including the architecture to acquire depth estimations for translating a 2D perspective into 3D scenes. The process known as stereo matching to produce disparity in the architecture relies on creating a depth map, which is being studied in order to increase the disparity accuracy. Depth maps can be applied in various methods for 3D scene reconstruction in fields such as medical imaging, virtual reality, autonomous navigation, etc. [1]. The stereo vision algorithm can be based on three types of approaches: local, global and semiglobal [2]. All techniques are structured into a basic four-stage taxonomy: matching cost computation, aggregation of cost, disparity selection, and final refinement. The simplest stereo vision computation method is a local approach using pixel-window comparison, resulting in a short execution time. Global methods use energy minimization in identifying the disparities, thus contributing to higher disparity accuracy but resulting in a longer execution time. Semiglobal methods are a trade-off between the local and global approaches.
Stereo correspondences produced by matching are commonly affected by image noise such as illumination variation, blurry boundaries, and radiometric differences. In this work, a new algorithm with local composition is proposed to focus on these issues and acquire an accurate disparity map from the stereo correspondence process. The Middlebury dataset, consisting of 15 stereo image pairs, was used as evaluation platform [3]. The pre-processing step applies two different techniques: the weighted adaptive histogram equalization of CLAHE, and AGCWD. Low texture and edge regions are enhanced and smoothed by applying a guided filter (GF). CLAHE and AGCWD were selected because they operate on small image tiles to improve contrast, especially at large surfaces and blurry edges. The cost value is determined during pre-processing using the census transform (CT) in the matching cost step, followed by aggregation using the fixed-window and GF techniques. A winner-takes-all (WTA) approach is employed to select the minimum disparity map value and final refinement is done using left-right (LR) consistency checking along with a weighted median filter (WMF) to remove outliers.
The remainder of this article is structured as follows. Section 2 describes the enhancement architecture, Section 3 explains the algorithm's methodology and the result is discussed in Section 4. Finally, Section 5 concludes the work.
2 Image Enhancement Model
A constraint in the generated color image is that it is often comprised by noise from bad illumination conditions and an undesirable environment [4]. Poor lighting, non-uniform light and sudden changes in light are factors that cause poor contrast and blurred image details, resulting in challenges in obtaining and analyzing the information from images [5]. The weighted adaptive histogram equalization technique in the CLAHE method focuses on small regions in the image, defined as tiles, instead of the entire image, other than traditional histogram equalization methods used for image enhancement [6]. The parameters used in CLAHE set a threshold for contrast, limiting so-called clipping and improving surface textures in the image without sacrificing edge textures.
The implementation of CLAHE is initialized by decomposition of the original image into several rectangular blocks [7]. The next stage is to implement
histogram block fine tuning, involving histogram creation, clipping, and distribution, followed by obtaining the cumulative distribution function (CDF) and the probability density function (PDF) values. Bilinear interpolation between blocks is employed for equalization mapping to remove artefacts within the blocks and prevent their visibility in boundary regions. A series of segmentations and Rayleigh shape distributions creates 180 bins of bell-shaped histograms. A clipper point is then applied to limit histogram peak values in each histogram block to control the level of contrast. The clipper acts as an essential controller to prevent image saturation, especially in homogeneous regions. Each gray level is redistributed by clipped pixels. The clipping point is calculated as follows [8]:
\[B = \left(\frac{M}{N} \left(1 + \frac{(\alpha(S_{max}))}{100}\right)\right) \tag{1}\]
The block of pixels is represented by M and the dynamic range of the block is indicated by N. The clip factor and maximum slope are denoted as \(\alpha\) and S. The clipper value is adjusted at 9 x \(10^{-3}\), which is the optimal value for acquiring acceptable contrast adjustment based on several experiments. The CDF and PDF produced from the clipped peak histogram are used in the mapping function to remap the gray level block as formulated in Eq. (2):
\[CD F(I) = \sum_{k=0}^{I} PDF(I)\] (2)
\[T_{map}(I) = CDF(I) x I_{max}\] (3)
The remapping role is denoted as \(T_{map}(I)\), where I is the level of gray pixels and \(I_{max}\) is the maximum number of block pixels. Therefore, it is critical to consider blocking artefacts based on the interpolated value of each pixel from the adjacent blocks' mapping function. The blocks are remapped based on bilinear interpolation in the mapping function as follows:
\[T_{map}(p(i)) = m \cdot (n \cdot T_a \cdot p(i) + (1 - n) \cdot T_b \cdot p(i)) + (1 - m) \cdot (n \cdot T_c \cdot p(i)) + (1 - n) \cdot T_d \cdot p(i)\] (4)
\[\text{[rumus tidak dapat ditampilkan dengan baik — lihat PDF asli]}\] (5)
where a, b, c, and d represent the center pixel blocks and p denotes arbitrary pixels around the blocks. \(T(\cdot)\) signifies the remapping role of the four blocks of pixels, \(T_a\), \(T_b\), \(T_c\) and \(T_d\), where p(i) is an arbitrary pixel value i along the x, y coordinates. The interpolation contributes to remove blocking artefacts with low computing cost.
The issue of manual adjustment of the gamma value in image quality enhancement can be solved with the AGCWD approach [9]. The algorithm automatically obtains the values based on the implementation of a weighted
distribution function. The gamma correction transform-based equation and the proposed AGCWD are derived in Eq. (6) and Eq. (7):
\[T_C(I) = I_{max} \left(\frac{I}{I_{max}}\right)^{\gamma} = I_{max} \left(\frac{I}{I_{max}}\right)^{1 - CDF(I)}\] (6)
The parameter for the weighted distribution is:
\[PDF_{w}(I) = PDF_{max} \left( \frac{PDF(I) - PDF_{min}}{PDF_{max} - PDF_{min}} \right)^{\alpha}\] (7)
where \(PDF_{min}\) and \(PDF_{max}\) are the minimum and maximum statistical histogram of the PDF based on histogram evaluation, while the parameter for weighted adjustment is denoted by \(\alpha\). In this work, the value of \(\alpha\), determined as 0.5, is the optimal solution to be reached using the CLAHE technique. The next stage is to determine the CDF value based on Eq. (8).
\[CDF_{w}(I) = \sum_{l=0}^{I_{max}} PDF_{w}(I) / \sum PDF_{w}\] (8)
The sum of \(PDF_w\) can be calculated as follows:
\[\sum PDF_w = \sum_{l=0}^{I_{max}} PDF_w(l)\] (9)
Finally, to increase the generality of the results, the gamma parameter based on the CDF is modified as follows:
\[\gamma = 1 - CDF_w(I) \tag{10}\]
This is a vital functionality for the HE to map the output gray level from the input gray level, which is a level transformation function based on the CDF.
3 Methodology
The proposed stereo vision algorithm consists of five stages, as depicted in Figure 1. The process starts with the pre-processing step for color image condition improvement utilizing the combination of CLAHE and AGCWD with GF. CLAHE and AGCWD work on small regions rather than the entire image, thus improving the image enhancement. After that, matching cost computation is done by employing the CT method. The third stage produces the aggregated cost from the matching cost computation utilizing the fixed-window and GF methods. In disparity optimization, a WTA is utilized to optimize the disparity map. Left-right consistency checking with WMF is used in the final disparity refinement to eliminate the remaining noise and conduct map smoothing.
The pre-processing stage with CLAHE and AGCWD to enhance original images from the Middlebury platform is shown in Figure 2. The images comprise the parameters disparity level, resolution, dimension and camera calibration [10].
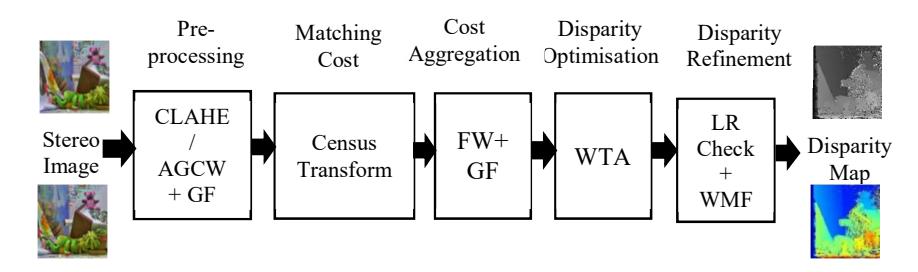
Figure 1 Taxonomy of the proposed algorithm.
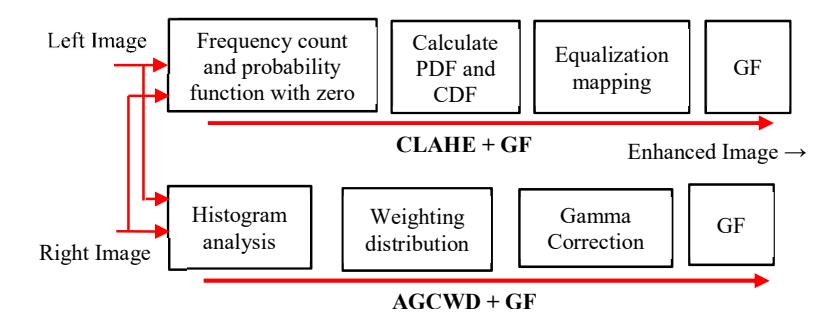
Figure 2 The pre-processing stage based on CLAHE + GF and AGCWD + GF.
A GF smoothing filter is used to improve the quality of surfaces and edge areas. A census approach of local transform using the CT method is operated between the local intensity of neighboring pixels with the center pixel in the census window applied in the matching cost computation [11]. CT works on the stereo pair images considering the images as a fixed census window. The window size is defined as \((2m+1) \times (2n+1)\). The window size is fixed at \(9 \times 7\) so the transform can be determined as follows:
\[T(x,y) = n \otimes i = -n m \otimes i = -m \xi(I(x,y), I(x+i,y+i))\] (11)
where I(x,y) is the intensity of pixel (x,y). The operator \(\bigotimes\) describes bit-wise catenation. The relationship function \(\xi\) is determined as follows:
\[\text{[rumus tidak dapat ditampilkan dengan baik — lihat PDF asli]}\] (12)
where \(q_1 q_2\) are the center pixel and a closely neighboring pixel. The distance and difference between the census value of both transform vectors can be estimated applying the Hamming distance function as expressed in Eq. (13):
\[C_d(x,y) = Hamm(T_l(x,y), T_r(x-d,y))\] (13)
The disparity is defined by d and \(T_1\), \(T_r\) represent both transform vectors. The cost value of all candidates in the matching cost computation between the reference and the target image is aggregated in the cost aggregation stage. A square-fixed-window aggregation employing the box filter method is implemented [12]. The square-fixed-window size applied is \((2r + 1) \times (2r + 1)\) for r = 2, which sets the windows size to 5 x 5 so that the cost aggregation value is computed as in Eq. (14) and Eq. (15):
\[T^{r}(u, v, d) = \frac{1}{2r+1} \sum_{m=-r}^{r} C(u+m, v, d)\] (14)
\[A_{square}^{r}(u, v, d) = \frac{1}{2r+1} \sum_{n=-r}^{r} T^{r}(u, v + n, d)\] (15)
T keeps the intermediate results of the cost matrix. A well-rectified stereo image pair shows the same height and width at the corresponding epipolar lines. The aggregated cost is smoothed with the GF to remove noise from the texture while preserving sharp edges at the boundaries. The usage of the WTA strategy is able to enhance the corresponding value as utilized in [13] by choosing a minimum aggregated pixel value, thus producing a more accurate disparity map. However, the WTA strategy still produces errors and noise in low-texture and occlusion areas. The WTA formula is given by Eq. (16):
\[d = arg \ arg \ min_{d \in d_r} CA \ (p, d) \tag{16}\] where d is the selected minimum aggregated cost value. The cost aggregation volume is represented by CA(p,d) from Eq. (16) and indicates the range of acceptable disparity values.
The final step of the algorithm consists of the disparity refinement stage. It involves a number of sequential processes: invalid disparity detection, occlusion handling, and filtering. Outlier locations and occlusion are perceived using the left-right consistency check. The result of the left-right check are the outlier locations producing inconsistent disparity values among the two maps [14]. A similar strategy employed in [15] and [16] is employed for the location of disparity point p. The equation is formulated as follows:
\[\text{[rumus tidak dapat ditampilkan dengan baik — lihat PDF asli]}\] (17)
where \(d_{RL}\) signifies the right reference and \(d_{LR}\) is the left reference of the disparity map. The disparity map consists of the locations of outliers. The value of \(\tau_{LR}\) is fixed to zero to aim for minimum error in the disparity map [16]. Unnecessary remaining noise can be removed using WMF [17]. WMF attains an impressive accuracy level in noise removal. Corresponding to Eq. (17), the weight B(p, q) of the bilateral filter is adjusted to the total histogram h(p, dr), contributing to Eq. (18):
\[h(p,d_r) = \sum_{q \in W_p \mid d(q) = d_r} B(p,q)\] (18)
where dr indicates the disparity range, and wp signifies the window size with an r x r radius at the center p pixel. The median h(p, dr) value is the refined final disparity value of d′ expressed in Eq. (19):
\[d' = med\{h(p, d_r)\}\tag{19}\]
4 Result and Discussion
The result in this work was obtained from executing the proposed algorithm. Experiments were implemented on a Windows 10 platform desktop PC with a 3.2 GHz processor with 8 GB RAM. Stereo images from the standard Middlebury dataset were used to evaluate the disparity accuracy level based on 15 sets of training images. The image enhancement performance was first compared through quality parameters such as entropy, MSE, PSNR and histogram distribution [18]. The disparity accuracy level was determined according to the number of bad pixels in non-occluded regions (nonocc) and all pixels (all). The performance result of several images in terms of entropy, MSE and PSNR is shown in Table 1.
Table 1 Entropy, MSE and PSNR performance of several Middlebury images.
| Entropy | MSE | PSNR | ||||||||||
|---|---|---|---|---|---|---|---|---|---|---|---|---|
| Img Type | CL | AG | CL + GF | AG + GF | CL | AG | CL + GF | AG + GF | CL | AG | CL + GF | AG + GF |
| Adi | 7.2 | 7.7 | 7.2 | 7.7 | 0.25 | 1.97 | 0.25 | 1.96 | 24.0 | 15.1 | 24.0 | 15.2 |
| ArtL | 7.6 | 7.8 | 7.6 | 7.9 | 0.36 | 1.50 | 0.36 | 1.48 | 22.5 | 16.3 | 22.5 | 16.4 |
| Jade | 7.5 | 7.5 | 7.4 | 7.5 | 0.59 | 0.59 | 0.58 | 0.59 | 20.4 | 20.4 | 20.4 | 20.4 |
| Moto | 7.7 | 7.9 | 7.7 | 7.9 | 0.41 | 1.30 | 0.42 | 1.29 | 22.0 | 16.9 | 21.8 | 17.0 |
| Ted | 7.7 | 7.8 | 7.6 | 7.8 | 0.41 | 1.15 | 0.42 | 1.16 | 21.9 | 17.5 | 21.8 | 17.4 |
| Vint | 7.5 | 6.5 | 7.4 | 6.0 | 0.95 | 0.46 | 0.96 | 0.47 | 18.3 | 21.5 | 18.3 | 21.3 |
| Avg | 7.5 | 7.6 | 7.5 | 7.6 | 0.50 | 1.21 | 0.50 | 1.20 | 21.4 | 17.6 | 21.4 | 17.6 |
CL denotes CLAHE while AG denotes AGCWD. The result revealed that the weight distribution and equalization offer good performance by providing an entropy value that is almost equal to that of the original images, i.e. AGCWD (101.3%) and AGCWD + GF (101.3%), and CLAHE (100%) and CLAHE + GF (100%), which is excellent for image enhancement. These findings demonstrate the importance of weight distribution adjustment to preserve the information in the image.
A related key finding is that CLAHE produced a significant improvement in PSNR performance compared with AGCWD, at 21.9% and 21.6% when combined with GF. CLAHE also contributed to a lower MSE value, at 41.3% and 41.8% with GF implementation.
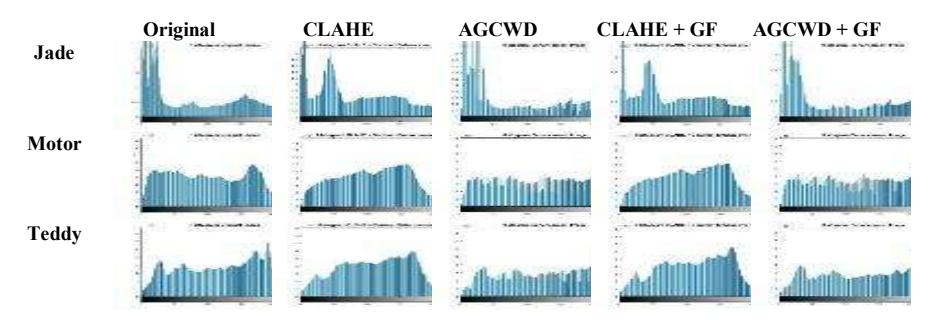
Figure 3 Left image histogram distribution of Jadeplant, Motorcycle and Teddy.
The initial histogram quantitative analysis for three images (Jadeplant, Motorcycle and Teddy) shows the specific histogram distribution for each original image, as shown in Figure 3. The implementation of CLAHE and AGCWD contributed to a slight amount of plateau distribution compared to the original image histogram distribution. The guided filter applied in this work contributed to a much more uniform histogram distribution, and changed the intensity mean so that a better contrast was generated. The produced histogram distribution of CLAHE had lower intensity than the original histogram distribution due to HE equalizing the input image histogram, resulting in a loss of some intensity; however, in AGCWD, the technique preserved the intensity.
Figure 4 shows a visual comparison of the image contrast enhancement based on the Jadeplant, Motorcycles and Teddy images. CLAHE improved both image contrast and pixel values but produced halo artefacts. Halo artefacts come from over-stretching of the histogram, which is very apparent along firm edges. Additionally, tone distortion is not tolerable in contrast enhancement. AGCWD had quite good performance. It is resilient due to weighting distribution usage on the gamma correction, preserving the image brightness close to the original image as compared with CLAHE. The experiments showed that the guided filter was effective and efficient in detail enhancement to eliminate or reduce noise effects without blurring the image boundaries. The parameters utilized in the stereo vision algorithm were used to investigate the effectiveness of the pre-processing step with matching cost combination. A census cost computation strategy, i.e. census transform, was performed with the same parameter conditions as for the block diagram. Figure 5 displays the Jadeplant, Motorcycle and Teddy left images, ground truth and the disparity assessment produced by Middlebury evaluation. Object scenes placed at increasing depth are specified step by step to disparity values based on the disparity maps. The final value is indicated from closer to farther according to the color assignment. The result shows that the proposed method performed well around low texture regions and at the boundaries indicated by the red circles.
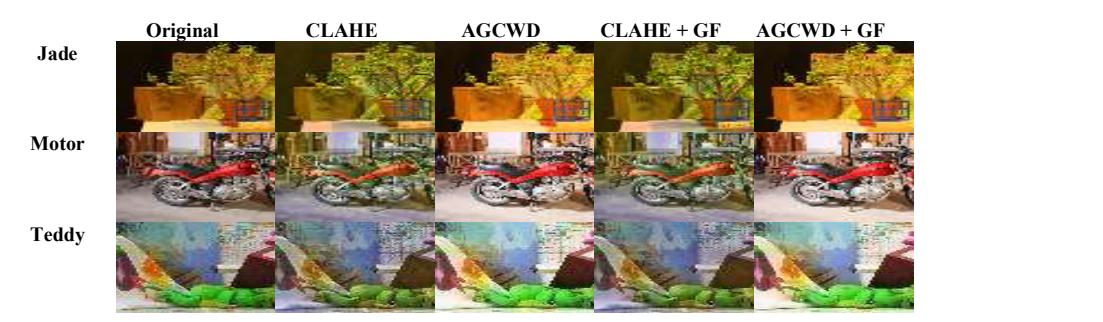
Figure 4 Enhanced left images of Jadeplant, Motorcycle and Teddy.
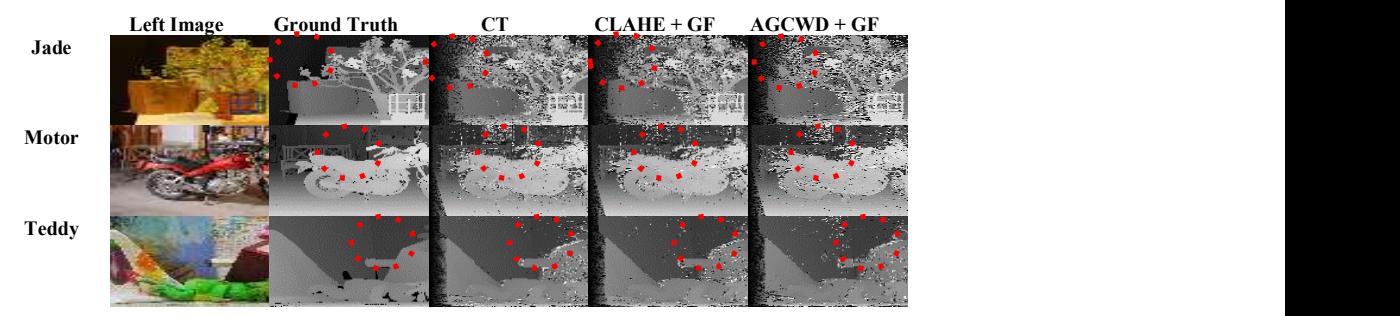
Figure 5 Middlebury evaluation of the disparity maps of Jadeplant, Motorcycle and Teddy.
Figure 6 shows a disparity map comparison for Motorcycle, Playtable and Vintage between two established algorithms, Simultaneous Edge Drawing Disparity (SED) [19] and Max-Tree Stereo (MTS) [20], and the proposed method. The disparity map indicates only minimum streak artefacts, which commonly occur in the local stereo method. The algorithm worked well at discontinuity and occlusion regions, as shown around the red box marking. It is trickier and more challenging to execute the algorithm on larger low-texture areas because of similar intensity levels among pixels.
Table 2 presents the bad pixel error percentage performance from the Middlebury evaluation. It indicates that the algorithm had better accuracy than SED and MTS (i.e. with a weight average difference for nonocc = 1.5 ~ 2.9, all = 2.0 ~ 5.2), especially for the images containing edge structures. The outcomes of the algorithm were among the lowest average error numbers, which indicates the competitiveness of the proposed algorithm's performance.
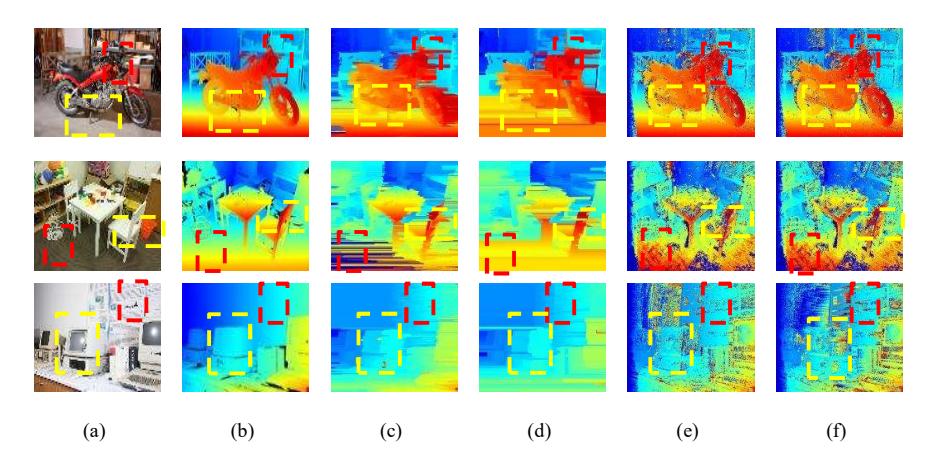
Figure 6 Disparity maps for Motorcycle, Playtable and Vintage images: (a) left image, (b) ground-truth, (c) SED, (d) MTS, (e) CLAHE + CT, (f) AGCWD + CT.
Table 2 Bad pixel errors in nonocclusion regions and all errors from the Middlebury evaluation.
| SED | MTS | CLAHE + CT | AGCWD + CT | ||||||
|---|---|---|---|---|---|---|---|---|---|
| Method | Nonocc % | All % | Nonocc % | All % | Nonocc % | All % | Nonocc % | All % | |
| Adiron | 23.7 | 25.1 | 17.2 | 19.0 | 19.1 | 23.4 | 19.1 | 23.4 | |
| ArtL | 15.6 | 17.1 | 17.3 | 22.5 | 9.78 | 27.4 | 10.8 | 27.7 | |
| Jadepl | 106 | 123 | 107 | 123 | 42.6 | 64.5 | 48.3 | 69.6 | |
| Motor | 18.3 | 20.6 | 14.8 | 17.5 | 3.09 | 16.8 | 14.5 | 18.1 | |
| MotorE | 17.7 | 19.7 | 18.3 | 20.7 | 3.27 | 17.0 | 10.7 | 18.3 | |
| Piano | 17.7 | 18.1 | 12.4 | 13.0 | 16.8 | 21.3 | 18.1 | 22.5 | |
| PianoL | 29.7 | 29.5 | 32.0 | 32.0 | 30.0 | 33.4 | 31.0 | 34.4 | |
| Pipes | 28.5 | 34.1 | 22.4 | 29.4 | 12.5 | 26.3 | 14.9 | 28.3 | |
| Playrm | 21.3 | 22.8 | 21.9 | 26.9 | 24.2 | 39.5 | 24.3 | 39.6 | |
| Playt | 18.2 | 18.8 | 25.9 | 27.4 | 31.6 | 37.3 | 33.2 | 38.7 | |
| PlaytP | 15.9 | 16.5 | 10.3 | 12.0 | 13.7 | 20.3 | 15.1 | 21.5 | |
| Recyc | 16.2 | 16.8 | 16.4 | 17.5 | 15.3 | 19.2 | 18.9 | 22.4 | |
| Shelvs | 14.4 | 15.1 | 11.47 | 12.1 | 25.3 | 27.2 | 25.6 | 27.4 | |
| Teddy | 6.65 | 7.26 | 6.96 | 8.11 | 7.68 | 16.5 | 9.89 | 18.6 | |
| Vintge | 31.6 | 33.8 | 25.2 | 27.2 | 70.3 | 73.8 | 72.2 | 75.4 | |
| Avg | 25.4 | 27.9 | 24.0 | 27.2 | 22.5 | 30.9 | 24.2 | 32.4 | |
5 Conclusion
This paper presented several pre-processing methods employed in a stereo vision algorithm by integrating CLAHE and AGCWD with GF for image enhancement. These methods exhibited an impressive improvement in image enhancement and disparity map accuracy. The employment of matching costs computation was robust against illumination variation by identifying regions with intensity differences. The smooth GF included in the algorithm increased the efficiency and preserved object edges. The disparity maps result proved that the algorithm's accuracy was improved significantly compared with several other established stereo vision algorithms.
Acknowledgement
This work was supported by Universiti Teknikal Malaysia Melaka (UTeM) and the Centre for Research and Innovation Management (CRIM) with research grant no. PJP/2020/FTKEE/TD/S01726.