
1 Introduction
1.1 The Problem
According to statistics of Common Vulnerabilities and Exposures (CVE) [1,2], in 2020 and the first six months of 2021, the world saw a record number of exploited software security vulnerabilities. Through those statistics, one can see the threats computer users are facing. The studies [3-5] defined common software vulnerabilities such as pointer vulnerability, buffer overflow, etc. The studies [3- 7] proposed several approaches for detecting security vulnerabilities, including vulnerability analysis on architecture level; static vulnerability analysis of source code and executable programs; architecture analysis based on graph theory; and information flow control. The two main approaches to classifying security
vulnerabilities are detecting based on known CVEs and using behavior analysis techniques [6- 8]. Ref. [6] pointed out that behavior-based detection approaches have been proven highly effective in detecting known software vulnerabilities. Regarding security vulnerability detection based on behavior analysis methods, there are two approaches, those based on machine learning algorithms and those based on deep learning models [3,6]. Ref. [3] presents a number of difficulties and challenges for software security vulnerability detection based on machine learning and deep learning algorithms. The main difficulty is the problem of defining abnormal behavior indicating software vulnerabilities. In the real world, it is difficult to calculate, synthesize and extract abnormal behaviors indicating vulnerabilities based on a single definition because software is designed based on different programming languages and because the characteristics of the vulnerabilities are different. In other words, no abnormal behavior is the same for all vulnerabilities.
To solve this problem, this paper proposes a new approach for the task of detecting software security vulnerabilities. This study used the Word2vec model to normalize and aggregate data, and the RF algorithm to detect security vulnerabilities. Instead of trying to extract or define abnormal behaviors indicating vulnerabilities, this proposal seeks ways to normalize and aggregate data and then taking them as the basis for analyzing abnormal behaviors.
This paper is organized as follows. After the introduction in Section 1, Section 2 lists some related studies on the problem of detecting security vulnerabilities. Section 3 presents the architecture of the proposed model as well as ways to analyze and evaluate security vulnerabilities. Section 4 gives experimental results to evaluate the effectiveness of the proposed method. Finally, the conclusion describes and re-evaluates the results and provides future research directions.
1.2 Contributions of Paper
The practical and scientific significance of our paper includes:
- 1. A novel security vulnerability detection model is proposed that is based on embedding techniques and the RF machine learning algorithm. Specifically, instead of trying to extract anomalous behavior indicating software vulnerabilities, this study developed a way to analyze and normalize a program or software and then use a classification algorithm to determine whether the program or software is safe or contains vulnerabilities.
- 2. The Word2vec algorithm is used for data normalization. As described above, the program or software is preprocessed to look for abnormal signs and behaviors indicating software vulnerabilities. The originality of our proposal is that instead of trying to extract abnormal behaviors, an embedding technique is used to aggregate and normalize the data. This is a new
approach that has only been applied and evaluated by a small number of studies in different contexts.
2 Related Works
Tingyang Gu, et al. [4] have proposed a method for detecting software vulnerabilities based on information about the software's flow. Specifically, the authors proposed several different steps. Firstly, building the definition of information flow vulnerability in software architecture with corresponding security policies. Then, propose a method for constructing service invocation diagrams based on graph theory to depict the information flow. Then use an algorithm for vulnerability determination to identify architecture-level vulnerabilities. Finally, conduct experiments to verify the effectiveness and feasibility of the proposed methods. Refs. [5,6] present an approach for software vulnerability detection based on a deep learning method. Ref. [7] introduced Bin2vec using Graph Convolutional Networks (GCN) and computational program graphs in order to learn a high-dimensional representation of binary executable programs. Similar to this approach, the authors in Ref. [8] proposed to use a GCN deep learning graph network. In particular, signatures of vulnerabilities in source code learn relationships between nodes and edges from their graph representation. Then, a gated graph neural network is trained by using several such graphs to automatically extract templates differentiating the graph of a vulnerable sample from a normal one. Jacob, et al. [9] proposed a method for automatically finding software security vulnerabilities based on machine learning methods. Some proposed algorithms and methods for C/C++ vulnerability detection used a convolutional neural network (CNN), bag-ofwords, etc. Ref. [10] proposed the idea of using deep learning to detect and modify software security vulnerabilities. Refs. [11-14] proposed methods to detect software security vulnerabilities based on architecture level. Refs. [16-22] proposed approaches for detecting security vulnerabilities based on static vulnerability analysis of source code and executable programs. Refs. [27-31] proposed methods combining deep learning with graph analysis for the task of detecting software security vulnerabilities using C, C++, Java, etc.
3 The Method for Detecting Vulnerabilities
3.1 The Proposed Model
Figure 1 shows the software vulnerability detection model architecture. From Figure 1 it can be seen that to detect security vulnerabilities in software three main tasks must be performed:
- 1. Split functions. In this step, the software with detailed code is normalized to separate each function of the software. The implementation of this process is presented in detail in the next sub-section.
- 2. Normalize functions. In this step, after the functions have been successfully split, the proposed method analyzes and normalizes them to homogenize the length of each function.
- 3. Evaluate functions. This is the process of evaluating and concluding security vulnerabilities for each function. To accomplish this purpose, this study proposes to use machine learning and deep learning algorithms.
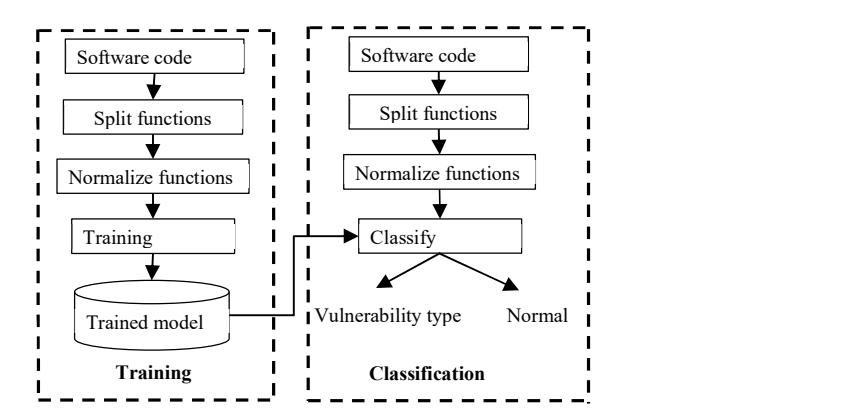
Figure 1 The architecture of the security vulnerability detection model.
3.2 Splitting Functions
To put the data into machine learning models, the data set must be in the numeric vector format with a certain length. This study used the SySeVR framework [23] to parse C/C++ programs into individual functions. SySeVR analyzes C/C++ programs according to the model shown in Figure 2. Example of splitting functions from a C/C++ program is shown in Figure 3.
To get the set of semantic features of vulnerabilities, this study leveraged rules on C/C++ software vulnerabilities of the third-party software Checkmarx instead of using open-source software (open-source software for vulnerability detection such as RATS or Flatfinder usually only have a simple analyzer and an incomplete rule set). Vulnerabilities can be divided into three main categories:
1. Array usage vulnerabilities. These are array-related vulnerabilities (e.g., improper use of accessing array elements, array address arithmetic, address transfer as a function parameter).
2. Pointer usage vulnerabilities. These are pointer-related vulnerabilities (e.g., improper use of pointer arithmetic, referencing, address transfer as a function parameter).
Arithmetic expression vulnerabilities. This vulnerability type is usually related to memory. When the input data or operations in the program generate a big number, it may exceed the memory area that stores it.
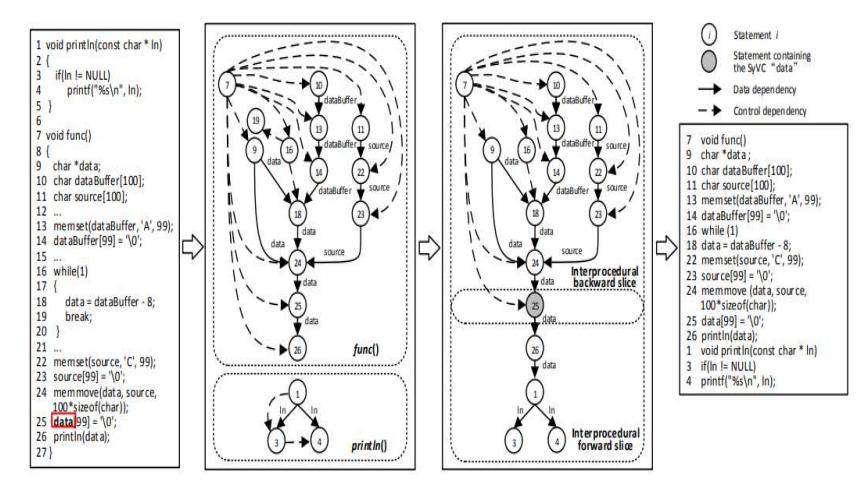
Figure 2 Data processing process.
Figure 3 Example of splitting functions from a C/C++ program.
3.3 Data Normalization
Based on the functions analyzed in the above section, this study will normalize these functions to put them into the classification model. To accomplish this task, this study proposes to use the Word2vec model. The Word2vec model was created in 2013 by Mikolov [24]. The dimension of Word2vec is much smaller than that of one-hot encoding. The dimension is \(N \times D\), where N is the number of documents and D is the dimensionality of word embedding. Word2vec has two models, skip-gram and continuous bag-of-words (CBOW). This paper only used the skip-gram model to analyze and normalize the functions. In the skip-gram model, each word is represented by two d-dimensional vectors to calculate the conditional probability. Suppose the index of a word in a dictionary is i, and the word's vector is represented as \(v_i \in \mathbb{R}^d\) if the word is the target word (the center word), and \(u_i \in \mathbb{R}^d\) if the word is a context word. Let c and o be the indexes of the target word \(w_c\) and the context word \(w_o\) in the dictionary, respectively. The conditional probability of generating the context word for a given target word is calculated by the softmax operation on the dot product of the vectors
\[P(w_o \mid w_c) = \frac{\exp(\mathbf{u}_o^T \mathbf{v}_c)}{\sum_{i \in V} \exp(\mathbf{u}_i^T \mathbf{v}_c)} \tag{1}\] where, the index set in the dictionary is \(V = \{0,1,...,|V|-1\}\). Suppose, in a document with length T, the word at time step t is denoted as \(w^{(t)}\). Assume that the context words are generated independently of the given target word. When the context window size is m, the likelihood of the skip-gram model is the joint probability of generating all context words with any given target word.
\[\prod_{t=1}^{T} \prod_{-m \le j \le m, j \ne 0} P(w^{(t+j)} | w^{(t)})\] (2)
Here, any time step less than 1 or greater than T can be ignored. In the training phase of the skip-gram model, the model parameters are the target word vector and the context word vector for each individual word. During the training process, these model parameters are learned by maximizing the likelihood function, also known as maximum likelihood estimation. This is similar to minimizing the following loss function:
\[-\sum_{t=1}^{T} \sum_{-m \le j \le m, j \ne 0} \log P(w^{(t+j)} | w^{(t)})\] (3)
Using stochastic gradient descent, in each loop, choose a smaller subsequence by random sampling to compute the loss for that subsequence and then compute the gradient to update the model parameters. The key point of the gradient calculation is to compute the gradient of the logarithm of conditional probability for the center word vector and the context word vector. First, by definition, we have:
\[\log P(w_o|w_c) = \mathbf{u}_o^T \mathbf{v}_c - \log \left( \sum_{i \in V} \exp \left( \mathbf{u}_i^T \mathbf{v}_c \right) \right)\] (4)
Through the derivative, we get the gradient value \(v_c\) from the above formula.
\[\frac{\partial log P(w_o|w_c)}{\partial v_c} = u_o - \frac{\sum_{j \in V} \exp(u_j^T v_c) u_j}{\sum_{i \in V} \exp(u_i^T v_c)}\] \[= u_o - \sum_{j \in V} \left( \frac{\exp(u_j^T v_c)}{\sum_{i \in V} \exp(u_i^T v_c)} \right) u_j\] \[= u_o - \sum_{i \in V} P(w_j|w_c) u_j\] (5)
The calculation gives the conditional probability for every word in the dictionary with a given target word \(w_c\). Then, use that method again to find the gradients for other word vectors. After training, for any word with index i in the dictionary, get a set of two word vectors, \(v_i\) and \(u_i\). In this paper, the target word vector in the skip-gram model is used as a vector representing a word.
3.4 Security Vulnerability Detection Method
Thus, after the functions have been extracted and normalized, we put them in the classification model to identify vulnerabilities in each function. To achieve this purpose, this paper proposes to use the RF machine learning algorithm. The RF algorithm is currently one of the best supervised classification algorithms. This algorithm uses an ensemble of classifiers, usually decision trees, to make the final prediction. The theoretical foundation of this algorithm is based on Jensen's inequality [25]. Jensen's inequality applied to the classification problems pointed out that the combination of multiple models may produce a smaller error rate than each individual model.
4 Experiments and Evaluation
4.1 Experimental Dataset
For the experimental dataset, the SARD dataset was used, which consists of 15,591 C/C++ programs [26]. After splitting the C/C++ programs in the dataset into functions, the dataset consisted of 267,227 files containing function data. Here, we used the SySeVR toolkit to check for vulnerabilities that appear in the dataset. Based on the results, the dataset was divided into three main vulnerability types. The details of the dataset are shown in Table 1.
| Table 1 | I ype and number | of vulnerabilities. |
|---|
| Vulnerability type | Contain vulnerabilities | Normal | Total |
|---|---|---|---|
| Array Usage | 31,303 | 10,926 | 42,229 |
| Pointer Usage | 28,391 | 263,400 | 291,791 |
| Arithmetic Expression | 3,475 | 18,679 | 22,154 |
| Total | 64,169 | 293,005 | 356,174 |
This study used an algorithm to convert words into vectors to train the machine learning models. However, after conversion, the lengths of the functions may not be the same, while the datasets need to have a fixed length when input into machine learning models. Here, the default length in the dataset was the length of the longest vector, depending on each vulnerability dataset. Shorter vectors were appended with zeros at the end.
4.2 Experimental Scenario
During the experimental process, we used three separate datasets with 75% of the data for training with cross validation (cv = 5) and 25% of the data for testing the accuracy of the model.
To evaluate the effectiveness of the proposed method, we conducted four evaluation scenarios:
- 1. Scenario 1: Evaluate the effectiveness of the skip-gram model by testrunning the BOW model. This scenario replaces skip-gram with BOW to compare the effectiveness of BOW with that of skip-gram.
- 2. Scenario 2: Evaluate the effectiveness of the RF machine learning algorithm by replacing RF with other classification algorithms. In this scenario, we experimented with some other classification machine learning algorithms, i.e., Perceptron, Bayes Naive, and MLP.
- 3. Scenario 3: Experiment to evaluate the effectiveness of the proposed model consisting of the skip-gram model and the RF algorithm. This is the experimental scenario for our proposed model.
- 4. Scenario 4: Compare with other studies. In this scenario, we compared our proposed model with the CNN model proposed in Ref. [9].
4.3 Evaluation Criteria
1. Accuracy: The ratio between the number of samples classified correctly and total number of samples:
\[Accuracy = \frac{TP + TN}{TP + TN + FP + FN}\] where, TP = true positives: the number of software security vulnerabilities classified correctly; FN = false negatives: the number of software security vulnerabilities classified as normal; TN = true negatives: the number of normal packets classified correctly; FP = false positives: the number of normal packets classified as software security vulnerabilities.
2. Precision: The ratio between the true positive value and the total number of samples classified as positive. The higher the value of precision, the more accurate the software vulnerability detection.
\[Precision = \frac{TP}{TP + FP}\]
3. Recall: The ratio between the true positive value and the total real software security vulnerabilities. The higher the value of recall, the lower rate of missing positive samples.
\[Recall = \frac{TP}{TP + FN}\]
4. F1-score: The harmonic mean of precision and recall. The higher the F1 score, the better the model.
\[F1-score = \frac{2 \times precision \times recall}{precision + recall}\]
4.4 Experimental Results
4.4.1 Experimental Results of Scenario 1
In this scenario, we replaced the skip-gram model with the BOW model. Table 2 shows the results of processing and normalizing functions by the BOW model and classification by the RF algorithm.
Table 2 Experimental results using the model combining BOW and RF.
| Vala anal ilita tama | Evalua | tion | ||
|---|---|---|---|---|
| Vulnerability type | Accuracy | curacy Precision Recall I | F1_score | |
| Pointer vulnerability | 84 | 69 | 84 | 72 |
| Array vulnerability | 81 | 76 | 75 | 75 |
| Arithmetic vulnerability | 89 | 81 | 80 | 80 |
The experimental results in Table 2 show that the BOW model did quite well in its embedding role by supporting data normalization as a premise for the RF algorithm to perform classification. Based on these experimental results, it can be seen that the pointer vulnerabilities were classified most accurately, second were arithmetic vulnerabilities and last were array vulnerabilities. However, in the opposite direction, regarding normal data detection, the algorithm gave the best classification results for the arithmetic type, then the array type, and finally the pointer type. This experimental result showed that the combination of BOW and RF models had good and acceptable classification results.
4.4.2 Experimental Results of Scenario 2
In this scenario, we replaced the RF classification algorithm with other classification algorithms, i.e., Perceptron, Bayes Naive, and MLP. Tables 3 to 5 show the experimental results for these algorithms.
Table 3 Experimental results using the Naive Bayes algorithm.
| Evaluation | ||||
|---|---|---|---|---|
| Vulnerability type | Accuracy | Precision Recall | F1_score | |
| Pointer vulnerability | 55 | 56 | 66 | 48 |
| Array vulnerability | 51 | 57 | 59 | 51 |
| Arithmetic vulnerability | 71 | 56 | 58 | 56 |
Table 4 Experimental results using the Perceptron algorithm.
| Evaluation | ||||
|---|---|---|---|---|
| Vulnerability type | Accuracy | Precision Recall | F1_score | |
| Array vulnerability | 79 | 74 | 76 | 74 |
| Arithmetic vulnerability | 84 | 73 | 83 | 76 |
| Pointer vulnerability | 86 | 68 | 76 | 71 |
Table 5 Experimental results using the MLP model.
| Evaluation | ||||
|---|---|---|---|---|
| Vulnerability type | Accuracy | Precision Recall | F1_score | |
| Array vulnerability | 82 | 77 | 76 | 76 |
| Arithmetic vulnerability | 90 | 84 | 79 | 81 |
| Pointer vulnerability | 84 | 69 | 86 | 73 |
Based on the experimental results in Tables 3 to 5, it can be seen that the MLP model gave relatively stable and good classification results on individual vulnerabilities. Specifically, regarding detecting arithmetic vulnerabilities, the MLP model had classification results with Accuracy, Precision, Recall, and F1_score measures of 90%, 84%, 79%, and 81%, respectively. Likewise, for pointer vulnerabilities, the measures were 84%, 69%, 86%, and 73%, respectively. These classification results were higher than those of Naive Bayes and Perceptron. Especially the Naive Bayes algorithm performed poorly. Comparing the classification results in Tables 5 and 2, it can be seen that there was a small difference between the classification results of the MLP model and the RF algorithm. Specifically for some vulnerabilities, the RF algorithm in Scenario 1 gave better results than the MLP model in Scenario 2. In contrast, the MLP model had better results for arithmetic vulnerability classification than in Scenario 1.
4.4.3 Experimental Results of Scenario 3
This study fine-tuned some key parameters of the RF algorithm: max features, n_estimators, and 24 min_sample_leaf. By default, the max_feature parameter is set to auto, i.e., the square root of the total number of objects. The n_estimators parameter is the number of created trees with a default of 100. The min_sample_leaf parameter represents leaves of the tree with a default of 1. This means that a decision branch is created until no more decisions exist; the end node is the leaf node. The specific datasets are then split according to each vulnerability. The summary results are presented in detail in Table 6.
The experimental results in Table 4 show that the RF algorithm gave classification results at an acceptable accuracy level. Accordingly, with the pointer vulnerability type, the RF algorithm had relatively good results. These results had a great difference when changing the parameters of the decision tree in the algorithm. Specifically, when increasing the number of decision trees, the accuracy of the classification process also increased. The algorithm had the lowest efficiency on all measures when the number of decision trees was 20, and the highest efficiency when the number of decision trees was 100 and 1000. Similarly, for array usage vulnerabilities, the RF algorithm also gave relatively high efficiency, and these results also had a large difference between the best classification model and the worst classification model.
Table 6 Experimental results of detecting security vulnerabilities using skip-gram model and RF algorithm.
| Vulnerability | N agtime atom | Evalua | Evaluation | ||
|---|---|---|---|---|---|
| type | N_estimator Accuracy | Precision | Recall | F1_score | |
| 20 | 79.02 | 88.82 | 45.19 | 59.97 | |
| D.: | 30 | 89.07 | 67.78 | 50.33 | 58.02 |
| Pointer usage | 50 | 88.16 | 78.95 | 48.35 | 60.12 |
| vulnerability | 100 | 92.25 | 80.89 | 84.59 | 82.21 |
| 1000 | 92.47 | 81.10 | 84.123 | 82.59 | |
| A | 30 | 76.07 | 60.08 | 77.02 | 75.00 |
| Array usage vulnerability | 50 | 80.86 | 79.08 | 77.25 | 76.25 |
| 100 | 84.20 | 80.05 | 78.88 | 79.99 | |
| 1000 | 84.38 | 80.08 | 79.99 | 80.8 | |
| Arithmetic | 30 | 90.56 | 85.26 | 78.63 | 81.62 |
| 50 | 90.49 | 85.05 | 78.81 | 81.63 | |
| expression | 100 | 90.05 | 85.10 | 79.02 | 80.35 |
| vulnerability | 1000 | 90.61 | 85.08 | 78.00 | 82.20 |
In particular, the difference between the best model and the worst model was up to 8% to 9%, and when the number of decision trees was large enough, the accuracy of the model did not change much. This shows that the algorithm reached stability and balance at a number of decision trees of 100. For arithmetic expression vulnerabilities, there was a slight difference, i.e., the difference in the classification results was not too large when changing the number of trees. Specifically, with the number of decision trees from 30 to 1000, the difference was only about 0.5%. This shows that the arithmetic expression vulnerability dataset had relatively good and balance, so changing the number of decision trees did not affect the accuracy of the algorithm much.
Comparing the experimental results in Scenarios 1, 2, and 3, it can be seen that our proposed model had superior performance compared to the other models and algorithms. Next, we conducted experiments for security vulnerability detection to evaluate the effectiveness of the classification model. Figure 4 shows the confusion matrix results of the vulnerability detection process when using the RF algorithm with the optimal parameters.
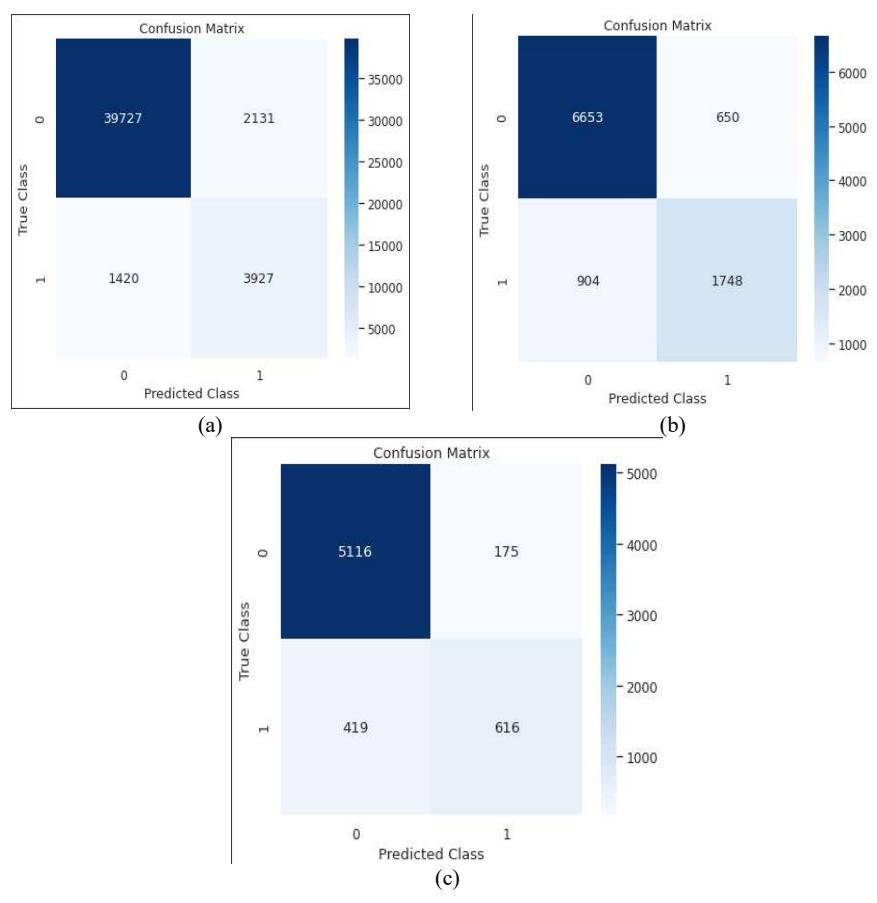
Figure 4 Confusion matrix results, where a is the pointer vulnerability, b is the array vulnerability, c is the arithmetic vulnerability.
Figure 4 shows some results of the testing process. For the pointer vulnerability type, the RF algorithm correctly predicted 3,927 functions containing vulnerabilities, incorrectly predicted 2,131 normal functions as functions containing vulnerabilities, and wrongly predicted 1,420 functions containing vulnerabilities.
Similarly, for array usage vulnerabilities, the RF algorithm correctly predicted 1,748 functions containing vulnerabilities, incorrectly predicted 650 normal functions, and wrongly predicted 904 functions containing vulnerabilities. With the test dataset of arithmetic expression vulnerabilities, the RF algorithm correctly predicted 616 functions containing vulnerabilities, incorrectly predicted 175 normal functions, and wrongly predicted 419 functions containing vulnerabilities. The algorithm worked best with parameter n_estimator at 1000.
4.4.4 Experimental Results of Scenario 4
In this scenario, we conducted the experiments presented in Ref. [9] to evaluate the proposed model. Table 7 below describes the experimental results of this scenario. Table 7 shows the results of the vulnerability detection process using the CNN model.
| Table 7 Experimental results of detecting security vulnerabilities using CNN [9]. | |||
|---|---|---|---|
| Evaluation | ||||
|---|---|---|---|---|
| Vulnerability type | Accuracy | Precision | Recall | F1_score |
| Pointer usage vulnerability | 84 | 69 | 84 | 72 |
| Array usage vulnerability | 80 | 74 | 77 | 76 |
| Arithmetic expression vulnerability | 90 | 84 | 75 | 78 |
From Table 7, it can be seen that the CNN model had a relatively good and uniform effectivity on all security vulnerabilities. Especially for pointer usage vulnerabilities and array usage vulnerabilities, the CNN model detected vulnerabilities more accurately than normal functions. The reason is that the CNN network, with the support of hidden layers, extracts some features of abnormal functions, thus bringing high efficiency in the classification process. Figure 5 lists the results of the confusion matrix of the CNN model.

Figure 5 Confusion matrix results, where a is pointer vulnerability, b is array vulnerability, c is arithmetic vulnerability.
Based on the experimental results of the confusion matrix in Figure 5, it can be seen that:
- 1. With a dataset of 47,205 different samples containing pointer vulnerabilities, the CNN model gave the following classification results:
- a. 39,614 correctly labeled samples: 35,154 samples with label 1; 4,460 samples with label 0.
- b. 7,591 incorrectly labeled samples: 6,704 samples were mislabeled from 0 to 1; 887 samples were mislabeled from 1 to 0
- 2. With a dataset of 6,637 different samples containing array vulnerabilities, there were:
- a. 5,300 correctly labeled samples: 4,048 normal samples; 1,252 attack samples.
- b. 1,337 incorrectly labeled samples: 835 samples were mislabeled from normal to attack; 502 samples were mislabeled from attack to normal.
- 3. With a dataset of 4,218 different samples containing arithmetic vulnerabilities, the confusion matrix results were:
- a. 3,787 correctly labeled samples: 3,437 normal samples; 350 attack samples.
- b. 431 incorrectly labeled samples: 91 samples were mislabeled from normal to attack; 340 samples were mislabeled from attack to normal.
4.5 Discussion
4.5.1. Comments on the Results
Based on the experimental results in Scenarios 1, 2, 3, 4, it can be seen that the combination of the skip-gram model with the RF algorithm gave better results than the other classification algorithms in the task of detecting software security vulnerabilities. For array usage vulnerabilities, the RF algorithm had an Accuracy measure of 84.38%, higher than 2.38% with the MLP model and 4.38% with the
CNN model [9]. Likewise, the Recall measure when using the RF algorithm was also higher than with the other algorithms (4% higher than that of MLP and 3% higher than that of CNN). For vulnerabilities related to arithmetic expressions, RF, CNN, MLP all had relatively same efficiency, with only 1% to 2% difference. Finally, for the pointer usage vulnerability type, the RF algorithm continued to show its superiority, yielding results higher than the other algorithms from 10% to 12%. However, for accurately detecting pointer vulnerabilities, the RF algorithm gave results 0.1% worse than the CNN model and 1.9% worse than the MLP model.
4.5.2. Some Limitations and Directions to Solve
1. Regarding the data
- The problem. The data imbalance problem causes difficulties in the security vulnerability detection task. Obviously, in reality, to detect security vulnerabilities, it is necessary to have proposals for selecting and sampling data reasonably. In this study, the experimental dataset we used had a disparity of about five times. This disparity is not too big. However, in reality, it could be from a few hundred to a few thousand times. This will make the task of detecting security vulnerabilities in the system more difficult. Therefore, it is necessary to have solutions for such imbalanced datasets.
- Solving the problem. To solve this task, there are two methods to choose from: i) using algorithms changing the distribution of the dataset, i.e., single methods (NearMiss, Tomek links, SMOTE, etc.) or combined methods (combining SMOTE with Tomek links; SMOTE with Edited NearestNeighbour, etc.); ii) using a representation learning model. For this method, algorithms such as GRU, BGRU, Triplet Loss or Circle Loss can be applied.
4.5.3. Regarding the feature extraction algorithm:
- 1. The problem. As described above, the Word2Vec model processes input strings into vectors. These vectors have different lengths depending on the input data. To classify these input strings, we need to normalize them so that they are the same length. In natural language processing problems, one must find important segments and positions to choose the length of feature vectors. However, for data chunks in programming languages (C, C++, Java), such a principle is impossible to apply.
- 2. Solving the problem. To solve this, in this research, we analyzed and evaluated the experimental dataset. During the analysis, we found that after being analyzed by the Word2Vec model, the length of the feature
vectors was commonly in the range from 5000 to 5700. However, in codes going through the Word2Vec model, there were also very short code segments. Therefore, we normalized the vectors by taking a length of 5000. Then, the shorter vectors were padded with zeros to reach a length of 5000 and longer vectors were truncated. The characteristic of this method is that it unifies the length of the vectors, but this may lead to the loss of important information in the data. Therefore, we have to survey and analyze to see the convergence of the dataset to find other ways to normalize. The results given in this study were selected based on comparing several models with vectors of different lengths.
5 Conclusion
This paper presented an approach of software security vulnerability detection based on embedding techniques and the RF classification algorithm. This proposal yielded good experimental results in the task of classifying known software vulnerabilities. The RF algorithm gave better performance than the other classification algorithms. The reason for this is that the experimental dataset in the algorithm was relatively small and there was not too much difference between the number of vulnerability data and normal data, in which case machine learning algorithms often have better results. Besides, based on the experimental results for four scenarios, it was seen that there was a huge difference in the classification results.
We think that the difference between the security vulnerabilities leads to different embedding processes, so there will be differences in the characteristics and features of the embedding vectors. Therefore, the BOW model did not work as well as the skip-gram model. In the future, we will continue to research new approaches to process and normalize the data to obtain important features of vulnerabilities by using models such as graph embedding. In addition, the approaches to detecting zero-day vulnerabilities will also be updated in our subsequent studies.
Acknowledgment
This work was sponsored by the Posts and Telecommunications Institute of Technology, Vietnam.