
1 Introduction
Repetitive work experienced by a machine or workpiece in the manufacturing process can sometimes lead to failures in the form of fatigue and cracking [1]. Early detection of such failures is necessary to prevent the possibility of significant damage to the machinery or product quality deterioration. One solution to overcome this problem is early detection by introducing a monitoring
system [2]. The monitoring system generally requires data parameters such as vibration, stress, and temperature to inspect the machine's condition and the manufacturing process. These parameters can be measured during manufacturing processes such as milling [3]. Each manufacturing operation process has unique characteristics and uses diverse equipment and strict protocols. These characteristics challenge the monitoring device in observing the machine's condition and the manufacturing process in detail [4].
In machinery that performs a cyclic operation, vibration is one parameter that needs to be monitored. Therefore, vibration sensors are widely used as the primary sensing device for monitoring systems, particularly in cyclic operation machinery such as milling machines [5]. Vibration is a periodic motion that is tolerable when desirable [1]. Problems may occur when the vibration is uncontrollable, and the value is higher than desired, resulting in mechanical failure or deterioration of the machining products.
One of the manufacturing processes widely used to produce engineering products is milling. Milling is a material removal process that utilizes a milling tool with a cylindrical shape that rotates and moves along a predefined path. Many factors can generate vibration in the milling process, such as tool clamping, tool runout, workpiece clamping, and the settings of milling parameters such as depth of cut, spindle speed, and feed rate. Vibration in milling can result in chatter [5]. Chatter is a self-excited vibration phenomenon of machining structures and processes [6- 7]. According to Yue et al. [7], there are three types of mechanical vibration in metal cutting processes, i.e., free vibration, forced vibration, and self-excited vibration.
Free vibration is mainly caused by impact. Forced vibration is due to an imbalance between gears, bearings, spindles, and other machine tools, while selfexcited vibration is caused by alternating forces produced by an interaction between the tool and the workpiece. Pejryd and Eynian [6] argue that two types of vibration are generated in machining: forced vibration and chatter. Regenerative chatter occurs due to the difference in the vibration phase between the current cut and the previous cut. Chatter occurs when the two vibrations are out of phase [6].
Vibration accelerates tool wear and degrades the surface quality of the machined surface by increasing the surface roughness [8,9]. Tool wear can also increase the residual stress in the sub-surface of the machined part [10]. Accelerated tool wear will shorten the tool life and ultimately increase the manufacturing time and cost. If the vibration is uncontrolled, it can even impair the operator's health [8]. The effect of vibration is exaggerated in micro-scale milling (micro-milling) due to the small size of the milling tool, weak tool rigidity, high spindle speed, and uneven hardness of materials. In addition, the vibration in micro-milling increases burr formation, where the size of the burr is comparable with the features being created [11].
Many technologies detect vibration and chatter through signal processing methods such as force signals, vibration signals, sound signals, or image signals [7]. In order to examine the vibration and chatter and identify the best cutting parameters for the milling process, a stability lobe diagram (SLD) is commonly used [7]. This diagram is also used to predict the stability of milling processes [12]. An extension of the SLD includes the axial depth of cut and the spindle speed, which can be used to determine chatter stability parameters [12,13].
Researchers and engineers have attempted to reduce the vibration level by observing the machining parameters. The optimum set of machining parameters depends on workpiece materials, tool materials, and machines [14]. The correct combination of milling parameters such as depth of cut, spindle speed, and feed rate can reduce vibration and reduce the material removal rate. Shaik and Srinivas [15] argued that spindle speed and axial depth of cut significantly affect vibration amplitude. In addition, the combination of low feed rate and high spindle speed can reduce tool vibration amplitude [15].
Rahman et al. [16] suggested that depth of cut and feed rate are significant factors in tool vibration during milling. Similarly, Tran and Liu [17] observed that the feed rate is a critical parameter in vibration behavior. In contrast, Chuangwen et al. [8] argued that the feed rate has only a slight effect on milling vibration, whereas an increase in the depth of cut leads to an increase in the cutting force, thus increasing vibration.
Vibration characteristics, especially its acceleration, amplitude, standard deviation, and root mean square (RMS), have been reported to increase when the feed rate [9] and depth of cut increase [18]. In contrast, increasing the cutting speed decreases vibration [18]. It has been observed that the cutting speed is a significant factor affecting tool vibration [19]. The spindle speed is the most critical parameter in controlling the vibration in micro-milling [5]. A low spindle speed can reduce vibration.
Vibration detection is essential in the machining process to achieve good surface quality, a longer tool lifespan, less noise, and decreased manufacturing cost and time. Vibration can be detected using direct and indirect in-process real-time methods based on force and displacement signals [17] or off-line machined surface characterization [13]. Vibration in the milling process can be detected using a piezoelectric sensor., which can be attached to the workpiece or embedded in a spindle-tool holder [12]. Li et al. [12] have proposed a method for the active control of milling chatter using piezoelectric actuators and vibration sensors integrated and embedded in a tool holder. A fuzzy controller was developed to realize robust control of milling chatter.
Various simulation analysis methods and milling experiments under different milling conditions have been proposed to predict and suppress vibration, such as using the response surface methodology (RSM) [19] and an artificial neuron network [13]. Mathematical and statistical models using response surface methodology (RSM) have been applied with different cutting parameters to predict surface finish, tool vibration, and tool wear [15]. The response surface model produced high accuracy in predicting vibration and optimizing milling parameters, especially straight groove micro-milling [5]. Artificial neuron networks were applied to predict vibration in milling [10].
Vibration data can be extracted from the sound produced by the process. Nowadays, mobile platforms such as phones have advanced capabilities to record and analyze sound data from machining processes. Thus, a simplified SLD can be constructed. Pejryd and Eynian [6] have developed a software application called iCut to record sound from machining operations and construct an SLD. The software algorithm is based on chatter theory and was developed for mobile platforms such as phones and tablets. The dominant sound frequency analysis from the SLD is used to propose a new spindle speed.
Equipment in the industrial sector is currently being updated, automated, and connected to the Internet as part of Industrial Revolution 4.0 [20], for example, by installing wireless monitoring systems [21]. Tucked cables and high costs involved in large machinery are the main challenges of wired monitoring systems [22]. For this reason, we propose a wireless vibration monitoring system in this paper, which works based on the working principle of wireless sensor networks (WSNs) [23].
In this study, a wireless vibration monitoring system was developed to deal with the challenges faced by wired vibration monitoring systems. The absence of cables in the system removes the possibility of tucked cables in the machinery. The wireless vibration monitoring system proposed in this paper consists of three components: a sensor node, a monitoring node, and a base station. The sensor node acts as the sensing device to detect vibration in the machinery, and the monitoring node transmits the data from the sensor node to the base station. The base station records the vibration sensed by the sensor node and uploads the data to a server.
A slot milling experiment was conducted to examine the capability of the proposed wireless vibration monitoring system. This initial setup of the wireless
vibration monitoring system is expected to be further developed for more comprehensive milling conditions and parameters and other manufacturing processes.
The rest of this paper is organized as follows. Section 2 gives a detailed explanation of the materials and methods used. The proposed vibration wireless system was validated by conducting an experimental design, as discussed in Section 3. In Section 4, the result and discussion are presented to understand the performance of the proposed vibration monitor system. Section 5 contains the conclusion of this study.
2 Materials and Methods
Two setups were constructed for this experiment. The first setup was the wireless vibration monitoring system design. The second setup was a slot milling experiment conducted on a milling machine.
2.1 Wireless Vibration Monitoring System
The design of the vibration monitoring system for milling machines includes three parts: a sensor node, a monitoring node, and a base station. The sensor node is responsible for recording the vibration data from the milling machine, and the monitoring node transmits the data wirelessly to the base station through an opensource cloud platform. The base station receives the data and performs data processing. An Xbee with the ZigBee standard was applied to communicate between the sensor node and the monitoring node over a short distance. An operator receives the data in a place from the base station. Here, cloud data sharing is used instead of XBee communication.
The implementation of XBee was chosen for wireless transmission due to its low current consumption. XBee's current usage is about 75% to 90% lower than Wi-Fi and 58% lower than Bluetooth [25]. The quality of data transfer using Xbee is higher than that of Bluetooth and Wi-Fi [26-28]. The parameters used to ensure that XBee is the best choice in this study were the signal-to-noise ratio (SNR) and bit error rate (BER) [25].
2.1.1 Sensor Node
The sensor node plays a critical role in recording the vibration data. In order to establish the sensor node of the wireless vibration monitoring system, three types of components are needed: a processing unit, a sensing system, and a communication unit. The components used at the sensor node to develop the vibration monitoring system were a vibration sensor (piezo-film vibration
sensor), an Arduino UNO, and an XBee. The design configuration for the sensor node is shown in Figure 1.
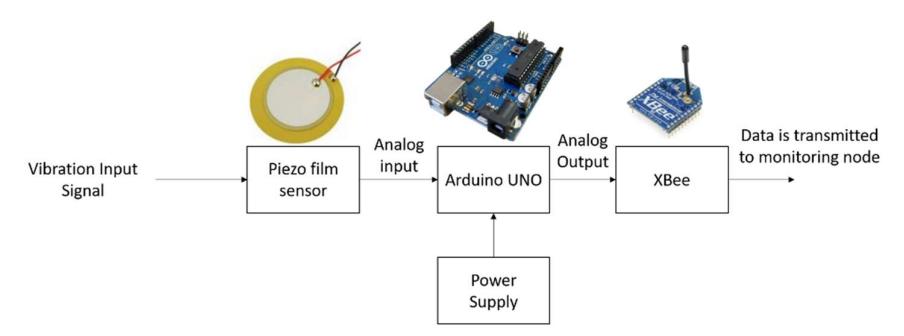
Figure 1 Sensor node configuration.
The piezo film sensor detects the vibration input as analog input. An Arduino was chosen due to its capability to read analog input. Inside the Arduino, the information obtained from the sensor is executed and transmitted to the monitoring node. In this paper, the vibration data was investigated to confirm or estimate the correct value.
2.1.2 Monitoring Node
The monitoring node forwards the information obtained from the sensor node to the base station. Since the sensor node and the monitoring node are close, the XBee module is reliable in covering the short-distance communication between the components. This node can monitor the data because a Raspberry Pi sends the data to the cloud dashboard. The configuration of the monitoring node is shown in Figure 2.
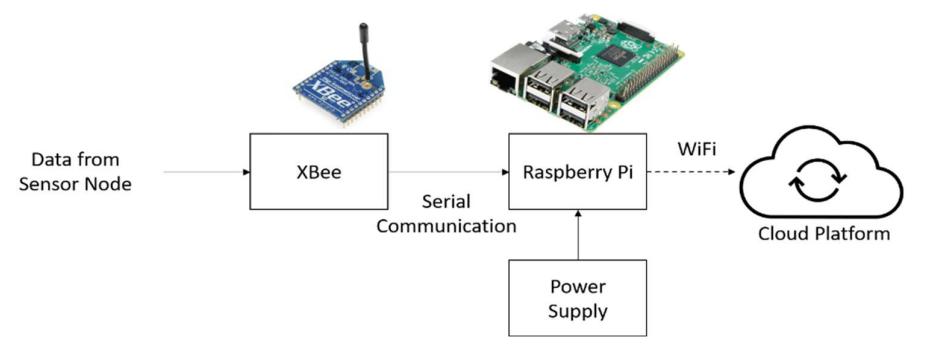
Figure 2 Monitoring node configuration.
The dweet.io dashboard is an excellent option to display the data since its implementation is convenient and can be integrated with a Raspberry Pi. From this component, a human operator can access the data at a distance and check the performance of the vibration system.
2.1.3 Base Station
In the base station, the operator can monitor the vibration behavior yielded from the milling machine. The base station is the final component of the system, where the information appears after it has been processed. The data is displayed on a monitor, where a human operator can investigate and check the system. The configuration can be seen in Figure 3.
Figure 3 Base station configuration.
2.1.4 Sample Average Filter to Remove Input Noise
The data obtained from the sensor is processed to remove noise by using a sample average filter, defined as follows:
\[y_i = \sum_{i=1}^{n} (x_i/n) \tag{1}\] where yi is the output after filtering, xi is the raw data before filtering, and n stands for the number of data.
2.2 Milling Experimental Setup
The vibration system was constructed and tested in a milling process. The milling experiment was conducted on a carbon steel workpiece with a size of 100 mm x 100 mm x 30 mm. The workpiece was the first face milled to flatten the surface. The milling tool used was made of high-speed steel (HSS) with a diameter of 8 mm. The tool was cleaned after each slot and changed after three slots to ensure that the tool stayed in good condition during each slot milling process. The
vibration monitoring system was prepared, and the experiment was conducted with a TRAK K3 CNC Knee Mills milling machine, as shown in Figure 4.
Figure 4 (a) Milling experimental setup; (b) vibration sensor; (c) sensor node microcontroller; (d) base station.
The system was tested with several levels of vibration. The levels of vibration were achieved by varying different parameter values: 1) depth of cut (DOC) was varied at 0.1 mm, 0.5 mm, and 1.0 mm; 2) feed rate was varied at 0.2 mm/rev, 0.4 mm/rev, and 0.6 mm/rev; spindle speed was varied at 1,500 rpm and 2,500 rpm. The variations of each parameter are shown in Table 1. Each parameter variation was tested in a slot milling process, as shown in Table 1. In total, there were 18 slots.
A comparison between a wired system and the wireless system was conducted to determine the accuracy of the XBee module in transferring data from the sensor node to the base station to evaluate the wireless ability of the system. The online connection of the system was evaluated as well. Dweet.io, which was chosen as the webserver to upload the data from the base station, was also evaluated. The transfer rate, i.e., the upload speed from the base station to the webserver, is the most critical factor of the online connection to evaluate.
Table 1 Variation of parameters for spindle speed at 1,500 rpm and 2,500 rpm.
| DOC Feed | 0.1 mm | 0.5 mm | 1.0 mm |
|---|---|---|---|
| 0.2 mm/rev | Slot 1 | Slot 2 | Slot 3 |
| 0.4 mm/rev | Slot 4 | Slot 5 | Slot 6 |
| 0.6 mm/rev | Slot 7 | Slot 8 | Slot 9 |
Finally, to determine the system's ability in each of the levels generated using different combinations of parameters was evaluated. The system was developed to monitor changes in vibration levels. Therefore, it was necessary to analyze the effect of each parameter and the ability of the system to monitor changes in vibration level.
3 Results and Discussion
3.1 Wireless Vibration Monitoring System
The accuracy of the XBee module is transmitting vibration data was evaluated by comparison of the wireless system and a wired system. This comparison was conducted to guarantee that the vibration data recorded by the base station were equal to the actual vibration data sensed by the piezo film vibration sensor. Figure 5 shows the comparison between the wired and wireless systems on some parameter variations.
The graph's x-axis is the time during the milling process, while the y-axis of the graph is the vibration frequency (Hz). The solid blue line indicates the vibration data recorded by the wired system, and the dashed orange line indicates the vibration data recorded by the wireless system. In general, the vibration data recorded by both the wired and wireless systems were identical. This result means that the wireless vibration system using an XBee module was able to transmit the real vibration data completely.
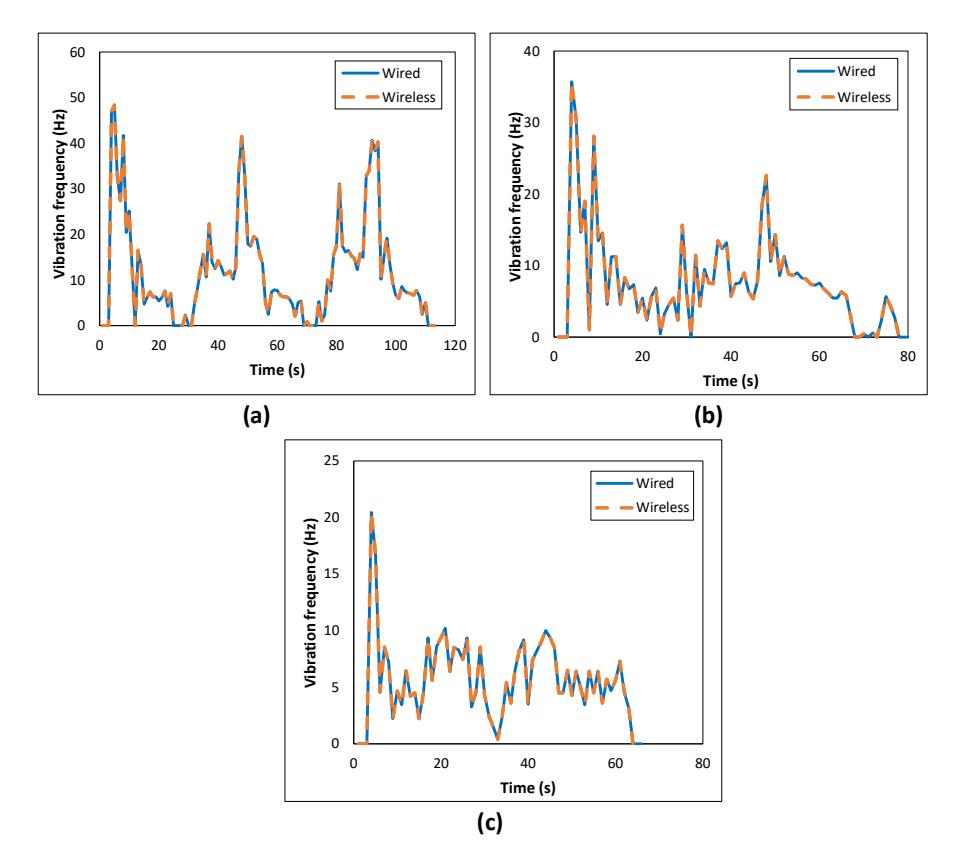
Figure 5 Vibration frequency comparison between wireless and wired vibration monitoring system for spindle speed at 1,500 rpm: (a) feed rate at 0.2 mm/rev DOC 1 mm, (b) feed rate at 0.4 mm/rev DOC 0.5 mm, and (c) feed rate at 0.6 mm/rev DOC 0.1 mm.
3.2 Effect of Depth of Cut, Feed Rate, and Spindle Speed on Vibrations
The three main milling parameters selected for the experiment, i.e., depth of cut, feed rate, and spindle speed, were intended to generate several vibration levels. The different milling parameters were selected to observe their effect on the vibration. Figures 6, 7, and 8 show the effect of each parameter.
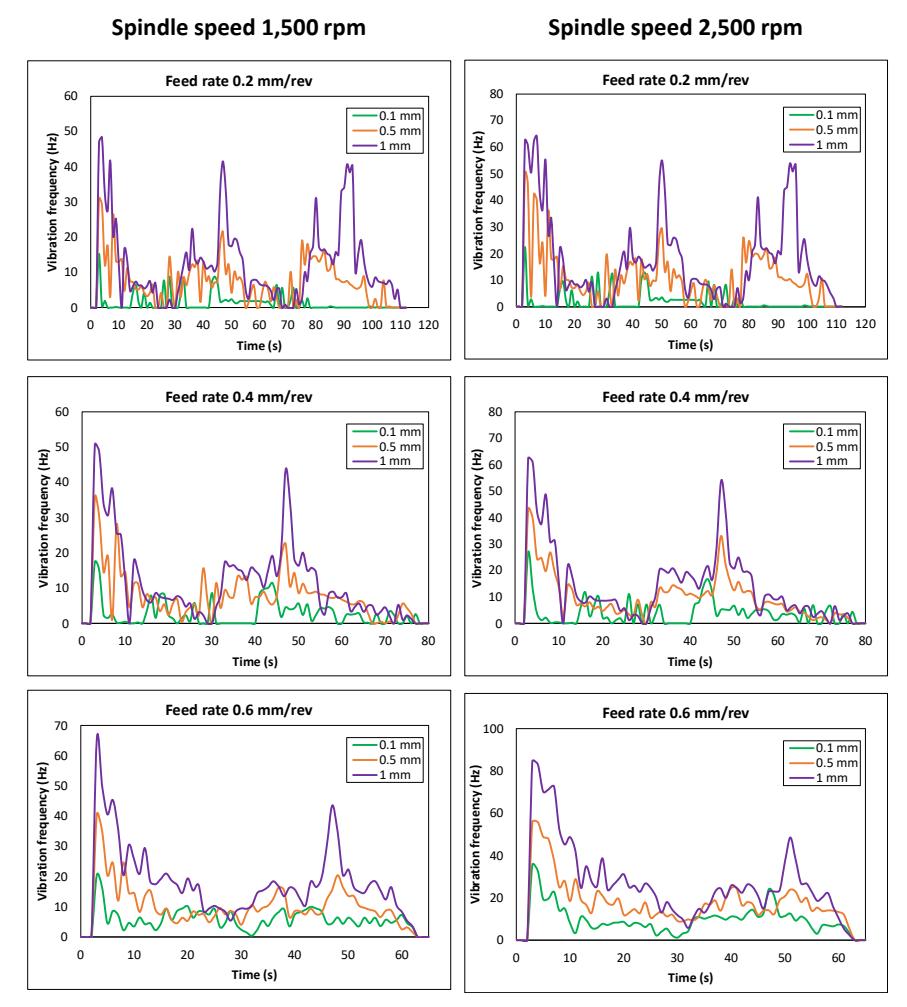
Figure 6 Effect of depth of cut variation on the vibration frequency during slot milling for different feed rates and spindle speeds of 1,500 rpm (left) and 2,500 rpm (right).
The level of vibration is required to evaluate the system's accuracy in monitoring the milling machine. For all variations of parameters, the peak magnitude of vibration frequency occurred when the cutting tool initially engaged the workpiece, which is the entry region of the slots.
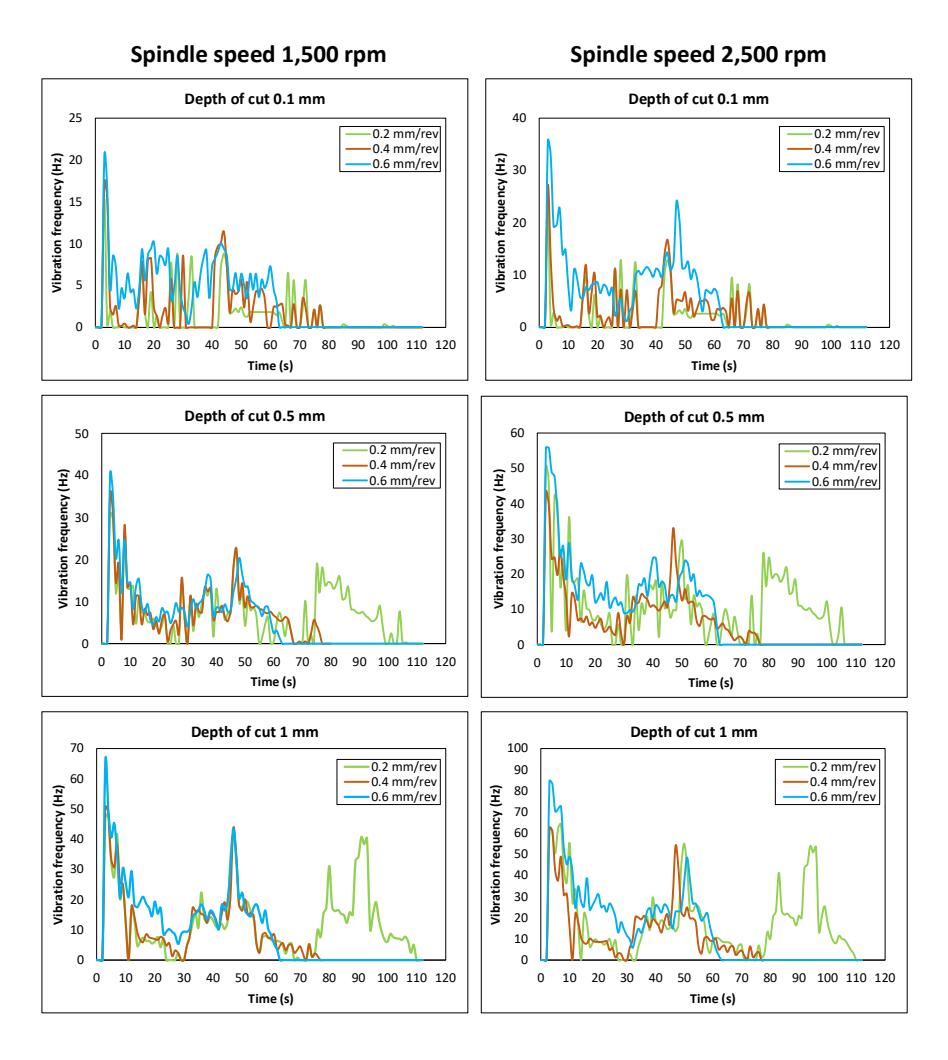
Figure 7 Effect of feed rate variation on the vibration frequency during slot milling for different depths of cut and spindle speeds of 1,500 rpm (left) and 2,500 rpm (right).
Figure 6 shows a plot of time (x-axis) versus vibration signal (y-axis) to observe the effect of depth of cut. Each graph in Figure 6 plots three different depths of cut, namely 0.1 mm (green line), 0.5 mm (red line), and 1 mm (purple line), for various combinations of feed rate and spindle speed. In general, the magnitude of the vibration signal was highest for the depth of cut at 1 mm. A higher signal was seen, especially at the peak signals. Figure 7 shows a plot of time (x-axis) versus
vibration signal (y-axis) to observe the effect of the feed rate. The graphs in Figure 7 show three plots of the variations of the feed rate, i.e., 0.2 mm/rev (green), 0.4 mm/rev (brown) and 0.6 mm/rev (blue) for various combinations of spindle speed and depth of cut. It can be seen from all graphs that the plots for the three different feed rates were relatively similar. There were no significant variations in the vibration signal, especially at the peak signals. However, a higher feed rate led to a higher signal in some ranges, especially for the 0.6 mm/rev feed rate.
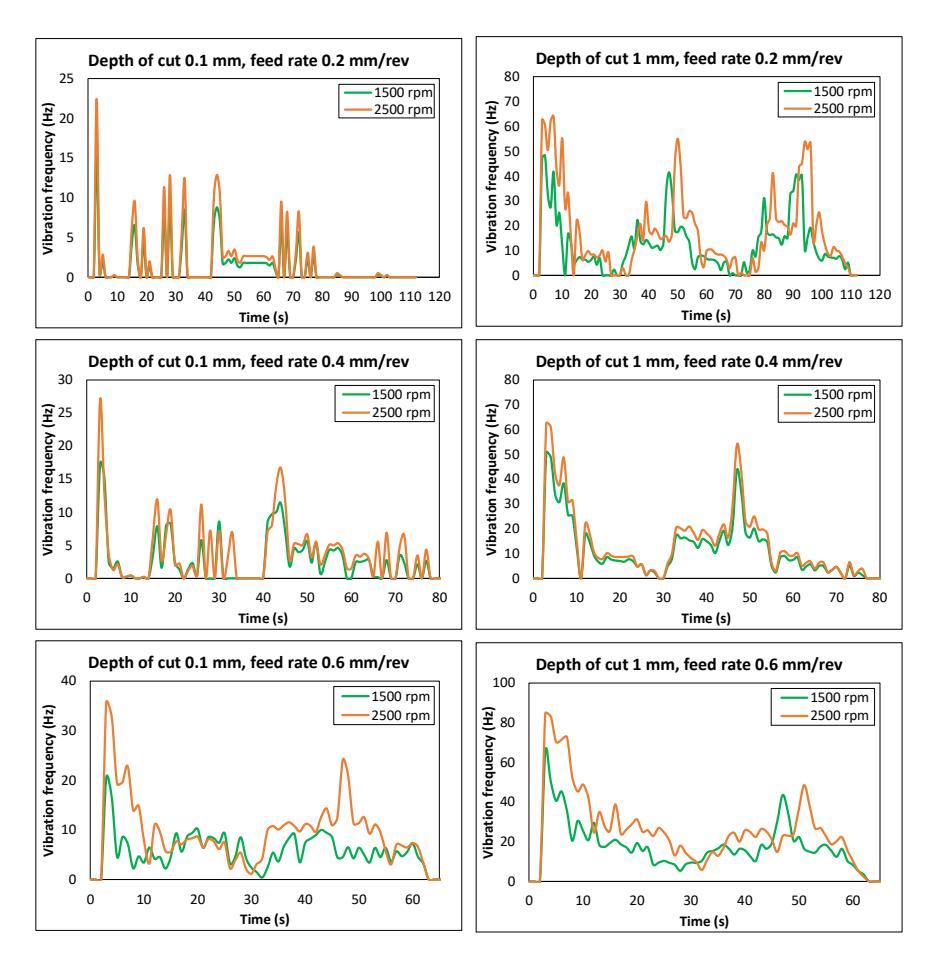
Figure 8 Effect of spindle speed variation on the vibration frequency during slot milling for different feed rates and depths of cut of 0.1 mm (left) and 1 mm (right).
Graphs to see the effect of spindle speed are shown in Figure 8. Similar to Figures 6 and 7, the x-axis represents time, and the y-axis represents the vibration
frequency signal. Two depths of cut are shown in Figure 8, namely 0.1 mm and 1 mm. A similar trend was observed for depth of cut at 0.5 mm. In general, the vibration signal was higher at higher spindle speed (2,500 rpm). This effect was more significant at higher feed rate (0.6 mm/rev).
As shown in Figures 6 to 8, the wireless vibration monitoring system could differentiate the levels of vibration represented by the variation of the parameters. Depth of cut, feed rate, and spindle speed affected the vibration frequency generated during the milling process. Higher depths of cut, feed rates, and spindle speeds generated greater vibration frequency magnitude. However, it can be seen that the effect of depth of cut was more significant compared to that of spindle speed and feed rate.
3.3 Maximum Vibration Frequency
The maximum frequency reading of all slots for spindle speeds of 1,500 rpm and 2,500 rpm are shown in Figure 9. The maximum frequency occurred in the entry region of the slots, as can be seen from the plot of vibration frequency vs. time in Figures 6 to 8. It has been reported that the stress value is the highest in the entry region and gradually reduces away from the entrance region during the machining process [24]. This trend was similar to the vibration frequency data recorded in the experiment using the proposed wireless vibration monitoring system. Hence, there is a correlation between the vibration frequency and the stress generated during machining, especially in the milling process.
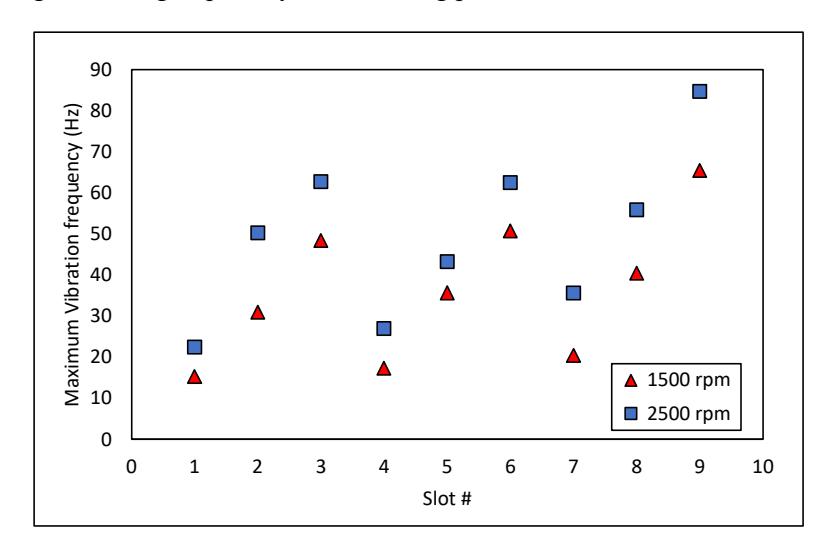
Figure 9 Maximum vibration frequency of all slots for spindle speeds of 1,500 rpm and 2,500 rpm.
In general, the depth of the cut of 1.0 mm had the highest maximum vibration frequency compared to the other depths of cut (0.1 mm and 0.5 mm). In addition, there was no significant difference in the maximum vibration frequency for different feed rates, which means that the feed rate has little impact on the vibration frequency of the milling process. A spindle speed of 2,500 rpm had a higher maximum frequency value than 1,500 rpm for the same feed rate and depth of cut. The highest maximum frequency occurred in slot 9 at 2,500 rpm spindle speed with a feed rate of 0.6 mm/rev and depth of cut at 1.0 mm.
Another study on wireless monitoring of the milling process using different technologies was conducted by Moehring, et al. [29]. In their study, Bluetooth was successfully used to transfer the data from the tools to the user interface. Ahmad, et al. [30] reported using Wi-Fi as the medium to transfer the data to the user in the milling process. Wireless monitoring systems for the milling process using various methods, such as Bluetooth, Zigbee [31], and Wi-Fi, have shown promising capability. However, according to Hilmani, et al. [25], Zigbee outperforms the other technologies in current consumption, range, and performance-based on SNR and BER. The current lab-scale study confirms that Zigbee is suitable for wireless milling monitoring, particularly for detecting vibration. Zigbee can be implemented on an industrial scale, especially in manufacturing industries, due to its integrated indoor and outdoor wireless monitoring systems.
4 Conclusion
A wireless vibration monitoring system was successfully built and tested. The system consists of three components, namely a sensor node, a monitoring node, and a base station. The proposed wireless vibration monitoring system monitored the vibration generated during the milling process. An XBee module successfully transmitted the vibration data from the sensor node to the monitoring node without the presence of noise. This finding was verified by comparing similar data recorded by the proposed wireless system and a wired system. The wireless vibration monitoring system was able to identify the effect of three milling parameters, i.e., depth of cut, feed rate, and spindle speed, on the vibration frequency level. Higher depths of cut, feed rates, and spindle speeds generated a higher level of vibration frequency. The effect of depth of cut on the vibration frequency was more significant than that of spindle speed and feed rate.
The vibration frequency data and cutting force data can also indicate the tool's condition. A sudden increase in vibration frequency or cutting force can lead to tool wear or tool fracture during the machining process. A plan for further development of this system is to integrate and to relate the vibration data from the wireless vibration monitoring system with a cutting force measurement method, especially for the milling process.
Acknowledgment
This study was supported by the Machine Shop Lab of Sampoerna University and an internal grant from CRCS Sampoerna University 2019-2020.