
1 Introduction
Using thermal imaging or thermography in detecting physiological disorders in plants is currently a trend. It has been reported that thermography methods can be utilized to detect salinity [1] and drought stress [2] in plants. In addition, thermography has also been used to study plant-pathogen interactions such as with fungi [3, 4], bacteria [5], and viruses [6-8]. Changes in the temperature of plant leaves infected by pathogens make it possible to use thermography in early detection of disease in plants. However, there are fewer reports regarding the use of thermography methods to study plant-virus interactions compared to other pathogens.
The infection of pathogens disrupts photosynthesis and affects the plant's respiration and transpiration activities [9]. Transpiration is the process of evaporating water through the stomata, which helps cool the leaves when there is a high air temperature increase. However, an uncontrolled transpiration rate poses the risk of increasing damage and water deficiency in plants [10]. The presence of viruses in plants can cause changes in transpiration. It has been indicated previously [11] that viral infection may cause an increment in stomatal closure so that the transpiration rate becomes low and subsequently causes an increase in leaf temperature. It has also been reported [12,13] that plant defense mechanisms against viral infection probably induce a decrease in stomatal density and transpiration rate in virus-infected plants.
It has also been reported that infection with the Cucumber mosaic virus (CMV) and Cucumber green mottle mosaic virus (CGMMV) causes changes in the transpiration rate in cucumbers [14]; infection with Tobacco mosaic virus (TMV) causes a lower stomatal index so that the transpiration rate of Nicotiana tabacum decreases significantly [15]. Likewise, infection with the Barley yellow dwarf virus (BYDV) in wheat [16] and the Bean yellow mosaic virus (BYMV) in Vicia alba [17]. Temperature changes in leaves due to disruption of plant transpiration caused by pathogen infection can be visualized using thermal imaging or thermography methods [18].
Compared to serological and molecular detection methods that cause plant damage during sampling, thermography has the advantage that it does not damage the plant (non-destructive) and is relatively safe because the user does not need to have direct contact with the object. This technique is relatively efficient and accurate. On the other hand, it is also relatively expensive due to the requirement of using a professional high-resolution thermal camera [19]. This may cause an obstacle to developing thermography methods as alternative methods for early detection of virus infections in plants.
Low-cost thermal cameras, such as the FLIR C2 Compact Thermal Imager, present a potential solution to the cost issue. Although these cameras have limitations associated with their low thermal sensor resolution, a previous study has reported that the FLIR C2 Compact Thermal Imager could successfully measure stomatal conductance in Vigna unguiculata in a greenhouse [20]. However, the ability of the FLIR C2 camera to detect changes in leaf temperature in virus-infected plants has not been reported yet, nor has the performance (accuracy) been assessed. Therefore, in this paper, we report the performance of a thermography method using the FLIR C2 Compact Thermal Imager as a lowcost thermal camera for early detection of temperature changes in plants infected with a virus. In the future, this non-destructive and low-cost method is expected to be used as an alternative method for early detection of virus infections in plants.
2 Materials and Methods
2.1 Research Area, Plant Material, and Virus Inoculation
This study was conducted in Bogor Regency, West Java, Indonesia, from December 2019 to March 2020. Sowed chili (cv. 'Matador') seeds were put in a seedling tray on a layer of moist tissue paper and then kept for approximately one week as the first step in plant preparation. Chili-pepper (Capsicum annuum) was chosen as the model because it is easy to maintain and shows obvious mosaic symptoms when infected with TMV [21-23].
After germination, the seedlings were placed in pots, with ten pots for each treatment group: V0 (virus-free) and V1 (virus-inoculated). Cow manure, soil, and husk charcoal (1:1:1 v/v) were combined to make the planting medium. The plants were inoculated by TMV using sap inoculation once they had two pairs of completely developed leaves. Before and after treatment, all chili plants were kept outdoors in tight insect confinement and were regularly exposed to direct sunlight.
The virus inoculum came from the Laboratory of Plant Virology, Plant Protection Department, Institut Pertanian Bogor (IPB University), which had been propagated in Nicotiana tabacum leaf. Serodiagnosis was carried out at the end of the observation to confirm viral infection of the inoculated plants. Virus detection using TMV-specific antibodies was done following the doubleantibody sandwich enzyme linked-immunosorbent assay protocol (DAS-ELISA) (DSMZ, Germany).
2.2 Thermal Image Recording and Processing
In this study, thermal image recording was carried out in an outdoor area, and the plants were not exposed to direct sunlight. Before recording the images, all plants were placed in the recording area with similar ambient conditions for 30 to 40 minutes [8] and dew or water droplets on the leaf surface were avoided because they may cause bias when the leaf temperature is measured.
The camera used to record thermal images of the chili plants was an FLIR C2 Compact Thermal Imager (FLIR Systems, USA). The camera has an uncooled microbolometer-type infrared (IR) detector with a spectral range of 7.5 to 14 µm and an IR sensor resolution of 80 × 60 pixels. The camera works at a minimum
thermal focus distance of 0.15 m and Multi-Spectral Dynamic Imaging (MSX) of 1.0 m, with a focal length of 1.54 mm, and can detect an object's temperature in the range of -10 to 150 °C with ±2 °C accuracy. The camera produces radiometric thermal images in a 41° × 31° field of view.
Following inoculation with TMV, thermal image recording of the plants was conducted every day (unless there was rain) starting at 6.00 a.m. local time. Two colorless incandescent bulbs (Philips, 15 watt, 115 lumens) were positioned at 45° and 60 cm from the leaf surface to provide additional light during recording. The camera was placed on a tripod and vertically positioned approximately 25 cm above the plant leaf surface. The time taken to record each plant sample was ±2 minutes. Leaf emissivity was set to 1 as in previous studies [4,6,24-29], because this study focused on the relative differences in temperature between virus-inoculated leaves and virus-free leaves rather than absolute leaf temperature. Thermal image recording ended when the initial mosaic symptoms were visible.
Thermal image processing and analysis were carried out using FLIR Tools (FLIR Systems, USA) with the following steps: (1) to maintain uniformity, the temperature scale was set in the range from 25.5 to 30.0 °C and the color-palettes were changed to iron; (2) the values of atmospheric temperature and relative humidity, which had been measured previously, were added to FLIR Tools; and (3) to determine the temperature of the plant leaves, the leaf area was selected in the thermal images using elliptical selections, and the thermal data on each selected leaf area were exported to CSV format to analyze differences in plant leaf temperature between treatments.
2.3 Statistical Analysis
Statistical analysis was conducted using the independent sample t-test with the STAR application, version 2.0.1 (http://bbi.irri.org). In addition, a classification study was carried out to see how good the thermography approach was at classifying virus-free and virus-infected plants (performance assessment). The classifiers tested were Supervised Machine Learning classifiers (Naïve Bayes, Support Vector Machine, Random Forest, Decision Tree, k-Nearest Neighbors, and Artificial Neural Network), conducted using the WEKA (Waikato Environment for Knowledge Analysis) application, version 3.9.4 [30].
'Virus-free' and 'Virus-inoculated' were the two class groups used in the study. The test mode used ten-fold cross-validation. The method's performance was analyzed using the area under the receiver operating characteristic curve (AUC). Furthermore, the best accuracy of the thermography method was based on the AUC value.
3 Results and Discussion
The FLIR C2 Compact Thermal Imager used in this study is a passive thermal camera, which detects all infrared radiation. It is not limited to radiation emitted by the object but includes radiation from other sources reflected by the object. It causes the object to look warmer or cooler than the absolute temperature [31]. Therefore, this study did not measure the absolute leaf temperature but only evaluated the differences between treatment groups.
One day after inoculation (dai), the infected plant leaf (V1) temperature was 0.070 °C lower, on average, than the leaf temperature of the non-infected plants (V0) (Table 1). This was likely caused by sap residue that remained on the leaves of the inoculated plants. After inoculation (two to three days), the V1 temperature increased by 0.014 to 0.036 °C, on average, compared to the average V0 temperature. There were fluctuations in leaf temperature of the inoculated plants until mosaic symptoms were observed at 18 dai. The average V1 temperature was significantly lower than the average V0 temperature at 8 and 12 dai, with differences of 0.525 °C and 1.520 °C, respectively. In contrast, at 17 and 18 dai, the average V1 temperature was higher than the average V0 temperature with differences of 0.996 °C and 0.722 °C, respectively (Table 1).
Temperature changes in chili plants inoculated by the virus cannot be separated from the pathogenesis process in plants. It is known that there is a relationship between transpiration and the stage of disease progression caused by biotrophic pathogens such as viruses [26]. Plants may experience a decrease in transpiration rate due to a reduction of stomatal density as a systemic infection induced by viruses [15], which can also be caused by stomatal closure activity as a defense mechanism against virus infection [7]. Accumulation of plant hormones induced by viral infections is suspected to play an important indirect role in leaf temperature changes due to changes in transpiration rate. The accumulation of salicylic acid (SA) in TMV-infected tobacco leaves increases plant stomatal closure [7]. The presence of abscisic acid (ABA) integrated with SA in response to viral infections also affects guard cell activity and induces stomatal closure [32]. This condition is thought to have occurred in the chili plants studied at 2-3 dai, 6-7 dai, and 15-18 dai because the leaf temperature of the infected plants (V1), on average, was higher than the average leaf temperature of the noninfected plants (V0) (Table 1).
Moreover, plants produce ethylene (ET) when infected with pathogens [33]. The presence of ET can suppress ABA accumulation and stomatal closure induced by ABA [34]. ET can also suppress SA biosynthesis to decrease leaf temperature and to improve plant resistance to pathogen infection. Generally, the reproduction of many pathogens is suppressed under low temperatures, but low temperatures
do not reduce virulence [35]. This phenomenon is thought to have occurred at 5 dai and 8-13 dai because the average of the infected plants' leaf temperature (V1) was lower than the non-infected plants' leaf temperature (V0), on average (Table 1).
Table 1 Comparison of average plant leaf temperature between virus-inoculated (V1) and non-inoculated (V0) treatments using an independent sample t-test on image recording at 1-18 days after inoculation (dai).
| Observations (dai) | Average of leaf temperature (°C) ± SE | Difference ± SE | |||
|---|---|---|---|---|---|
| Virus-inoculated (V1) | Non-inoculated (V0) | (V1-V0) | t-value | p-value | |
| 1 | \(29.308 \pm 0.136\) | \(29.378 \pm 0.154\) | \(-0.070 \pm 0.019\) | 0.342 | 0.736 |
| 2 | \(29.059 \pm 0.107\) | \(29.044 \pm 0.103\) | \(0.014 \pm 0.004\) | -0.097 | 0.924 |
| 3 | \(28.483 \pm 0.097\) | \(28.446 \pm 0.100\) | \(0.036 \pm 0.002\) | -0.262 | 0.797 |
| 5 | \(28.172 \pm 0.198\) | \(28.273 \pm 0.258\) | \(-0.101 \pm 0.059\) | 0.311 | 0.760 |
| 6 | \(27.972 \pm 0.239\) | \(27.966 \pm 0.242\) | \(0.006 \pm 0.003\) | -0.018 | 0.986 |
| 7 | \(30.403 \pm 0.215\) | \(30.357 \pm 0.135\) | \(0.046 \pm 0.080\) | -0.182 | 0.857 |
| 8 | \(29.000 \pm 0.087\) | \(29.525 \pm 0.122\) | \(-0.525 \pm 0.035\) | 3.500 | 0.003** |
| 12 | \(26.165 \pm 0.108\) | \(27.685 \pm 0.098\) | \(-1.520 \pm 0.010\) | 10.410 | 0.000*** |
| 13 | \(26.687 \pm 0.207\) | \(27.169 \pm 0.160\) | \(-0.482 \pm 0.047\) | 1.840 | 0.083 |
| 15 | \(28.252 \pm 0.124\) | \(28.216 \pm 0.069\) | \(0.036 \pm 0.055\) | -0.252 | 0.805 |
| 17 | \(26.511 \pm 0.089\) | \(25.515 \pm 0.143\) | \(0.996 \pm 0.054\) | -5.200 | 0.000*** |
| 18 | \(29.155 \pm 0.096\) | \(28.434 \pm 0.097\) | \(0.722 \pm 0.001\) | -5.040 | 0.000*** |
Remarks: ** significantly different (p-value < 0.01); *** significantly different (p-value < 0.001); SE (standard of error)
Changes in plant leaf temperature during observation were visualized through false-color thermal imagery (Figure 1A).
The leaf areas with a lower temperature appear darker than those with a higher temperature (brighter). Visible differences can be seen at 18 dai when the virus-inoculated (V1) plant leaves appear brighter than the non-inoculated (V0) plant leaves. However, the plant defense mechanisms were unable to prevent the movement of TMV in the chili-pepper plants completely. A visual mosaic system in young leaves was observed at 18 dai and gradually moved out to other leaves, as observed at 34 dai (Figure 1B), making it evident that TMV movement had occurred. Furthermore, the serological test showed that the mosaic symptoms observed were consistent with TMV infection (data not shown).
Figure 1 False-color thermal image samples of control chili plants (V0) and chili plants inoculated with TMV (V1) (A); mosaic symptoms on the virus-inoculated chili plant leaves and recorded at 34 dai (RGB image converted to grayscale) (B).
Thermography using low-cost thermal cameras (Table 2) had 100% accuracy (AUC) at 12 dai with all algorithm classifications. However, we found early detection results at 8 dai with the best accuracy of 86.5% and 80.0% based on Naïve Bayes and k-Nearest Neighbors classification, respectively (Figure 2).
Table 2 Thermal camera specification and price comparison between low-cost and professional versions.
| Camera Type | ||||||
|---|---|---|---|---|---|---|
| FLIR A65(a) | FLIR TAU 2(a) | Optris PI 450i(a) | FLIR VUE PRO(a) | FLIR C2(b) | ||
| 7.5 to 13 | 7.5 to 13.5 | 8 to 14 | 7.5 to 13.5 | 7.5 to 14 | ||
| 640 × 512 | 640 × 512 | 382 × 288 | 640 × 512 | 80 × 60 | ||
| -25 to 135 | -40 to 80 | -20 to 900 | -20 to 50 | -10 to 150 | ||
| 25° × 20° | 3.3° × 2.5° | 80° × 54° | 24° × 18° | 41° × 31° | ||
| $8,043.00 | $6,360.00 | $6,300.00 | $3,649.00 | ± $615.93 (Rp9,100,000) | ||
| https://www.tequipment.net/ Viper/FLIR-A65-45/Fixed- Mount-Thermal- | https://www.oemcameras.com/ flir-tau-2-640-19mm-thermal- imaging-camera-core.htm | https://www.instrumart.com/ products/46916/optris-pi-450i- infrared-camera | https://www.tequipment.net/ FLIR/VUE-PRO-640-13mm- 9Hz/UAVs-and-Drones/ | https://www.tokopedia.com/ dutapersada/flir-c2-pocket- sized-thermal-imaging-camera | ||
| [5] | [37] [38] | [30] | [20] | |||
| 7.5 to 13 640 × 512 -25 to 135 25° × 20° $8,043.00 https://www.tequipment.net/ | 7.5 to 13 7.5 to 13.5 640 × 512 640 × 512 -25 to 135 40 to 80 25° × 20° $8,043.00 https://www.tequipment.net/ Viper/FLIR-A65-45 Fixed- Mount-Thermal- Imagers/?~=0 https://www.oencameras.com/ ffit-fau-2-640-19mm-thermal-\nimaging-camera-core.htm | | FLIR A65(a) | FLIR TAU 2(a) | Optris PI 450(a) | | 7.5 to 13 | | FLIR A65(a) | |||
Remarks: a) Professional thermal camera version
b) Low-cost thermal camera version
c) Web page listing thermal camera prices accessed on 15 August 2022 (camera prices can be changed at any time)
d) Research reference using thermal camera type
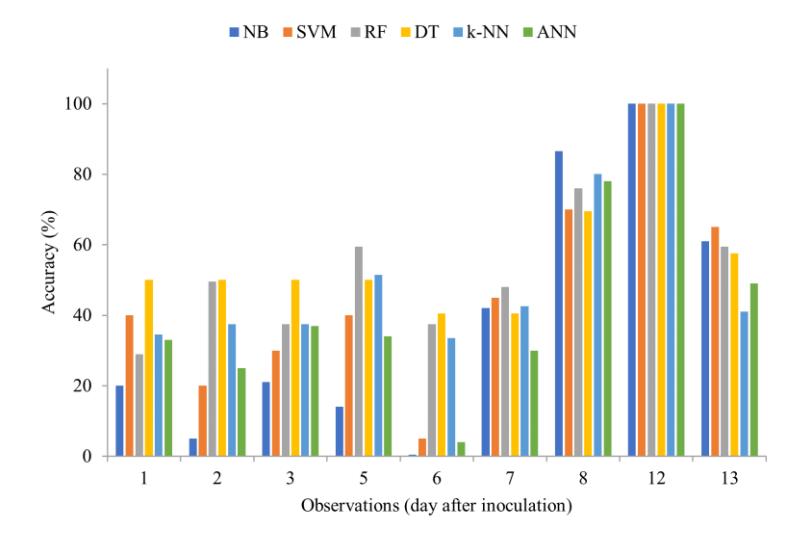
Figure 2 Classification of accuracy (AUC) obtained from supervised machine learning classifier on image recording at 1-13 days after inoculation (dai). NB (Naïve Bayes); SVM (Support Vector Machine); RF (Random Forest); DT (Decision Tree); kNN (k-Nearest Neighbors); ANN (Artificial Neural Network).
4 Conclusion
The low thermal sensor resolution of the FLIR C2 as a low-cost thermal camera does not reduce their ability to detect significant differences in chili-pepper leaf temperature caused by virus infections with 80.0 to 86.5% accuracy at 8 dai. In further research, more trials and additional measurements are needed to validate the thermal data, e.g., using a larger number of samples, measurements of stomatal conductance, transpiration rate, or plant hormone accumulation. Also, mixed-inoculation of several viruses will improve our understanding of possible early detection of virus symptoms using a low-cost thermal camera.
Acknowledgement
The author is grateful to Indonesia's Government for the research funding provided through the Ministry of Research and Technology/National Research and Innovation Agency, Deputy for Research and Development Strengthening. The research funding was provided under the Doctoral Dissertation Research scheme for the 2020 fiscal year (contract number 1/E1/KP.PTNBH/2020).