
1 Introduction
The agricultural sector is an important part of economic development in Indonesia. As an agricultural country [1,2], Indonesia produces carbohydrates such as corn [3-5]. Trends in annual corn production in Indonesia go up and down, following changes in the weather that are increasingly influenced by climate change [6,7]. Apart from climate change, agricultural success factors can also be influenced by diseases that attack agricultural crops such as corn [8-10]. Currently, there are three prevalent types of corn disease in Indonesia, i.e., blight spot, gray leaf spot, and common rust [11]. These diseases often attack maize crops, thus disrupting the production process. Seeing the large area of corn plantations, farmers often have difficulty recognizing the types of diseases that exist in corn plants. The difficulty of manually identifying [12] the type of disease can be solved by using an information technology approach based on artificial intelligence such as classification [13] through computer vision. Currently, there
Received July 7 th, 2022, 1 st Revision October 17 th , 2022, 2 nd Revision March 13th , 2022, Accepted for publication May 3 rd , 2023.
Copyright © 2023 Published by IRCS-ITB, ISSN: 2337-5787, DOI: 10.5614/itbj.ict.res.appl.2023.17.2.3 are quite a few machine learning and deep learning techniques applied in the agricultural sector [14]. The implementation starts from developing a model that is pretrained for application in drones, embedded devices, mobile applications, and so on. In model development, various architectures have been introduced, such as CNN to Vision Transformer for computer vision tasks [15,16]. Using a CNN is a common solution that is often used for vision problems, especially for image classification.
Noola and Basavaraju used Enhanced K-Nearest Neighbor (EKNN) by adopting a basic k-nearest neighbor (KNN) model in their research to find illness categorization on corn leaves using CNN and different architectures. As a result, their proposed model achieved excellent accuracy, sensitivity, specificity, and AUC values of 99.86, 99.60, 99.88, and 99.75, respectively [17]. Amin, et al. conducted a study in 2022 utilizing End-to-End Deep Learning. To extract deep characteristics from corn plant photos, this model uses two pre-trained convolutional neural networks (CNNs), i.e., EfficientNetB0 and DenseNet121. The proposed model achieved a classification accuracy of 98.56 percent, demonstrating its superiority to ResNet152 and InceptionV3, which obtained a classification accuracy of 98.37 percent and 96.26 percent, respectively [18]. We investigated recent advancements in this field through Google Research. Tolstikhin, et al. [19] in 2021 introduced the MLP-Mixer, which uses Multi-Layer Perceptron (MLP) for computer vision. Dosovitskiy, et al. in 2021 introduced Vision Transformer (ViT) for image classification or computer vision tasks in general [20]. Using MLP-Mixer, classification problems can be solved with an accuracy that is quite competitive compared to other models. In further research, based on the Mixer, Convolutional and Transformer models, Trockman, et al. (2022) introduced the ConvMixer [21] model to perform computer vision work. Furthermore, there is a dataset augmentation technique to conduct model training, called MixUp [22]. Another recent data augmentation method used to improve the robustness of the model is CutMix [23].
The use of augmented data to increase the robustness of a model has been carried out by several researchers, including by Zhang in 2021 [24]. In his research, CutMix enhanced the model's resistance to input corruption as well as its out-ofdistribution detecting capabilities. The focus of this research was a naturally enhanced augmentation strategy with superior concision and effectiveness in classifying Bengali handwritten graphemes. In addition, a similar study for CutMix was conducted by Wenming, et al. in 2021 [25]. They proposed the Attention-Guided CutMix Data Augmentation Network (AGCN) to train the network to pay more attention to minor details in bird parts. The findings showed that our proposed data augmentation increases the network's classification performance, and AGCN performs exceptionally well on the demanding dataset CUB Birds.
The present research focused on applying ConvMixer to solve the problem of disease classification in corn leaves. This study used an open dataset, where the processed image was already in the form of a crop image. The main contribution of this research was to compare preprocessing techniques on data augmentation using MixUp and CutMix for improving the robustness of the model. In this paper, we will discuss the ConvMixer-based model, then look at other works related to the model used. In the next chapter, we will discuss the method used in processing the disease classification in leaves and then the results of the performance of the implemented model with data augmentation will be discussed.
ConvMixer consists of a patch embedding layer followed by repeated application of a simple fully-convolutional block. The creator maintains the spatial structure of the patch embedding. Patch embedding with patch size p and embedding dimension h can be implemented for convolution with input channels, h output channels, kernel size p, and stride p. This technique is expressed in Eqs. (1) to (3).
\[z_0 = BN(\sigma\{Conv_{cin} \rightarrow h(X, stride = p, kernel\_size = p)\})\] (1)
Depthwise convolution (i.e., grouped convolution with groups equal to the number of channels, h, is followed by pointwise convolution (i.e., kernel size 1 1) in the ConvMixer block. For depthwise convolution, ConvMixer operates best with extremely large kernel sizes. Following each convolution is an activation and post-activation BatchNorm:
\[z'_{l} = BN \left(\sigma \left\{ConvDepthwise\left(z_{l-1}\right)\right\}\right) + z_{l-1}\] (2)
\[z_{l+1} = BN \left( \sigma \left\{ ConvPointwise \left( z_l' \right) \right\} \right)\] (3)
This conducts global pooling to get a feature vector of size h, which we feed to a Softmax classifier after several executions of this block. In many ways, ConvMixer is comparable to ViT (and MLP-Mixer) [21], as can be seen in Figure 1.
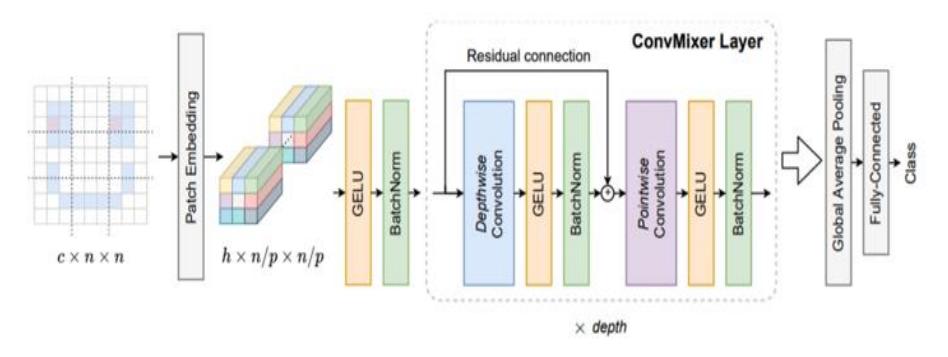
Figure 1 ConvMixer architecture [21].
Data augmentation was introduced in 1998 [26] and was later formalized by some researchers [27]. Another data augmentation technique, called MixUp, was developed by Zhang, et al. [22]. To formula for MixUp data augmentation can be seen in Eqs. (4) and (5).
\[\tilde{x} = \lambda x_i + (1 - \lambda) x_j \tag{4}\] where , are raw input vectors, and
\[\tilde{y} = \lambda y_i + (1 - \lambda) y_j \tag{5}\] where , are one-hot label encodings.
Note that the lambda values are in the [0, 1] range and are sampled from the beta distribution [28]. To increase the robustness of the deep learning model that we implemented, we tried to compare it with a different data augmentation, namely CutMix. CutMix was first introduced by Sangdoo Yun et al. in 2019 [23]. CutMix is a data augmentation strategy that tackles the issue of regional dropout algorithms' information loss and inefficiency. Rather than removing pixels and filling them with black or grey pixels or Gaussian noise, the deleted portions are replaced with a patch from another image, and the ground truth labels are mixed proportionately to the combined images' pixel count. The formula used in CutMix can be seen in Eqs. (6) and (7).
\[\tilde{x} = M x_i + (1 - M) x_j \tag{6}\]
\[\tilde{y} = \lambda y_i + (1 - \lambda) y_j \tag{7}\] where M is a binary mask that indicates the cutout and the fill-in regions from the two randomly drawn images and in the range [0, 1] is drawn from a beta (α, α) distribution. The coordinates of the bounding boxer Eq. (8) are:
\[B = r_{\chi}, r_{y}, r_{w}, r_{h} \tag{8}\] which indicates the cutout and fill-in regions in the case of images. The bounding box sampling is represented by Eqs. (9) and (10):
\[r_{\chi} \sim U(0, W), r_{W} = W\sqrt{1 - \lambda} \tag{9}\]
\[r_{y} \sim U(0, H), r_{h} = H\sqrt{1 - \lambda} \tag{10}\]
In conducting this research we evaluated the model using the metrics of precision, recall, accuracy score, and F1 score [29,30]. The respective metrics can be represented by Eqs. (11) to (14):
\[Precision = TP/(TP + FP)\] (11)
\[Recall = TP/(TP + FN) \tag{12}\]
\[Accuracy = \frac{(TP+TN)}{TP+TN+FP+FN} \tag{13}\]
\[F1 = 2 * \frac{(Precision*Recall)}{Precision*Recall}\] (14)
The number of corn leaves properly classified into the corn disease classes, as determined by the algorithm above, is known as the true positive (TP) rate. The false positive (FP) rate refers to the number of corn leaves assigned to classes which they do not belong to. The true negative (TN) rate is the amount of correctly recognized negative data. False negatives (FN) refer to data being categorized as negative when it should be positive.
2 Material and Method
In this stage we explain the stages of the experiment. First, we implement data preparation to measuring the performance of the model used to classify diseases in corn leaves.
2.1 Research Workflow
In this study, our research workflow is shown in Figure 2. As already shown, the crop leaf diseases dataset was obtained from the Kaggle open dataset [31]. The data obtained had a size of 256 x 256 pixels, where in the data preprocessing, the image size is changed to 64 x 64 pixels to make the computational process easier when training the model. Furthermore, before creating the model, it is necessary to prepare an augmented training dataset. In our work, a performance training model was tested using a non-augmented dataset and augmented dataset (MixUp and CutMix). After the augmented data are ready, the next step is to create a model using the ConvMixer model approach. After that, a training model is carried out where there are two training datasets used, namely non-augmented and MixUp augmented. Finally, after the model has been trained, measurements are made using the model's performance metrics on the two different training datasets. The workflow of the whole research can be seen in Figure 2.
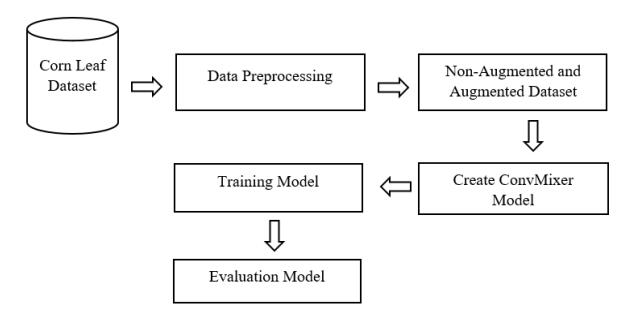
Figure 2 Research workflow.
2.2 Dataset Preparation and Processing
In conducting the data preparation and preprocessing stage, a dataset was collected from the Kaggle open dataset [31]. The dataset consisted of crop disease data on leaves of corn, rice, and potato. However, in conducting this research, we only used corn leaf diseases as a dataset to implement in the model. The dataset contained 14,632 images in total and had four classes, as shown in Table 1. The images had an initial size of 256 x 256 pixels and were preprocessed to a smaller size of 64x64 pixels before the classification process using the selected model.
In Table 1 we can see that there were four label classes in the dataset. Label 0 is common rust, Label 1 is gray leaf spot, Label 2 is healthy, and Label 3 is leaf blight.
After identifying the dataset to be used, the next step was to split the dataset into training, testing and validation data with a portion of 70%, 20% and 10%, respectively. In the training folder, the number of images from the four classes was 10,240 images, while the testing folder contained 2,931 images and the validation folder contained 1,461 images from a total of four classes. Furthermore, in the preprocessing dataset, we transformed the training, testing, and validation datasets to one hot encoding so that they represented categorical variables as binary vectors on the corn leaf diseases dataset.
Table 1 Corn leaf classes and labels.
| Class | Label | Image | Total |
|---|---|---|---|
| Corn Common Rust | 0 | 3814 | |
| Corn Gray Leaf Spot | 1 | 3284 | |
| Corn Healthy | 2 | 3718 | |
| Corn Leaf Blight | 3 | 3816 |
2.3 Dataset Augmentation
To augment the dataset to increase the model's robustness, we used MixUp and CutMix augmentation. In the MixUp routine, we used a new virtual dataset using the same training dataset and applying a lambda value within the range [0, 1], sampled from a beta distribution – such that, for example, _ = ∗ 1 + (1 − ) ∗ 2 (where 1 and 2 are images) and the same equation was applied to the labels as well. In this stage, we combined two images to produce one new image. In principle, we can combine more images than two, only it will affect the computational cost.
Meanwhile, in the CutMix augmented dataset, CutMix was programmed to use the entire object extent as classification cue, an approach shared by CutOut [32], while ensuring that two items are recognized from partial views in a single image to boost training efficiency. Meanwhile, CutMix was able to precisely locate the two object classes of corn leaf diseases.
3 Result and Discussion
3.1 Experimental Results
In doing our experiment, in addition to using the original input image data, we used MixUp and CutMix for the input images. For CutMix, one image class was combined with another image class chunk and then used as a new image. The MixUp and CutMix results from the 64 x 64 image input size can be seen in Figure 3.
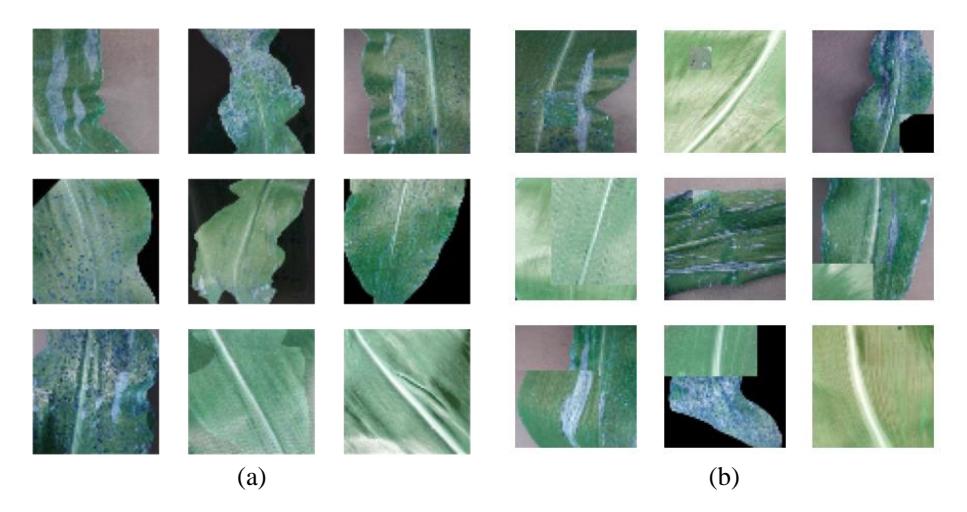
Figure 3 Data augmentation by using MixUp (a) and CutMix (b) datasets.
In building a pretrained model using the ConvMixer model, a parameter setting is needed to achieve optimal results in the training process. As an important part of the ConvMixer architecture, this model has a patch embedding stage followed by isotropically repeated convolutional blocks. The most important parameter settings are patch size (4), number of patches (8), embedding dimension (256) and depth (4).
With these parameter settings, we conducted a dataset training experiment using the existing model. The first dataset was the non-augmented dataset, with fifty epochs. Next, we trained the dataset using the MixUp dataset and then the CutMix dataset to see the effect on the robustness of the model. Furthermore, the model testing results from the three experiments are shown in Table 2.
Table 2 Precision, recall, F1-score non-augmented dataset vs augmented dataset.
| Label | Precision | Recall | F1-Score | Support | ||||||
|---|---|---|---|---|---|---|---|---|---|---|
| Non-Aug | MixUp | CutMix | Non-Aug | MixUp | CutMix | Non-Aug | MixUp | CutMix | ||
| 0 | 1.00 | 1.00 | 1.00 | 1.00 | 1.00 | 1.00 | 1.00 | 1.00 | 1.00 | 764 |
| 1 | 0.95 | 0.98 | 0.98 | 0.97 | 0.98 | 0.97 | 0.96 | 0.97 | 0.97 | 658 |
| 2 | 1.00 | 1.00 | 1.00 | 1.00 | 1.00 | 1.00 | 1.00 | 1.00 | 1.00 | 745 |
| 3 | 0.98 | 0.98 | 0.97 | 0.96 | 0.98 | 0.98 | 0.97 | 0.97 | 0.98 | 764 |
Table 2 illustrates the precision, recall, and F1-score values for the performance of the ConvMixer model used for testing using the non-augmented, MixUp and CutMix augmented datasets. It can be seen that for precision, the lowest value was for Label 1 using the non-augmented dataset; the value obtained was 0.95. When using the MixUp and CutMix augmented datasets the value increased to 0.98 for the same label. For Label 3, the lowest precision value was on the CutMix dataset, which was 0.97 while for the other two datasets had a value of 0.98. For the other labels, the precision values for all datasets were the same. Furthermore, for the recall value, Label 1 had the lowest value for the non-augmented and the CutMix augmented datasets with a value of 0.97. For Label 3, the lowest recall value was 0.98 for the non-augmented dataset, while for the other labels the recall value was the same. Finally, the lowest F1-score value was for Label 1 for the non-augmented dataset, at 0.96, and the MixUp and Cut Mix augmented datasets had an F1-score value of 0.97. For Label 3, the highest value was achieved with the CutMix dataset, at 0.98, while the other datasets had an F1-score value of 0.97, and the other labels had the same F1-score value.
The predictions made for the classification of disease types on corn leaves can be seen in the confusion matrix in Figure 4. All three figures illustrate the confusion matrix of the two dataset that were trained differently.
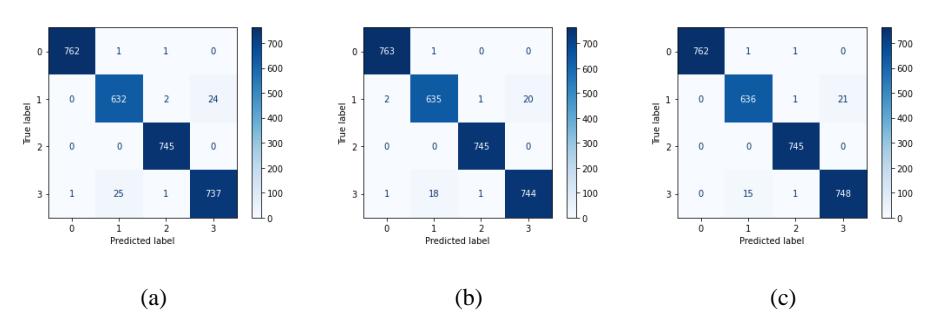
Figure 4 Confusion matrix for the non-augmented and augmented datasets.
Figure 4(a) is a confusion matrix of the non-augmented dataset, where for Label 0, containing 764 data, 762 data were correctly classified as corn leaves that have common rust disease. For Labels 1, 2 and 3, the number of correct classifications by the model was 632, 745 and 737, respectively. For the result in Figure 4(b), when we changed the training data to the MixUp data, there was a change in the test results to 763 that were correctly classified for Label 0. Furthermore, for Label 1 out of 658 there were 635 data that were correctly predicted as images with gray leaf spot. For Label 2 out of 745 images all the predicted results were correct. Finally, for Label 3 out of 764 images, when using the non-augmented dataset, 737 images were correctly predicted, which increased significantly to 744 images with the MixUp augmented dataset.
Moreover, to increase the robustness of the model we replaced the training data with the CutMix dataset. The results were surprising because the accuracy number increased as described in the previous evaluation model. From Figure 4(c), the confusion matrix shows that the prediction results for Label 0 were the same as for the non-augmented dataset, while for Label 2 it was the same as for non-augmented and MixUp augmented dataset. However, for Label 1 and Label 3, the number of correct classifications rise to 636 and 748, respectively.
3.2 Discussion
Using a model with an architecture like ConvMixer certainly makes the model structure simpler. This is very helpful in the computing process by making it more efficient. Another thing, which was the focus of the research, is that augmentation is important to increase the accuracy of the model during training and evaluation. Given a restricted set of datasets, the model can be trained by making changes to the existing image. The size of the dataset is increased as a result of the image change, which contributes to the model's robustness. To improve the performance of ConvMixer for classifiers, data augmentation techniques that improve localization and generalization performance have been proposed.
In this experiment, we compared the ConvMixer model to several state-of-the-art image classification models, i.e., CNN and modern transformer-based models such as ViT, Swin Transformer and MLP-Mixer, to see how well it performs. Using the same dataset, we created these models from scratch. After adjusting the parameters, the ConvMixer model had a higher accuracy without data augmentation, at 0.9812. This experiment demonstrated that the ConvMixer model outperformed the other models in terms of disease classification on corn leaves.
Table 3 shows the F1 score and accuracy value from a comparison of several state-of-the-art models. With respect to the accuracy, CNN had the lowest score, at 0.9696, followed by the other models with higher values than 0.9700, while ConvMixer had the highest value, at 0.9812. As for the F1-score, in Table 3 the lowest value is 0.9733 for the CNN model and the highest is 0.9806 for the ConvMixer model. The ConvMixer model also had an accuracy that could increase according to our experiments when trained using MixUp and CutMix augmented data.
Table 3 Comparison between ConvMixer and several other models.
| Model | F1-Score | Accuracy | |
|---|---|---|---|
| CNN | 0.9733 | 0.9696 | |
| Vision Transformer (ViT) | 0.9762 | 0.9771 | |
| MLP-Mixer [33] | 0.9803 | 0.9809 | |
| Swin Transformer | 0.9805 | 0.9809 | |
| ConvMixer | 0.9806 | 0.9812 | |
Moreover, the ConvMixer model that we used works very well using convolution at the beginning and then uses a computational process according to the architecture to produce classifications on corn leaf diseases more accurately. Here are some important discussion points related to our experiments:
- 1. As in the original paper, MixUp is a data augmentation method that consists of only two parts, namely random convex combination of raw input from the corn leaf image, and correspondingly, convex combination of one-hot label encodings. The experimental results showed that MixUp is a diagnostic and straightforward data augmentation principle that can be implemented in the classification of corn leaf disease. With MixUp, another advantage that can be obtained is that we can create synthetic examples, especially when we lack a large enough dataset, without incurring high computational costs. In our experiment, the dataset of corn leaf disease images that was classified contained less than 20,000 images.
- 2. CutMix augments the corn leaf disease training images by cutting and pasting random patches (from four classes). The ground-truth labels are
Another thing that we found in our experiment was that when using an augmented dataset the accuracy is increased. This confirms the findings of previous researchers who proved that augmenting the dataset with CutMix will produce higher accuracy compared to MixUp, which will then be higher with a nonaugmented dataset. This is certainly a recommendation for other research in the field of deep learning to try augmented data as an important part in producing better accuracy in the model used.
4 Conclusion
From the results of our experiments, it was proven that the use of the ConvMixer model could produce an accuracy of 0.9812 for the problem of classifying diseases in corn leaves. However, the data accuracy results were further improved by using the MixUp and CutMix augmentation techniques for improving the robustness of the ConvMixer pretrained model. Our experimental results proved that there was an increase in the accuracy of the training results on the data augmented using MixUp and CutMix to 0.9925 and 0.9932, respectively. This increase in accuracy can help corn farmers and related parties to make decisions in dealing with corn disease problems. In the future, the early detection of types of diseases can help farmers in taking precautions that can have a positive impact on the corn production process. Moreover, this model can be implemented on embedded devices or mobile devices for solving problems on agricultural land.