
1 Introduction
In today's rapidly changing business environment, companies face the ongoing challenge of staying innovative to remain competitive. Thus, a company's ability to continuously innovate is crucial for enterprises, leading to a growing number of studies on leveraging innovation capabilities within organizations. High innovation capabilities enable companies to transform knowledge into new intellectual assets, such as improving existing products and guiding employees to develop a long-term and sustainable organization [1].
Research has also shown that organizations with strong data management capabilities are more likely to engage better in both explorative and exploitative innovation [2]. Despite the increased awareness of the importance of data assets, many organizations fail to effectively manage and govern them, which hinders their ability to compete in a volatile business environment [3]. Data management capabilities are essential for innovation because they empower companies to reconfigure and enhance the utilization of big data assets [4]. Hence, effective data management is crucial for optimizing an organization's operational efficiency, decision-making processes, and risk management [3], which increases the firm's ability to manage innovation processes.
From a different perspective, innovation processes require the involvement of skillful employees; hence, integration across different functional areas in organizations is important. According to Troy, et al. in [5], cross-functional integration can be defined as the extent to which there is interaction, communication, sharing of information, and coordination across various functions. It has been suggested that cross-functional integration may be advantageous for companies when the degree of uncertainty in the innovation process is relatively high [6], the degree of complexity is high [7], or when the process of innovation requires integrated knowledge sources from different functional areas [8]. By engaging in collaborative efforts across various departments, a company can enhance its capacity to integrate marketing, R&D, and other supplementary knowledge assets, thereby generating novel insights [9].
Cross-functional integration could also potentially significantly facilitate the transformation of externally acquired knowledge into enhanced innovation performance [10]. Innovation relies heavily on knowledge utilization; hence, Foss, et al. argue in [11] that coordination and integration among functional departments frequently enhance the utilization and worth of external knowledge. Cross-functional integration also allows companies to re-evaluate diverse viewpoints and restructure existing capabilities to produce innovative concepts [10], leading to a higher level of product innovation outcomes [12].
While the researcher agrees that cross-functional integration may increase innovation performance within an organization [13], it is still unclear whether cross-functional integration may influence both incremental and radical innovation [13]. The urgency to equally apply cross-functional integration has also been questioned by Rubera, et al. in [7]. Meanwhile, Yang and Tsai [10] studied the mediating effect of cross-functional integration on innovation and Pérez-Luño, et al. [6] studied the moderating effect of cross-functional integration on the relationship between product innovation and performance. The present study proposes that cross-functional integration may serve as a moderating variable that could amplify the influence of data management
capabilities on innovation capabilities. Thus, this study investigated data management capabilities and their influence on innovation capabilities, especially explorative and exploitative innovation and how cross-functional integration moderates both relationships.
2 Model Development
2.1 Development of Data Management Capabilities as a Thirdorder Construct
Applying a higher-order modeling approach facilitates a clearer comprehension of the pathways and relationships within the model [14]. It is because a higherorder construct can reduce collinearity issues among formative indicators through the restructuring of indicators and constructs across more concrete subdimensions [15]. Hence, data management capabilities in this study will be conceptualized as a third-order construct. Figure 1 displays the conceptual model in this research.
Based on past studies, this study proposes data management capabilities as a third-order construct that is manifested in three second-order constructs (data governance, technology, and skills) and eleven first-order constructs: data access, data quality, data security and privacy, data management, meta-data management, analytical skills, communication skills, data science skills, IT infrastructure and capability, sophistication of data analytics tools, data warehouse and business intelligence technology. Each of the proposed constructs will be discussed in the next section.
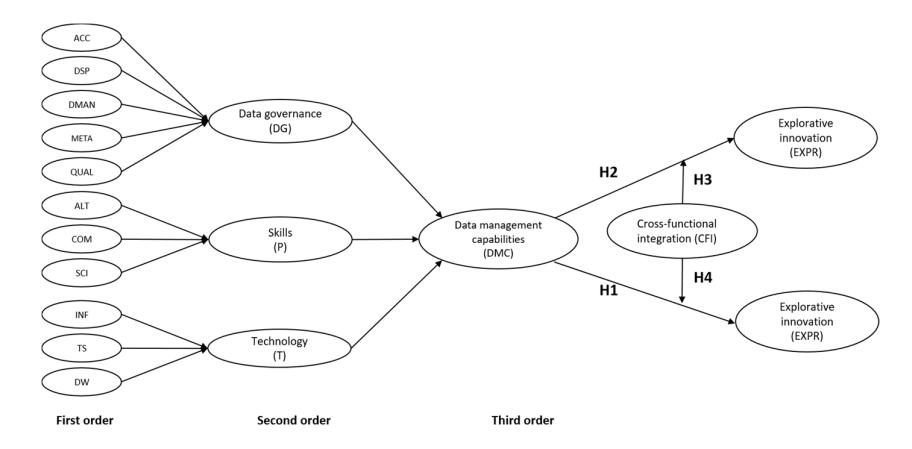
Figure 1 Data management capabilities as a third-order construct.
2.1.1 Resource-based View on Data Management Capabilities
Shamim, et al. [2], Nisar, et al. [16], and McAfee et al. [17] have pointed out that it is vital to possess big data management capabilities. Proficiency in handling technical aspects of big data does not only rely on having data analytical capabilities but also on having data management capabilities [18]. From the management perspective, diverse challenges in big data analytics and data management have driven the urgency to simplify the structure of data management to fully utilize the full potential of data analytics and make informed decisions for various sectors [19]. Nevertheless, determining what qualifies as good data management is often complicated, as indicated by Hartman, et al. in [20]. Thus, research on data management capabilities has gained much attention in the information systems stream. Data management refers to the process of organizing, maintaining and sharing data to ensure its accuracy, accessibility, and usability [21]. The rise of big data has increased the demand for enhanced data management, which is different from the traditional approach [22]. Moreover, effective data management helps companies to ensure data integrity and accessibility, which comply with companies' legal requirements [23]. Data management tasks involve data acquisition, cleaning, integration, transformation, and storage [24]. Data management also includes other vital activities such as data governance, data quality management, and data integration [25].
According to the resource-based view, an organization's competitive advantage can be enhanced by deploying a distinct set of resources that are valuable, rare, imperfectly imitable, and non-substitutable [26]. Gupta and George in [4] used a resource-based view to build a research model on data management capabilities comprising three primary resources: tangible, intangible, and human resources. Meanwhile, drawing on the dynamic capability view, [2] proposed data management capabilities consist of four dimensions: democratization, contextualization, experimentation, and execution capability. While most scholars, such as Akter, et al. in [27] and Khatri and Brown in [28], have discussed data management in the context of big data, this study argues that both small and big data equally matter. Hence, this study addresses both the utilization of small and big data in data management capabilities. Thus, to contribute to advancing the knowledge of information systems, this study proposes another construct of data management capabilities based on previous literature by drawing on resource-based theory.
2.1.2 Data Governance
Data management and data governance can be considered interrelated and interdependent functions of an integrated domain encompassing people, processes, technologies, and interactions throughout the organization [3]. Governance and management are distinct, where governance focuses on the process of decision-making and the individual accountable for making decisions, with the objective of guaranteeing effective administration and utilization of resources [29]. Conversely, management refers to the implementation of decisions [29]. Thus, data management may be influenced by data governance [30].
Data governance is crucial for data management and involves controlling, planning, and monitoring all data management activities [3]. Thus, data access is crucial in data governance. Data governance also involves addressing challenges such as data security, privacy, and compliance [31], which often emphasizes the importance of data quality [29][30][32]. Collecting, maintaining, and integrating data is also crucial in data management [29]. Meta-data management is also important since it helps the interpretation of the meaning or data semantics [29]. Therefore, in this study, data governance was seen as comprising five subdimensions: data access (ACC), data management (DMAN), data security and privacy (DSP), data quality (QUAL), and meta-data management (META).
2.1.3 Skills
The significance of employees' knowledge and skills in collecting data cannot be overlooked. As a result, employees are regarded as crucial stakeholders [33]. The importance of people as a dimension of data management capabilities has also been highlighted in past studies, such as Brinch, et al. [34] and Cosic, et al. [35]. Given that employees and managers have limited knowledge of digitalization and analytical capabilities [34], companies must provide training to enhance employees' knowledge and skills. Data science skills play a pivotal role in the advancement of data analytics proficiency since such skills enable organizations to effectively examine and interpret vast amounts of data, resulting in valuable insights [28]. Expertise in data science skills is essential for employees to facilitate business growth and promote innovation because it allows employees to uncover patterns and correlations within data sets [36]. Data management capabilities also involve analytical skills, requiring employees to break down complex problems into more manageable components and evaluate them using suitable analytical techniques [37].
Data analysts frequently work within interdisciplinary teams, where effective communication is essential for the purposes of coordination, information sharing, and conflict resolution [38]. Effective communication entails the capability to convey insights derived from data analysis to stakeholders, which includes explanations and results of statistical analysis [37]. Communication skills will lead to more efficient and effective collaboration in working in a data-driven environment. Thus, this study proposes three kinds of skills: data science (SCI), analytical (ALT), and communication skills (COM).
2.1.4 Technology
Technology is also regarded as an important dimension of data management capabilities, which has been highlighted by Korsten, et al. in [39], Hornick in [40], and Limpeeticharoenchot, et al. in [41]. In the digital era, a data warehouse environment and business intelligence (BI) technology also provide flexibility in data administration and monitoring, leading to efficient analytical processing [42]. The identification of appropriate tools is also important to leverage the capabilities of data management [43], as technology must ensure that accessible data is used through the utilization of efficient software and hardware [44]. Consequently, it is imperative for organizations to get sufficient support from a comprehensive IT infrastructure with high-capacity storage and processors to implement extensive data analysis [45]. Hence, the ability to deploy and manage tools, infrastructure, and technology is crucial to support effective data management [46]. Therefore, this study proposes three kinds of technology dimensions: data warehouse and business intelligence technology (DW), data analytics tools sophistication (TS), and IT infrastructure and capability (INF).
2.2 Relationship Between Data Management Capabilities and Innovation Capabilities
Past studies have illustrated that companies with a high degree of innovation capabilities are able to seize market opportunities timely and, as a result, actively adapt to customer demands and external changes [47]. Innovation capability can be defined as a company's ability to collectively utilize knowledge, skills and resources in innovative activities to add to the company's value [48]. In the midst of a competitive market, companies need to strive and be ambidextrous organizations by balancing exploitative and explorative innovation [49]. Nevertheless, many companies continue to face challenges in balancing between explorative and exploitative innovation as a result of the intense competition for limited resources [50]. Exploitative innovation aims to improve products and increase efficiency, while explorative innovation experiments with new features and is related to flexibility [51]. In contrast to exploitative innovation, which is motivated by existing practices, explorative innovation directs its attention to potential opportunities that may arise [52]. Consequently, organizations with strong explorative capabilities typically exhibit a high awareness and responsiveness to external environment shifts, while exploitative innovation leads companies to focus on improving operational efficiency.
In an environment where technologies and customer demands change rapidly, determining a company's success in sustaining its competitiveness is challenging [1]. Hence, innovation capability is considered crucial to help companies maintain their competitive advantage [53]. Effective data management allows
organizations to generate valuable insights into decision-making processes through well-organized data [21]. Organizations may take advantage of wellorganized and accessible data by identifying opportunities that could drive innovation [54][55]. Hence, data management capabilities enable organizations to access high-quality data, understand patterns, and gain insight from data analysis, which leads to new knowledge creation [2]. Innovation processes may also be enhanced through data management by enabling organizations to collect and analyze external data, such as industry trends and customer feedback [56].
Prior studies identified a positive link between data management capabilities and innovation capabilities. For example, Shamim, et al. [2] identified a significant positive relationship between data management capabilities and both explorative and exploitative innovation through the mediating variable of big data value creation. Zotoo, et al. [55] found positive impacts of data management capabilities on innovation performance through big data value perception. Khan et al. [57] found that data management capabilities play an important role as antecedents of both explorative and exploitative activities. Thus, this study proposes the following two hypotheses:
H1: Data management capabilities have a significant positive impact on exploitative innovation
H2: Data management capabilities have a significant positive impact on explorative innovation
2.3 The Moderating Effect of Cross-Functional Integration
Given the existence of diverse functional departments and teams possessing distinct knowledge and resources, it is important for a company to integrate these entities to facilitate the exchange of knowledge and resources [58]. Through this integration, the company can effectively capitalize on the synergetic effects resulting from the combination of these diverse knowledge and resources [59]. From the perspective of organizational learning, cross-functional integration may play a key role in translating externally absorbed knowledge into innovation performance [60]. A firm is able to improve the flow of external knowledge into the process of innovation by integrating a wide range of functional expertise, thus increasing the probability of attaining success in innovation [61]. Through increasing communication frequency and flow of information, cross-functional integration can be advantageous for developing and creating new products [5]. Thus, it can be argued that cross-functional integration may affect explorative and exploitative innovation by enabling smooth coordination and communication within organizations. Therefore, this study hypothesized that the relationship
between data management capabilities and both explorative and exploitative innovation may be amplified by cross-functional integration.
H3: Cross-functional integration will moderate the relationship between data management capabilities and exploitative innovation
H4: Cross-functional integration will moderate the relationship between data management capabilities and explorative innovation
3 Methods
3.1 Survey Instrument
A questionnaire was developed and operationalized based on past studies. A Likert scale was used to measure the items, ranging from 1 to 5 (strongly disagree to strongly agree). The measurement items of the dependent variables – explorative and exploitative innovation – were adapted from Jansen, et al. [49] comprising six indicators for each dependent variable. Three indicators for the moderating variable, namely cross-functional integration, based on Liao, et al. [62]. The measurement items for data governance were adapted from Gupta and George [4], Paul, et al. [63], and Wang and Strong [64]. Indicators for measuring skills dimensions were operationalized based on Matin, et al. [65], Power [66], and Tippins and Sohi [67]. The measurement indicators for the technology dimension were adapted from Ghasemaghaei, et al. [43] and Gupta and George [4]. The complete list of measurement items can be seen in Appendix A.
3.2 Data Collection
A pre-testing of fifteen respondents, consisting of data analytics experts and university researchers, was conducted to confirm the clarity of the questionnaire content and ensure that the questionnaire was easy to understand. The initial questionnaire items were then modified by considering the fifteen respondents' feedback in the pre-testing. To confirm the clarity of the survey items, Huang et al. [68] also conducted a pre-testing to test the initial questionnaire to ten random respondents.
The questionnaire was then distributed to medium-size companies (20-99 employees) and large-size companies (100 or more employees) in Indonesia. This study did not limited its search for potential participants to a specific functional department because this study assumed that data analytics can be frequently implemented in all functional areas. However, three inclusion criteria were used to select appropriate respondents, i.e., junior manager as the minimum position held, data analytics being implemented throughout the company's activities, and the respondent having experience in utilizing data analytics. From May to October 2023, the questionnaire was distributed using a Google form. After five months, 183 respondents filled out the questionnaire but 67 of them did not fit the research criteria. Hence, only 116 data samples were used and processed in this study.
3.3 Two-stage Approach for Model Evaluation
A two-stage approach was applied to test the research model in this study because, according to Sarstedt, et al. [15], a two-stage approach is more suitable for small sample sizes and may overcome problems in a reflective-higher order construct. The first stage involved testing outer loadings of the first-level order, and the latent variable scores from the first stage were used as indicator scores of the higher-order construct measurement model [14,15]. The validity and reliability were tested at all stages in the two-stage approach. In this study context, the indicators of first-order construct are reflective. Therefore, in the first stage, the measurement model evaluation focused on assessing the outer loading factor, average variance extracted (AVE), Cronbach's alpha (CA) and composite reliability (CR). In the second stage, the latent variable scores from the first stage (ACC, DMAN, DSP, QUAL, META, ALT, COM, SCI, DW, INF and TS) served as indicators of the second-order construct. The third-order construct (data management capabilities) was measured in the third stage using the latent variable scores from the second-order construct (data governance, skills, and technology).
4 Results
According to Hair, et al. [69], partial least squares-based structural equation modeling (PLS-SEM) estimates and constructs hierarchical models by removing uncertainties associated with inadmissible solutions using flexible assumptions. Hence, this study applied PLS-SEM to assess the higher-order construct of data management capabilities, and SmartPLS Software version 3.0 was used in the data analysis process.
4.1 Profile of Respondents
Based on Table 1, out of 116 respondents, most of the respondents were from the financial and insurance sectors (27.59%), and 26.72% of respondents were from the information and communication technology (ICT) sector. Moreover, the results showed that most companies had already been established for 10 to 50 years (52.59%), and the majority of respondents (64.66%) had more than four years of work experience. This indicates that most of the respondents already had sufficient knowledge about implementing data analytics tools, and this study mainly involved mature organizations.
Table 1 Profile of respondents.
| Characteristic | Samples (N = 116) | Proportion (%) |
|---|---|---|
| Sector of industry | ||
| Agriculture | 2 | 1.72% |
| Mining | 6 | 5.17% |
| Manufacture | 14 | 12.07% |
| Energy (electricity, gas, and water) | 4 | 3.45% |
| Construction | 1 | 0.86% |
| Trade, restaurants and hospitality | 7 | 6.03% |
| Transportation and warehousing | 5 | 4.31% |
| Information and communication technology (ICT) and | 31 | |
| telecommunication Finance and insurance Community, social, | 32 | 26.72% 27.59% |
| and personal services | 4 | 3.45% |
| Consumer goods | 5 | 4.31% |
| Characteristic | Samples (N = 116) | Proportion (%) |
|---|---|---|
| Pharmacy | 2 | 1.72% |
| Other | 3 | 2.59% |
| Size of company | ||
| 20 - 99 | 13 | 11.2% |
| 100 or more | 103 | 88.8% |
| Age of company | ||
| 1 - 4 years | 12 | 10.34% |
| 5 - 9 years | 20 | 17.24% |
| 10 - 50 years | 61 | 52.59% |
| >50 years | 23 | 19.83% |
| Respondent's position | ||
| Chairman/ President/CEO | 2 | 1.72% |
| Vice President | 11 | 9.48% |
| Director | 5 | 4.32% |
| Senior Manager | 35 | 30.17% |
| Junior Manager | 63 | 54.31% |
| Total data analytics experience | ||
| 1 - 2 years | 28 | 24.13% |
| 3 years | 13 | 11.21% |
| >4 years | 75 | 64.66% |
4.2 Measurement Model Evaluation
Measurement model evaluation evaluates each measurement item's accuracy, convergent validity, and discriminant validity testing [69]. The measurement model should show an AVE value higher than 0.5 [69] and an outer loading value higher than 0.6 [70] to be considered valid. Furthermore, the measure can be determined as reliable if the value of Cronbach's alpha (CA) exceeds 0.6 [69,71] and the value of the composite reliability (CR) exceeds 0.7 [72]. Based on Table 2, the measurement items could be considered reliable and valid since the CA, CR and AVE values already met a threshold of 0.6, 0.7, and 0.5, respectively. All the outer loadings of the first-order indicators in Appendix B show values above 0.6, which means that all indicators were also valid. Table 3 shows that all loading factors and outer weights of all second-order and third-order measures also displayed moderate loadings, indicating acceptable convergent validity. Discriminant validity was assessed by measuring the cross-loadings, Fornell-Larcker value, and HTMT ratio. Since the cross-loading value indicates a higher value of constructs and indicators than the correlation with indicators from other constructs [72], the model in this research can be considered valid. The discriminant validity criteria for the Fornell-Larcker value in this research was also satisfied, as the square root value of AVE for each latent variable exceeded the correlation between other variables. Moreover, the HTMT value in the results was also below the suggested threshold value of 0.90, as proposed by Henseler, et al. in [73]. Therefore, the results of discriminant validity for the first-order reflective construct in Appendix B and Appendix C could be considered valid.
Table 2 Measurement model evaluation.
| Level | Construct | Indicator | Item | CA | CR | AVE |
|---|---|---|---|---|---|---|
| Data Access (ACC) | 3 | 0.625 | 0.798 | 0.571 | ||
| Data | Data Security and Privacy (DSP) | 3 | 0.847 | 0.908 | 0.767 | |
| Governance | Data Management (DMAN) | 3 | 0.799 | 0.882 | 0.714 | |
| (DG) | Data Quality (QUAL) | 7 | 0.909 | 0.928 | 0.647 | |
| Meta-data management (META) | 3 | 0.869 | 0.920 | 0.795 | ||
| Analytical Skills (ALT) | 3 | 0.923 | 0.950 | 0.867 | ||
| Skills (S) | Communication Skills (COM) | 3 | 0.890 | 0.932 | 0.820 | |
| E: 4 | Data Science Skills (SCI) | 8 | 0.927 | 0.940 | 0.662 | |
| First Order | IT Infrastructure and Capability (INF) | 3 | 0.925 | 0.950 | 0.881 | |
| Technology (T) | Data Analytics Tools Sophistication (TS) | 6 | 0.893 | 0.919 | 0.654 | |
| Data Warehouse and Business Intelligence Technology (DW) | 4 | 0.833 | 0.882 | 0.600 | ||
| Exp | loitative Innovation (EXPL) | 6 | 0.927 | 0.943 | 0.732 | |
| Exp | lorative Innovation (EXPR) | 6 | 0.914 | 0.933 | 0.701 | |
| Cross | s-functional Integration (CFI) | 3 | 0.890 | 0.931 | 0.819 | |
| Data | Data Governance (DG) | 5 | 0.861 | 0.931 | 0.819 | |
| Second Order | Management Capabilities | Skills (S) | 3 | 0.828 | 0.897 | 0.745 |
| Order | (DMC) | Technology (T) | 3 | 0.846 | 0.907 | 0.765 |
| Third Order | Dat | a Management Capabilities (DMC) | 3 | 0.910 | 0.933 | 0.737 |
4.3 Structural Model Evaluation
The structural model is measured using several criteria, such as the significance of path coefficient, \(R^2\) value, \(Q^2\) value, and \(f^2\) value [72]. It is necessary to identify collinearity between constructs before assessing the structural model, where the threshold value of VIF should be less than 5 [69]. The VIF value of each construct's indicators is shown in Table 3. A value lower than 5 indicates that there is no multicollinearity between the constructs.
Table 3 VIF value, outer weights, outer loadings, t-values and P-values.
| Construct | Indicators | Outer Weights | VIF | Outer loading | t- values | P- values |
|---|---|---|---|---|---|---|
| Data Access (ACC) | 0.258 | 1.735 | 0.783 | 19.160 | 0.000 | |
| Data Security and Privacy (DSP) | 0.229 | 1.947 | 0.798 | 24.245 | 0.000 | |
| Data Governance (DG) | Data Management (DMAN) | 0.227 | 1.829 | 0.785 | 19.262 | 0.000 |
| Meta-data management (META) | 0.254 | 1.863 | 0.790 | 20.964 | 0.000 | |
| Data Quality (QUAL) | 0.278 | 2.253 | 0.849 | 34.971 | 0.000 |
| _ | _ | |||||||
|---|---|---|---|---|---|---|---|---|
| Construct | Indicators | Outer Weights | VIF | Outer loading | t- values | P- values | ||
| Analytical Skills (ALT) | 0.433 | 2.525 | 0.919 | 75.849 | 0.000 | |||
| Skills (S) | Communication Skills (COM) | 0.353 | 1.760 | 0.821 | 20.617 | 0.000 | ||
| Data Science Skills (SCI) | 0.369 | 1.934 | 0.846 | 23.561 | 0.000 | |||
| IT Infrastructure and Capability (INF) | 0.379 | 2.018 | 0.869 | 35.328 | 0.000 | |||
| Technology (T) | Data Analytics Tools Sophistication (TS) | 0.386 | 2.293 | 0.894 | 40.039 | 0.000 | ||
| Data Warehouse and Business Intelligence Technology (DW) | 0.379 | 1.945 | 0.860 | 32.741 | 0.000 | |||
| Data Management | Data Governance (DG) | 0.379 | 2.937 | 0.921 | 72.104 | 0.000 | ||
| Capabilities | Skills (S) | 0.334 | 3.020 | 0.913 | 45.450 | 0.000 | ||
| (DMC) | Technology (T) | 0.375 | 3.004 | 0.922 | 74.606 | 0.000 | ||
| EXPR 1 | 0.146 | 1.723 | 0.716 | 12.838 | 0.000 | |||
| T. 1 | EXPR 2 | 0.203 | 4.600 | 0.891 | 41.255 | 0.000 | ||
| Explorative | EXPR 3 | 0.192 | 4.579 | 0.868 | 29.880 | 0.000 | ||
| innovation (EXPR) | EXPR 4 | 0.196 | 2.664 | 0.851 | 25.118 | 0.000 | ||
| (EAFK) | EXPR 5 | 0.232 | 3.563 | 0.900 | 41.255 | 0.000 | ||
| EXPR 6 | 0.221 | 2.163 | 0.783 | 29.880 | 0.000 | |||
| EXPL 1 | 0.190 | 4.029 | 0.876 | 28.771 | 0.000 | |||
| E 1 % « | EXPL 2 | 0.200 | 3.832 | 0.867 | 24.619 | 0.000 | ||
| Exploitative innovation | EXPL 3 | 0.195 | 2.738 | 0.848 | 26.930 | 0.000 | ||
| (EXPL) | EXPL 4 | 0.191 | 2.841 | 0.859 | 22.314 | 0.000 | ||
| (EAFL) | EXPL 5 | 0.180 | 2.593 | 0.831 | 22.785 | 0.000 | ||
| EXPL 6 | 0.212 | 2.905 | 0.861 | 27.398 | 0.000 | |||
| Cross-functional | CFI1 | 0.335 | 2.169 | 0.869 | 22.483 | 0.000 | ||
| integration (CFI) | CFI2 | 0.358 | 3.148 | 0.921 | 40.574 | 0.000 | ||
| miegration (CFI) | CFI3 | 0.411 | 2.988 | 0.925 | 51.620 | 0.000 | ||
Table 3 Cont. VIF value, outer weights, outer loadings, t-values and P-values.
The results of \(R^2\) show that the structural model explains 50.7% of the variance for exploitative innovation (\(R^2 = 0.507\)) and 42.7% of the variance for explorative innovation (\(R^2 = 0.427\)). Since all values of \(R^2\) are higher than 0.33, the \(R^2\) values represent a moderate level of predictive power [72]. Predictive relevance (\(Q^2\)) value was measured to assess the predictive power of endogenous variables by applying a blindfolding algorithm in SmartPLS. All values of \(Q^2\) presented in Table 4 were higher than zero, which indicates that the proposed model met predictive relevance. Since the \(Q^2\) values of both endogenous variables were higher than 0.25, both constructs were considered medium values [72] and constructed well enough.
Table 4 Q-Square results.
| Construct | SSO | SSE | Q² (=1-SSE/SSO) |
|---|---|---|---|
| Exploitative Innovation | 696 | 443.250 | 0.363 |
| Explorative Innovation | 696 | 507.015 | 0.272 |
Structural model evaluation also includes the measurement of effect size (f²). According to Hair, et al. [72], effect size quantifies the degree of difference or relationship between variables. Effect size shows a minor influence if the value of f² is higher than 0.02, a value of higher than 0.15 shows a medium influence, and value higher than 0.35 shows a significant influence at the structural level [72]. The F-square results presented in Table 5 indicate that cross-functional integration only has a small effect size in strengthening the influence of data management capabilities on explorative innovation.
\(\mathbf{F}^2\)Construct Influence Data Management Capabilities -> Significant 0.164 Exploitative Innovation Data Management Capabilities > Significant 0.149 Explorative Innovation Moderating effect Cross-functional Not 0.003 significant integration→Exploitative innovation Moderating effect Cross-functional 0.031 Small integration →Explorative innovation
Table 5 F-square results.
4.4 Hypotheses Testing Results
The Bootstrapping technique in SmartPLS was used to test the research hypotheses using a one-way (one-tailed) test and a significance level of 0.05 (5%). Table 6 shows that all hypotheses were accepted except for the moderation effect of cross-functional integration on the relationship between data management capabilities and exploitative innovation. Besides testing the hypotheses, this study also examined the moderation effect of cross-functional integration. The results of the moderating effect showed that cross-functional integration only moderates the relationship between data management capabilities and explorative innovation but showed no significant impact in increasing the effect of data management capabilities on exploitative innovation. Figure 2 shows the results of the moderation effect from SmartPLS.
The rejection of Hypothesis 4 indicates that the moderation effect has an insignificant impact only on exploitative innovation and may also be caused by the age of a company, since this study was dominated by mature companies (age more than tenyears). Mature companies usually engage in exploitative innovation as part of their routine operations by enhancing their production procedures to adapt their current products. Hence, it is possible that exploitative innovation could perform better without a high level of integration in the company.
| Hypothesis | Path | Path coefficient | T value | P value | Sig. | Results |
|---|---|---|---|---|---|---|
| H1 | DMC EXPL | 0.366 | 3.480 | 0.000 | *** | Accepted |
| H2 | DMCEXPR | 0.376 | 3.827 | 0.000 | *** | Accepted |
| H3 | DMC*CFIEXPR | 0.148 | 1.866 | 0.031 | ** | Accepted |
| H4 | DMC*CFI EXPL | 0.045 | 0.555 | 0.289 | n.s. | Rejected |
Table 6 Hypotheses testing results.
Note: n.s. = not significant; ***p < 0.01; **p < 0.050.
With regard to model fit, Henseler, et al. in [73] proposed the standardized root mean square residual (SRMR) to evaluate model fit within the context of the PLS-SEM model. SRMR shows the difference between the observed model correlation and the implied model; an SRMR value below 0.08 is considered a good fit [72]. In this study, the SRMR value was 0.065, lower than the SRMR threshold value. Thus, it can be said that the model in this research met the model fit criteria.
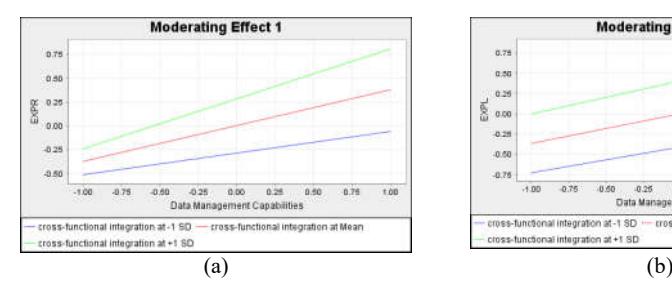
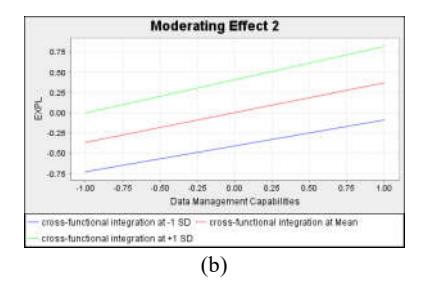
Figure 2 Moderating effect of cross-functional integration on the relationship between data management capabilities and explorative innovation (a), and between data management capabilities and exploitative innovation (b).
5 Discussion
5.1 Theoretical Contributions
First, this study found that data management capabilities directly influence both explorative and exploitative innovation by building three main dimensions: data governance, skills, and technology. The results also align with Shamim, et al. [2], who found a positive link between data management capabilities and both explorative and exploitative innovation. This study also found that data quality had the highest factor loading value, contributing to strong data governance, followed by data security and privacy. The findings align with Otto [30] and Khatri and Brown [29], who pointed out the importance of data quality in good data governance.
Explorative innovation frequently relies on acquiring new opportunities to invent new products and services. To fully access sources of new opportunities, such as market and competitor trends, companies must have access to high-quality data sources that are reliable, secure, accurate, up-to-date, and timely. Explorative innovation also tries to experiment with new products and services in local or existing markets. This study found that the sophistication of data analytics tools had the highest factor loading, contributing to the formation of the technology dimension. By having sophisticated tools that can extract information from unstructured data, such as data from social media, companies can identify patterns and outperform their data analysis process.
From a different perspective, exploitative innovation tends to refine existing products or services by focusing on improving the innovation efficiency process. Employees with a high degree of expertise in data management are also important to support exploitative innovation through an advanced analytical thinking process. Data science skills emerged in this study as the most prominent skills. With sufficient data science skills, employees can perform various data analytics techniques, such as data mining and text mining, through different programming languages. Thus, employees can process complex data sources and present the data analysis results through visualization such as dashboard, graphs, and data mapping, making them easy to understand for top management.
Secondly, the results show that cross-functional integration moderates the relationship between data management capabilities and explorative innovation. This finding reinforces the study from Gomes [74], who found that integration between departments is needed more in the early phase of new product development. De Visser, et al. in [75] demonstrated that companies pursuing radical or explorative innovation may enhance their performance by leveraging cross-functional organizations teams. According to Jugend, et al. in [76], due to the high level of uncertainty and complexity in developing new products, explorative or radical innovation may require larger team members and involve different specializations, hence leading to a greater need for integration. Hence, integrating various functional departments creates a smooth and seamless flow of information across the company, leading to better collaboration and coordination in innovation practices.
The effect size results in Table 5 show that cross-functional integration only has a small effect on explorative innovation which is similar to the hypothesis result in Table 6. This finding indicates that even though cross-functional integration could significantly modify the relationship between data management capabilities and explorative innovation, integration only gives small improvements. This may happen because working with integrated teams' members in explorative projects could decrease the level of complexity in coordination and managing large
volume of data. Thus, integration could lead to better performance in exploitative innovation.
However, this study showed that cross-functional integration has no moderating effects on exploitation innovation. The case study conducted by Jugend, et al. [76] similarly indicated that in the context of incremental or exploitative innovation projects, the need for increased integration may not be imperative because, according to Rubera, et al. [7], the degree of complexity in projects guides the need for greater or lesser integration. The results for effect size show an insignificant effect of the moderating effect of cross-functional integration on exploitative innovation, which is similar to the hypothesis results. The effect size results indicate that the level of integration in the company will not affect the way employees manage their data system, which later also does not affect their exploitative innovation process. This means that in the exploitative innovation process, integration between departments is not necessarily needed to amplify the effectiveness of data management. This is because exploitative innovation that focuses on modifying existing products and services can happen by only involving certain departments, such as operation. Due to less effort needed to integrate activities across different departments, cross-functional integration may not significantly amplify or increase the relationship between data management capabilities and exploitative innovation.
5.2 Managerial Implications
The present study, conducted in Indonesia, has several implications, especially for business practitioners and executives in Indonesian companies. Firstly, in effectively building data management capabilities, managers must pay attention to some important aspects of data governance, such as data quality, security, and privacy. Several guidelines and regulations need to be addressed to build a secure database system and provide protection against personal and company data breaches. Consequently, companies must ensure that only authorized users can access the data warehouse. Additionally, managers, especially in the IT department, may explore big data analytics software and create a data warehouse to store large volumes of data.
Secondly, in terms of the skills aspects, managers also need to pay attention to building employees' capacity and knowledge by providing appropriate training, for example, training related to data science programming, data visualization, or statistics. By constantly upgrading employee's skills related to data science and analytical skills, companies will be able to keep up with the advancement of digital technology to outperform competitors' innovation activities. Consequently, managers should foster a culture of information sharing to make sure that important information is shared, and knowledge transfer happens among
employees across the company. However, different sectors may have different challenges in facing a competitive market. Hence, different focuses on building skills may also exist. For example, high-technology sectorssuch as the ICT sector are characterized by dynamism and require the development of skills which align with the rapid advancement trends in the industry. Hence, the ICT sector could focus on more advanced data science training such as machine learning, natural language programming, and advanced SQL and NoSQL databases. In contrast, non-high technology sectors, such as the mining, energy, agriculture, and construction sectors, only implement basic analytics on a daily basis. Thus, management may focus on basic training in data science, such as data visualization and statistics.
Thirdly, regarding the technology aspect, the sophistication of data analytics tools is important to build data management capabilities. Managers need to invest in appropriate and advanced data analytics tools to support the innovation process. Tools or software that can extract and process unstructured data sources coupled with modeling and simulation programs may be helpful in providing real-time insight for top management, thereby solidifying the decision-making process. Specifically for high-technology sectors such as the ICT sector companies often deal with large volumes of data. Hence, a cloud-based data warehouse and analytics platforms such as Microsoft Azure could help the ICT sector to facilitate rapid decision-making. However, non-high technology sectors may only need basic analytics tools to support data visualization and help recognize patterns. Thus, management could invest in data visualization tools such as Power BI or Tableau to help employees create dashboards with an simple and user-friendly interface that can later help management understand data patterns.
Fourthly, managers need to pay attention to building cross-functional integration by highlighting the aspect of integrating all functional departments in solving problems in innovative tasks. Consequently, managers need to focus on creating a collaborative environment to integrate activities across different departments, which leads to a higher level of cross-functional integration. Managers are also suggested to strengthen their organizational culture, especially aiming at a datadriven culture, to enhance their integration capabilities, resulting in higher performance in innovation capabilities. Once the data-driven culture is fostered, combined with cross-functional integration, it will lead to the creation of effective data management.
5.3 Limitations and Future Directions
This study was only based on data from Indonesian companies. To ensure its generalizability, future studies should use data from other countries. Further, this study used cross-sectional data limited to understanding how each dimension of data management capabilities may influence innovation capabilities. Hence, future studies could use longitudinal data to investigate the mechanism further. Third, this study used medium- and large-size companies. Further studies could focus on specific company sizes to investigate the influence of data management capabilities on innovation capabilities within specific sizes of companies. Besides cross-functional integration, other variables may also play a significant role in exploration and exploitative innovation. Hence, future studies could identify more antecedents of both explorative and exploitative innovation.
6 Conclusion
This study confirmed that data management capabilities have strong direct impacts on both explorative and exploitation innovation. Furthermore, the results demonstrated that cross-functional integration plays an important role in strengthening the effect of data management capabilities on innovation capabilities even though they only showed a significant effect on explorative innovation. This study did not yet confirm the moderating effects of crossfunctional integration on exploitative innovation. Functional departments in companies with a high level of cross-functional integration are highly integrated in serving the needs of target markets. Hence, integration between functional areas may only affect explorative innovation due to the high level of complexity and uncertainty, which increases the need to collaborate and coordinate with specialized labor from different departments. In conclusion, this study confirmed that cross-functional integration plays a crucial role in supporting data management capabilities.
Acknowledgment
The authors would like to express their deepest gratitude to ITB for the research grant under PPMI (Research, Community Service, and Innovation) 2021 Program.