
1 Introduction
Network assaults are common due to how swiftly Internet technologies have been embraced worldwide. Extortion viruses exploit an information network system's weaknesses and security gaps to attack the network and its capabilities and gain accessibility to website data, private user details, and other confidential material. The proliferation of industrial Internet of Things (IoT) devices is prone to revealing privacy and security flaws and tempting criminals to transmit harmful content. For instance, several academics have outlined the most crucial security issues, current threats, and privacy protection strategies for each layer of IoT
devices. Due to the connectivity between communication and power facilities, the smart grid unavoidably suffers from network security issues [1].
The method for detection and mitigation accounts for random uncertainty caused by communication noise at this time. Along with several examples of smart grid attacks, a full description of the underlying network security issues in the architecture of a smart grid is also offered. These enormous network vulnerabilities have a detrimental effect on both public safety and quality of life [2]. Applications that are based on the IoT make use of lightweight communication protocols and have restricted capabilities in both computing and storage, while traditional security methods need a significant amount of powerful computer resources. Because of the varied nature and characteristics of the applications that are based on IoT, this technique cannot be implemented for those applications. As a result of the characteristics of IoT applications, which cannot identify internal threats since they function within a network, it would appear that this method is insufficient to protect them. Due to the exponential growth of IoT risks and vulnerabilities, which have proven ineffectual in avoiding targeted attacks and anomalies, it may be difficult to assess what hazards or attacks the IoT ecosystem is prone to [3].
Machine learning (ML) techniques are used to discover common characteristics of networks. Anomaly-based intrusion detection systems are favored over signature- and specification-based intrusion detection systems because of their capacity to uncover previously unknown dangers. However, this comes at the expense of a high false alarm rate. The quality of the network traffic patterns used for the engine's training is directly impacted by the goodness of the detection engine, also known as the model or classifier. In turn, it determines the effectiveness of anomaly-based intrusion detection systems (IDS). After being taught, the detection engine can accurately recognize newly launched attacks. Intrusion detection in IoT networks involves distinguishing network traffic into normal or attack classifications with the best accuracy and the fewest false alarms possible [4].
In the case of IoT networks, the network's security must be maintained by early identification of attacks to keep the network safe. Help in accomplishing this objective can be provided by network intrusion detection systems (NIDS). These systems monitor network traffic and employ cutting-edge machine-learning algorithms to identify hostile behavior. However, the network in these models must be extensive and comprise several layers following one another. Consequently, these models need significant computing power and a sizeable memory footprint [5].
The major objectives of this work were as follows:
- 1. To improve the intrusion classification performance by performing SVM optimization using the AQ-KGMO-DMG algorithm.
- 2. To reduce the complexity of the detection process, which improves the potential real-time testing.
This paper's remaining sections are organized as follows. Section 2 overviews federated learning and intrusion detection for the Internet of Things. Section 3 describes the recommended intrusion detection method. Section 4 discusses the experimental setting, the performance metrics that were employed, the results of the experiment, and a comparison of this work to rival tactics. Finally, the results and future study objectives are described in Section 5.
2 Literature Survey
Intrusion detection can be carried out in various ways. This section explains a few of the older methods employed to accomplish intrusion detection with minimal latency.
Kan, et al. [6] proposed sensing intrusions into IoT networks based on Convolutional Neural Networks with Adaptive Particle Swarm Optimization (APSO-CNN). To be more specific, the management constraints of a onedimensional CNN were adaptively optimized by the use of the Particle Swarm Optimization (PSO) approach, which incorporates variations in inertia weight. Thus, they created a new assessment approach, one that compares the proposed APSO-CNN algorithm with CNN set parameters. Jingyu, et al. [7] developed an IDS using particle swarm optimization-based gradient descent (PSO-LightGBM). PSO-LightGBM is utilized in this technique to extract the characteristics of the data. Then that information is fed into One-Class SVM (OCSVM) to discover and identify harmful data. To verify the intrusion detection model, the UNSW-NB15 dataset is utilized. The results of the experiments revealed that the model was quite reliable in identifying both normal data and a wide variety of dangerous data, particularly tiny sample data such as backdoors, shellcodes, and worms. Yazan, et al. [8] proposed a new intrusion detection system (DLIDS) based on deep learning that can identify potential security risks in Internet of Things settings. To improve the reliability of the detection process, the proposed module utilizes a combination of two algorithms: the Spider Monkey Optimization method (SMO) and the Stacked-Deep Polynomial Network (SDPN). SMO selects the most useful characteristics from a dataset, while the SDPN determines if the data are typical or out of the ordinary. Saif, et al. [9] proposed a novel strategy for fighting swarms based on the Bird Swarm Algorithm (BSA) and improved the performance of the Gorilla Troops Optimizer (GTO). Because it has a great capacity to locate feasible regions with optimal solutions, BSA was employed in the newly produced GTO-BSA to increase the performance exploitation of GTO. As a direct consequence of this, the standard of the completed product is higher, which contributes to an increase in convergence.
Midi, et al. [10] proposed Kalis as a self-adapting, knowledgeable, and skilled intrusion detection system. On a wide range of IoT devices, it can detect assaults in real time. On IoT devices, Kalis can monitor a wide range of protocols without requiring any modifications to the existing software. It does not impact the performance of the apps installed and supports cooperative security situations. An extensive investigation demonstrated that Kalis can effectively and efficiently identify attacks on Internet of Things devices. Treepop and Mason [11] introduced a Double-Layered Hybrid Approach (DLHA) to improve intrusion detection. They found that R2L and U2R attacks behave similarly to normal users, and used a Naive Bayes classifier for DoS and Probe detection, followed by an SVM for distinguishing R2L and U2R from normal instances. DLHA outperformed existing techniques, achieving a 96.67% detection rate for R2L and 100% for U2R. Jie and Shan [12] developed an intrusion detection framework using SVM with Naive Bayes feature embedding, achieving high accuracy across multiple datasets. Sandeep, et al. [13] used semi-supervised SVM and Random Forest classifiers, combined with a genetic algorithm for feature selection, to classify the NSL-KDD dataset. Their approach showed better performance with GA. Abhishek and Sunil [14] proposed a system using a genetic algorithm, the Discrete Wavelet Transform, and an ANN-SVM hybrid to effectively detect cyber-attacks, showing superior precision, recall, and f-measure compared to existing methods.
The prevailing existing methods face various challenges, including issues like over-fitting and probing. These methods typically rely on training with a singular extensive dataset, necessitating prolonged data collection periods. Moreover, many of these established existing techniques lack support for an automated online learning process, mandating repeated retraining and consuming substantial computational resources. This research presents the development of an SVM employing AQ-KGMO-DMG optimization. This feature extraction technique stands as a robust approach in IDS. The SVM method with AQ-KGMO-DMG optimization is aimed at overcoming these intricate challenges.
3 Proposed Method
Filtering, normalization, and data clustering pre-processing methods were applied to the N/W parameter database. Then arithmetic features and derivative features were extracted from the pre-processed data. All extracted features are then cascaded. KGM optimization and SVM are used for training and classifying the output. Figure 1 shows a block diagram of the proposed method.
3.1 Block Diagram
Figure 1 illustrates the intrusion detection system optimized with an AQ-KGMO-DMG optimized SVM. The system operates in two phases: training and testing with pre-processing, feature extraction, and classification steps in both. In the training phase, data from the network intrusion database is pre-processed through data filtering, normalization, and data clustering. This ensures that the input is clean and uniform. After pre-processing, the data undergoes feature extraction, where arithmetic operations and discrete derivatives are applied to capture key characteristics. These features are passed through a cascade process for refinement and are then used by the SVM for classification. To enhance the SVM's performance, AQ-KGMO-DMG optimization is applied.
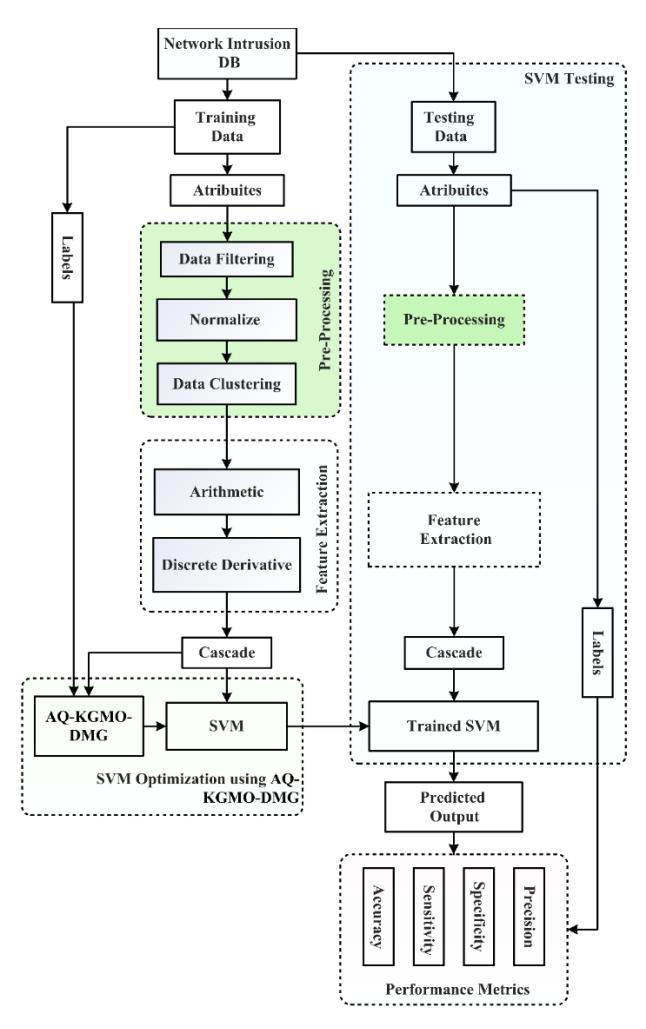
Figure 1 Block diagram of proposed method.
This technique combines KGMO optimization with quantum-inspired algorithms, ensuring the SVM can effectively tune its parameters to handle various network intrusion types. The optimization's dynamic molecular grouping allows the system to adapt to diverse intrusion scenarios. In the testing phase, the testing data undergoes the same pre-processing and feature extraction steps. The extracted features are input into the trained SVM, which now benefits from the optimized parameters. The SVM then predicts whether the traffic is normal or intrusive based on its prior training. Finally, the system's performance was measured using standard metrics, including accuracy, sensitivity, specificity, and precision. These metrics evaluate the system's ability to accurately detect intrusions, minimizing false positives and false negatives. The AQ-KGMO-DMG-enhanced SVM ensures robust and efficient intrusion detection, making it a reliable approach for network security.
3.2 Pre-Processing
The data are scrubbed clean in preparation for pre-processing. In this process, redundant features and features that do not produce a high information gain (IG) are omitted. In their place, derived features or features derived from other characteristics in the data are added.
3.2.1 Filtering
On the client side, filtering or allowing poisoned data may be an option. Given that customers, such as security gateways, have complete control of the training data, one possible option is to implement a poisoned data filtering or tolerating technique. The idea of employing already established poisoning protections for centralized learning, such as noisy data tolerance or outlier data mitigation, can be further investigated [15].
3.2.2 Normalization
This pre-processing kind is important for the classification process because the learning step is sped up by performing normalization on the input data. Some form of data normalization may be required to prevent numerical issues such as loss of accuracy caused by arithmetic overflows. Regarding distance measurement, qualities with larger ranges have a greater impact than attributes with narrower ranges [16], however, this may be seen as a kernel of the preprocessing step. The data are mapped onto an advantageous plane using another kernel approach called normalization, which enables calculations to be performed more easily. A sophisticated normalization procedure significantly increases the time required for processing due to the enormous amount of data. A quick and efficient strategy was chosen [17]. SoftMax Normalization is given this name
because it softly approaches both its maximum and minimum value, but it never quite arrives at either one.
\[\chi' = \frac{1}{1 + e^{-a}} \tag{1}\] where is
\[a = \frac{x_i = x_{mean}}{x_{std}} \tag{2}\]
The practically linear zone of the softmax is assigned to data points within a standard deviation of the mean. The transformation exhibits a smooth nonlinearity at both ends and is roughly linear in the intermediate range. The transformation ensures that no current value falls outside the output range of 0 to 1, which covers the whole output range.
3.2.1 Data Clustering
K-means is a method used in machine learning that does not require human supervision. The foundation of this methodology is identifying groups within the data and a variable may be used to indicate the total number of groups. The Kmeans approach is utilized rather frequently [18] when it comes to the process of determining patterns in time series data. It allows us to categorize the data into several categories and offers a workable approach to automatically determining those categories inside an unlabeled dataset without training [19]. It also allows us to classify the dataset into several categories automatically. Because this is a centroid-based technique, each cluster is provided with its own unique centroid. The primary purpose of this methodology is to cut down on the total distance between each data point and the clusters connected to it [20].
3.2.3 Feature Extraction
Feature extraction using arithmetic features involves applying mathematical operations, such as mean, kurtosis, skewness, and moment, to raw data. This process helps highlight important characteristics or patterns in the data, making it easier for the machine learning model, like the optimized SVM, to detect and classify network intrusions effectively.
3.2.4 Arithmetic Features
Standard Deviation: The amount of difference in the spread of a collection of data in statistics is the standard deviation. Higher standard deviations are distributed across a wider range, whereas smaller standard deviations are typically set as means. The sample standard deviation formula is as follows:
\[s = \sqrt{\frac{1}{N-1} \sum_{i=1}^{N} (x_i - \bar{x})^2}\] (3)
where \(x_i\) are the observed values, \(\bar{x}\) is the mean value, and N is the number of observations.
Mean: The mean of a collection of observed data is determined by summing the numerical values of all the observations and dividing the result by the total number of observations [21]. The arithmetic means of a set of numbers \(x_1\), \(x_2\), ..., \(x_n\) is typically denoted by \(\overline{x}\), where n is the number of items in the sample:
\[\bar{x} = \frac{1}{n} \left( \sum_{i=1}^{n} x_i \right) = \frac{x_1 + x_2 + \dots + x_n}{n}\] (4)
Kurtosis: The kurtosis is a statistic that expresses how tailed a real-valued random variable's probability distribution is. The fourth standardized moment, which is known as the kurtosis, can be described as follows:
Kurtosis[X] = \[E\left[\left(\frac{X-\mu}{\sigma}\right)^4\right] = \frac{E[(X-\mu)^4]}{(E[(X-\mu)^2])^2} = \frac{\mu_4}{\sigma^4}\] (5)
where \(\mu 4\) is the fourth central moment, and \(\sigma\) is the standard deviation.
Skewness: In statistics, the degree to which the probability distribution of a real-valued random variable is asymmetrical concerning its mean is referred to as the variable's skewness [22]. The skewness of a random variable X is the third standardized moment. \(\tilde{\mu}_3\) defined as follows:
\[\tilde{\mu}_3 = E\left[\left(\frac{X-\mu}{\sigma}\right)^3\right] = \frac{\mu_3}{\sigma^3} = \frac{E[(X-\mu)^3]}{(E[(X-\mu)^2])^{3/2}} = \frac{k_3}{k_2^{3/2}}\](6)
where \(\mu\) is the mean, and E is the expectation operator.
Moment: In statistics, if the function represents mass, the entire mass corresponds to the zero-th moment [23].
A real-valued continuous function f(x) of a real variable around a value c can be represented as follows:
\[\mu_n = \int_{-\infty}^{\infty} (x - c)^n f(x) dx \tag{7}\]
3.2.5 Discrete Derivatives (DDs)
DD is based on computing the derivatives at each sample point of the spike waveform:
\[\delta(n) = s(n) - s(n - \delta) \tag{8}\] where s is the point indication, n is the trial point, and the time interruption. Three different values for the interruption: = 1, 3, 7. The strongest DD coefficients are chosen to reduce the dimensionality [24].
3.3 Mathematical Model for Training SVM with AQ-KGMO-DMG
The optimization of key SVM hyperparameters is essential to mathematically model the training of a support vector machine (SVM) using Adaptive Quantuminspired KGMO with Dynamic Molecular Grouping (AQ-KGMO-DMG). These hyperparameters include the regularization parameter C, kernel parameters such as for the RBF kernel, and possibly others. AQ-KGMO-DMG is used to search for the optimal values. The fitness function is based on the SVM's classification accuracy or another performance metric.
Key Hyperparameters to Optimize in SVM
Let's consider the following hyperparameters for SVM:
- 1. C (regularization parameter): controls the balance between maximizing margin and minimizing classification error.
- 2. (kernel parameter for RBF kernel): governs the influence of individual training examples.
- 3. Kernel type: specifies the kernel used in the SVM (e.g., linear, RBF, polynomial).
- 4. Additional kernel parameters include, for example, the degree of the polynomial kernel.
The goal is to find the optimal set of = {, ,kernel type} that minimizes the classification error of the SVM.
Step 1: Initialization
AQ-KGMO-DMG starts by initializing a population of gas molecules, where each molecule represents a candidate solution (i.e., a set of hyperparameters).
Let = { , , kernel type } be the i-th molecule (candidate solution), = {1, 2, … , } represent the entire population of n molecules. The search space for each molecule's hyperparameters is:
∈ [min, max], ∈ [min, max], kernel type ∈ {linear,RBF,polynomial}
Step 2: Quantum-inspired Position Update
Each molecule's position \(\theta_i\) (hyperparameter set) is updated probabilistically using quantum mechanics principles. The molecule's new position is determined by its probability density function (PDF), allowing it to explore different regions of the search space.
The wave function \(\psi(\theta)\), modeled as a Gaussian distribution cantered around the molecule's current position \(\theta_i\), and the PDF are expressed in Eq. (9):
\[P(\theta_i) = |\psi(\theta_i)|^2 = \frac{1}{\sqrt{2\pi\sigma^2}} \exp\left(-\frac{(\theta_i - \mu)^2}{2\sigma^2}\right)\](9)
where \(\mu\) is the molecule's current position, \(\sigma\) controls the spread of the quantum movement (initially large for exploration).
The molecule's new position is sampled from the following distribution:
\[\theta_i^{(t+1)} \sim \mathcal{N}\left(\mu_i^{(t)}, \sigma_i^{(t)}\right) \tag{10}\]
The quantum-inspired tunnelling mechanism helps molecules escape local optima by probabilistically moving them to distant areas of the search space.
Step 3: Fitness Function (SVM Performance Evaluation)
The fitness of each molecule is evaluated by training an SVM using the corresponding hyperparameters and measuring its classification performance (e.g., using cross-validation accuracy). Let \(f(\theta_i)\) represent the fitness function:
\[f(\theta_i) = \frac{1}{k} \sum_{j=1}^k \text{Accuracy}(\text{SVM}(\theta_i), D_j)\] (11)
where k is the number of cross-validation folds, \(D_j\) is the training data for fold j, SVM(\(\theta_i\)) is the SVM trained with hyperparameters \(\theta_i\), and accuracy is the chosen performance metric.
The objective is to minimize classification error (or equivalently, maximize accuracy):
\[\min_{\Omega} (1 - f(\theta)) \tag{12}\]
Step 4: Dynamic Molecular Grouping (DMG)
Molecules are grouped based on their fitness values. Define a fitness threshold T and divide the molecules into two groups:
Exploitation group: Molecules with fitness \(f(\theta) \ge T\) undergo local refinement.
Exploration group: Molecules with fitness \(f(\theta) < T\) explore new regions of the search space.
For the exploitation group, the Gaussian distribution's variance \(\sigma\) is reduced to focus on fine-tuning. For the exploration group, the variance \(\sigma\) is increased to encourage broader exploration:
\[\sigma_i^{(t+1)} = \begin{cases} \sigma_i^{(t)} \cdot \alpha f(\theta) \ge T \\ \sigma_i^{(t)} / \alpha f(\theta) < T \end{cases}\] (13)
where \(\alpha\) is a factor that controls the adjustment of \(\sigma\) (with \(\alpha < 1\)).
Step 5: Adaptive Parameter Control
– Energy-Based Learning Rate: The learning rate \(\eta_i^{(t)}\) for updating a molecule's position is adjusted based on its fitness:
\[\eta_i^{(t+1)} = \eta_i^{(t)} \cdot \left(1 - \frac{f(\theta_i^{(t)})}{f_{\text{best}}}\right) \tag{14}\] where \(f_{\text{best}}\) is the best fitness achieved so far.
– Adaptive Temperature: The temperature \(T_i^{(t)}\), which governs the exploration range, is dynamically adjusted based on the population diversity. If the population converges prematurely, the temperature is increased to promote exploration:
\[T_i^{(t+1)} = T_i^{(t)} \cdot \left(1 + \frac{\text{Diversity}}{N}\right) \tag{15}\] where Diversity is the variance of fitness values in the population and N is the number of molecules.
Step 6: Fitness Memory and Reinforcement Learning
Each molecule maintains a memory of its best fitness values and hyperparameters. The reinforcement learning mechanism updates the molecule's position based on past success:
\[\theta_i^{(t+1)} = \theta_i^{(t)} + \eta_i^{(t)} \cdot \Delta \theta_i^{(t)} \cdot \mathbb{1} \{ f\left(\theta_i^{(t)}\right) > f_{\text{mem}} \}\] (16)
where \(f_{\text{mem}}\) is the best fitness in memory, and \(\mathbb{1}\{\cdot\}\) ensures updates are only made if the current fitness exceeds the stored value.
Step 7: Convergence and Solution
AQ-KGMO-DMG continues iterating until a stopping criterion is met, such as reaching the maximum number of iterations or achieving satisfactory accuracy. The optimal SVM hyperparameters correspond to the molecule with the best fitness:
\[\theta_{\text{opt}} = \arg\max_{\theta} f(\theta) \tag{17}\]
Table 1 Parameter specification of SVM
| Parameter | Method |
|---|---|
| Iteration | 800 |
| Step size | 500 |
| Batch size | 300 |
| Weight decay | 0.00004 |
| Optimizer | ADAM |
| Degree | 3 |
| Kernel | rbf |
4 Results and Discussions
For the performance analysis, a PC was utilized with 64-bit Windows 10 Pro installed, an Intel i7-7700 processor with four cores clocked at 3.60 GHz, and 12 gigabytes of main memory. The simulation model for this experiment was created using the Matlab 2014a program. The datasets were obtained from the UNSW-NB15 and NSL-KDD databases.
4.1 Datasets
Many datasets are at one's disposal to assess network intrusion detection systems. Many academics utilize datasets such as KDDCUP99 and UNSW-NB15 to evaluate the quality of their work because they are among the most extensively used datasets.
4.1.1 KDDCup99
One of the most well-known benchmark datasets for IDS research is called KDDCup99 [25]. The almost 5 million feature vectors that comprise the collection represent a single connection record with 41 attributes, including numeric and category information [26]. Three of these 41 characteristics are categorical and must be pre-processed using label encoding.
4.1.2 UNSW-NB15
The Australian Centre for Cyber Security's (ACCS) Cyber Range Lab has generated the UNSW-NB15 by combining genuine everyday activities with fictitious modern attack behaviors. In addition to regular traffic, it includes nine actual assault scenarios [27]. There are over 2.5 million packets that have been recorded and made public. This data collection is accessible in BroIDS, csv, pcap, and argus formats. In addition to the total traffic, the authors extracted 10% of the data from the whole data set and stored it in csv files. The most recent benchmark data set for the NIDS scenario is this one.
4.2 Performance Metrics
A high accuracy requires high precision and trueness since accuracy, as defined, is a blend of all observational error types. The following is the procedure for calculating accuracy.
\[Accuracy = \frac{TP + TN}{TP + TN + FP + FN} \tag{18}\] where TP = True positive; FP = False positive; TN = True negative; FN = False negative.
The sensitivity (Se) expressed as
\[Sensitivity = \frac{TP}{TP + FN} \tag{19}\]
The specificity can be expressed as
\[Specificity = \frac{TN}{TN + FP} \tag{20}\]
The precision (Pr) is defined as:
\[Precision = \frac{TP}{TP + FP} \tag{21}\]
4.3 Result Analysis
Table 2 shows the accuracy of classified attacks for KDDCup99. For each attack category identified within the KDDCup99 dataset, the table provides accuracy, sensitivity, and specificity measurements. The Normal category showed an accuracy of 97.56%, sensitivity of 98.14%, and specificity of 96.49%. In the DoS category, an accuracy of 98.12% was achieved, with a sensitivity of 97.86% and a specificity of 98.13%. For Probe attacks, an accuracy of 98.74% was attained, with a sensitivity of 97.96% and a specificity of 97.82%. U2R attacks demonstrate an accuracy of 97.16%, a notably high sensitivity of 99.73%, and a specificity of 99.16%. Finally, in the R2L category, an accuracy of 99.46% was reported, along with a sensitivity of 98.89% and a specificity of 96.49%.
| SVM without optimization | SVM with AQ-KGMO-DMG optimization | |||||
|---|---|---|---|---|---|---|
| Attacks | Accuracy | Sensitivity | Specificity | Accuracy | Sensitivity | Specificity |
| Normal | 88.63 | 76.12 | 45.36 | 97.56 | 98.14 | 96.49 |
| DoS | 74.20 | 72.28 | 80.10 | 98.12 | 97.86 | 98.13 |
| Probe | 62.35 | 85.62 | 74.02 | 98.74 | 97.96 | 97.82 |
| U2R | 79.02 | 58.13 | 64.31 | 97.16 | 99.73 | 99.16 |
| R2L | 72.36 | 63.42 | 63.04 | 99.46 | 98.89 | 96.49 |
Table 2 Accuracy for classified attacks for KDDCup99
Table 3 depicts the accuracy of classified attacks for UNSW-NB15. For each categorized attack within the UNSW-NB15 dataset, this table presents the accuracy, sensitivity, and specificity measurements achieved by the classification model. The Fuzzer category obtained an accuracy of 94.52%, a sensitivity of 96.34%, and a specificity of 97.19%. In the Backdoor category, an accuracy of 97.24% was achieved, along with a sensitivity of 97.52% and a specificity of 97.76%. The Analysis category demonstrated an accuracy of 98.31%, a high sensitivity of 99.17%, and a specificity of 98.32%. Similarly, Reconnaissance attacks showed an accuracy of 96.35%, a sensitivity of 98.45%, and an impressive specificity of 99.84%. Exploits achieved an accuracy of 98.85%, with a sensitivity of 99.41% and a specificity of 97.20%. Generic, DoS, shell code, and worms categories also showed varying levels of accuracy, sensitivity, and specificity in their classification.
| Table 3 | Accuracy for classified attacks for UNSW-NB15 |
|---|---|
| Attacks | Accuracy | Sensitivity | Specificity |
|---|---|---|---|
| Fuzzer | 94.52 | 96.34 | 97.19 |
| Backdoor | 97.24 | 97.52 | 97.76 |
| Analysis | 98.31 | 99.17 | 98.32 |
| Reconnaissance | 96.35 | 98.45 | 99.84 |
| Exploits | 98.85 | 99.41 | 97.20 |
| Generic | 98.74 | 94.37 | 92.63 |
| DoS | 93.67 | 97.47 | 98.52 |
| Shellcode | 97.74 | 94.85 | 98.74 |
| Worms | 98.77 | 97.81 | 98.70 |
Table 4 shows the performance of KDDCup99 based on training and testing ratio. For the different combinations of training and testing ratios, the corresponding accuracy, sensitivity, and specificity metrics were recorded. When the trainingtesting split was set at 30-70, the accuracy achieved was 59.79%, with a sensitivity of 54.74% and a specificity of 57.18%. As the training proportion
increased to 40% with a corresponding testing ratio of 60%, the accuracy improved to 61.84%, demonstrating an increase in model performance. Notably, at an equal split of 50% for training and testing, the accuracy notably increased to 69.48%, with a sensitivity of 77.24% and a specificity of 79.45%, suggesting a balanced dataset split facilitated enhanced model learning. Further, with a training ratio of 60% and a testing ratio of 40%, a substantial accuracy of 89.41% was achieved, indicating improved model performance with a higher emphasis on training data. The highest accuracy of 99.5% was attained when 70% of the data was used for training and 30% for testing, demonstrating remarkable model proficiency in this configuration.
Table 4 Performance of KDDCup99 based on training and testing ratio
| Training | Testing | Accuracy | Sensitivity | Specificity |
|---|---|---|---|---|
| 30 | 70 | 59.79 | 54.74 | 57.18 |
| 40 | 60 | 61.84 | 67.54 | 73.15 |
| 50 | 50 | 69.48 | 77.24 | 79.45 |
| 60 | 40 | 89.41 | 81.63 | 87.31 |
| 70 | 30 | 99.5 | 99.45 | 99.42 |
Table 5 shows the performance of UNSW-NB15 based on the training and testing ratio. At a training-testing split of 30-70, the accuracy observed was 54.35%, with a sensitivity of 53.74% and a specificity of 56.89%. As the proportion of training data increased to 40% with a corresponding 60% testing ratio, the accuracy notably improved to 59.49%, demonstrating enhanced model performance. Equally balanced splits of 50% for training and testing resulted in a significantly higher accuracy of 87.36%, with a sensitivity of 76.89% and a specificity of 78.97%, indicating the effectiveness of a balanced dataset distribution in model learning. When the training ratio was increased to 60% with a testing ratio of 40%, a notable accuracy of 93.46% was achieved, showing substantial improvement in model performance with a larger emphasis on training data. The highest accuracy of 99.37% was obtained when 70% of the data was allocated for training and 30% for testing, showcasing exceptional model proficiency in this particular split configuration.
Table 5 Performance of UNSW-NB15 based on training and testing ratio
| Testing | Accuracy | Sensitivity | Specificity |
|---|---|---|---|
| 70 | 54.35 | 53.74 | 56.89 |
| 60 | 59.49 | 63.47 | 64.79 |
| 50 | 87.36 | 76.89 | 78.97 |
| 40 | 93.46 | 82.18 | 82.61 |
| 30 | 99.37 | 98.36 | 99.17 |
Table 6 shows the comparative performance of existing work. The CNN [5] method achieved an accuracy of 98.84% and a precision of 97.84%. However, specific sensitivity and specificity values were not provided for this model. FedACNN [22] method attained an accuracy of 98.73% with a precision of 94.67%. Similar to the CNN model, detailed sensitivity and specificity values were not specified. LSTM [23] method obtained an accuracy of 98.87% and a specificity of 98.26%. However, the sensitivity value is not explicitly stated. This work demonstrated a notably higher accuracy of 99.5% compared to the other methods listed.
| Table 6 | Comparative performance of existing work |
|---|
| Methods | Accuracy | Sensitivity | Specificity | Precision |
|---|---|---|---|---|
| CNN [5] | 98.84 | - | - | 97.84 |
| FedACNN [22] | 98.73 | - | - | 94.67 |
| LSTM [23] | 98.87 | 98.26 | ||
| AQ-KGMO-DMG | 99.5 | 99.45 | 99.42 | 99.56 |
The diagram in Figure 2 illustrates the performance of an AQ-KGMO-DMGoptimized IDS across different network attacks from the UNSW-NB15 dataset, evaluated by accuracy, sensitivity, and specificity. Accuracy (green) reflects the system's ability to correctly identify both normal and intrusive traffic. Sensitivity (blue) measures its capacity to detect actual attacks, and specificity (yellow) shows how well it minimized false positives. The IDS demonstrated high accuracy for most attack types, especially Analysis and Exploits, while some variability was observed for Generic and DoS, indicating areas for further refinement.
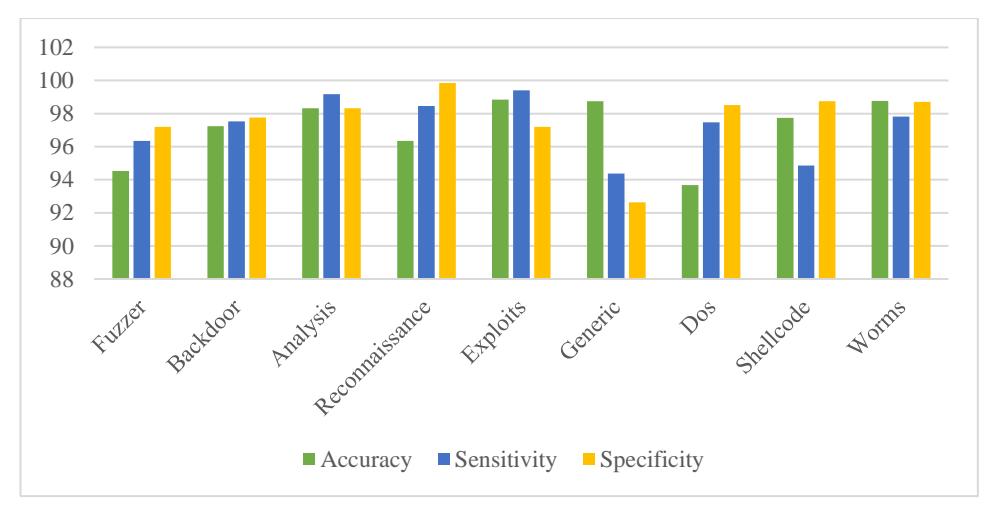
Figure 2 Performance of attacks for UNSW-NB15.
The diagram in Figure 3 showcases the performance of an IDS optimized using the AQ-KGMO-DMG technique on the KDDCup99 dataset, evaluated by accuracy, sensitivity, and specificity.
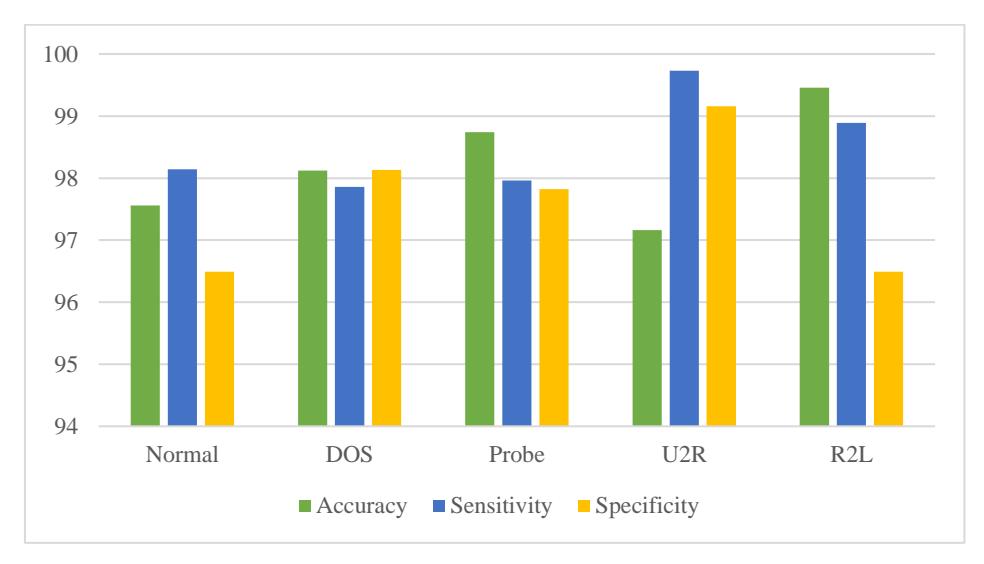
Figure 3 Performance attacks for KDDCup99.
The system undergoes pre-processing, feature extraction, and SVM classification phases, with optimization improving the SVM's performance. For each attack type (Normal, DoS, Probe, U2R, R2L), the optimized system showed significantly higher metrics compared to the unoptimized SVM. U2R and R2L attacks, which were previously hard to detect, now exhibited much-improved sensitivity and specificity due to the AQ-KGMO-DMG optimization.
The confusion matrix in Figure 4 illustrates the performance of the AQ-KGMO-DMG-optimized SVM on the UNSW-NB15 dataset, displaying the actual vs predicted classifications for various network attacks. Each cell shows the number of correct or misclassified instances. High values along the diagonal represent correct predictions, such as Fuzzer (10610) and Shellcode (10451), while offdiagonal values indicate misclassifications, like some Fuzzer attacks being classified as Backdoor or Generic. This matrix demonstrates the system's ability to accurately detect most attack types, with only minor misclassifications, signifying robust performance.
Figure 5 illustrates the confusion matrix for the KDDCup99 dataset, showcasing the performance of the IDS optimized with AQ-KGMO-DMG SVM. The matrix compares actual vs predicted classes, with Normal, DoS, Probe, R2L, and U2R categories. High values along the diagonal represent accurate classifications, such as for Normal and DoS, while off-diagonal values indicate misclassifications, which are minimal. This demonstrates the effectiveness of the AQ-KGMO-DMG optimization in enhancing the SVM's ability to classify network traffic accurately, minimizing detection errors.
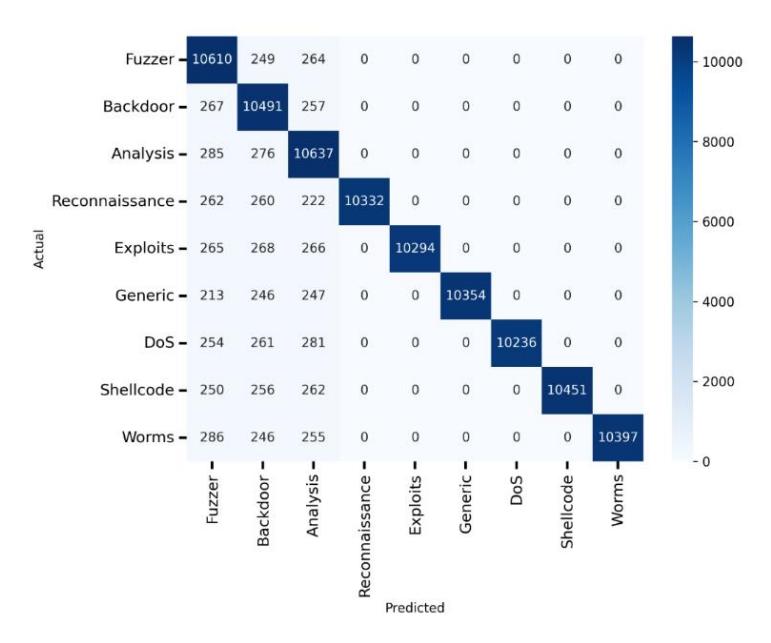
Figure 4 Confusion matrix of UNSW-NB15 dataset.
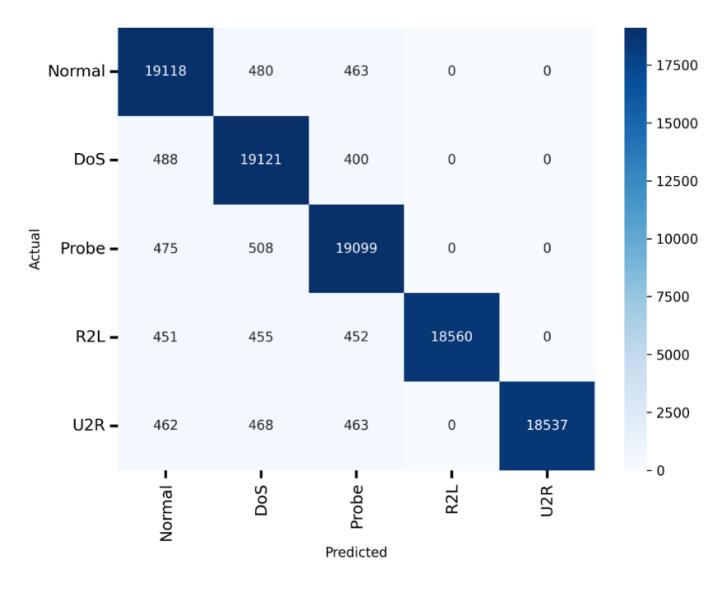
Figure 5 Confusion matrix of KDDCup99 dataset.
5 Conclusions
This study proposed an intrusion detection system specifically designed for the IoT domain using AQ-KGMO-DMG optimization techniques. IDS operates by performing several critical processes, such as filtering, normalization, and data clustering on the dataset's inherent properties during the initial data preparation phase. These steps help in refining and structuring the data for further analysis. Once the features are extracted, they are fed into an SVM during the training phase. This enables the IDS to effectively learn the distinction between normal and abnormal data patterns, ensuring accurate classification during real-time detection. The model's capacity to separate regular from anomalous behavior is critical in safeguarding IoT networks, which are particularly vulnerable to sophisticated cyber threats. The training and testing procedures for the IDS were conducted using the authentic UNSW-NB15 datasets, with the training set employed for learning the data patterns and the test set used to evaluate the performance. Additionally, the sampled data from these sets served as the experimental benchmark for validating the system's effectiveness.
The performance of the proposed IDS was exceptional, achieving an accuracy rate of 99.50%, a sensitivity of 99.45%, a specificity of 99.42%, and a precision of 99.50%. These metrics are vital in determining the system's ability to correctly identify true positives while minimizing false positives and ensuring the model's precision in detection. These results collectively emphasize the robustness and efficiency of the proposed intrusion detection model, highlighting its ability to precisely and reliably detect anomalies in IoT networks, making it a strong contender for enhancing security within the IoT ecosystem.