
1 Introduction
The radio spectrum is a limited natural resource, similar to water, soil, or minerals. Therefore, its utilization must be regulated for optimal performance. However, the radio spectrum cannot be stored, so if it is not used it goes to waste. Proper use of the radio spectrum can provide significant economic benefits to the community. Regulators must ensure that the use of the radio spectrum has a positive impact on the community. In some countries, regulations are in place to revoke the radio spectrum license of holders who do not exercise their rights. This is done to increase the utilization of the radio spectrum [1]. The radio spectrum
can be used for various services that utilize wireless communication media, such as mobile communications, satellites, radio and television broadcasting, radio location, and navigation [2].
The development of telecommunications has greatly contributed to connecting people, increasing access to information and global markets, enabling efficient coordination, and creating business opportunities, such as the IT-enabled service industry, including mHealth [3]-[7]. Telecommunication also contributes to the economic growth of a country [8][9]. Mobile communications can help reduce the digital divide due to their wider coverage and lower investment costs compared to fixed telephone networks.
The latest technology in mobile communication is 5G, a wireless technology currently being implemented in various countries, such as the US, Canada, UK, Spain, Germany, Russia, China, South Korea, Japan, Singapore, Indonesia, etc. [10-12]. 5G includes three distinct usage scenarios that differentiate it from previous generations of mobile communication. The first is eMBB (enhanced mobile broadband), which offers significantly higher speeds than 4G mobile communication. The second is URLLC (ultra-reliable and low latency communications), which supports mission-critical use cases in various fields and applications. The third is mMTC (massive machine-type communications), which is widely used for the Internet of Things (IoT) [13-15]. 5G mobile communication enables a broad range of innovative services to transform all sectors of the economy and human social life [1][13][16][17]. 5G uses a combination of low-band, mid-band, and high-band spectra, with varying characteristics in terms of coverage, latency, and bandwidth adjusted to the needs of each usage scenario. 5G mobile communication utilizes a spectrum that has been partially used for mobile communications from the previous generation, radio television broadcasting, satellites, as well as radio location and navigation.
This study aimed to optimize radio spectrum utilization for 5G mobile communication services. Several preliminary studies have been conducted using various approaches to optimize the 5G spectrum [18][19]. Gourdache et al. [20] proposed a method to integrate the idle spectrum resources of different wireless network with a generic and cooperative spectrum-harvesting scheme. Lagunas et al. [21] proposed a method of using radio spectra simultaneously between cellular and satellite 5G services in the C-Band. Ahmad et al. [22] researched dynamic spectrum sharing using cognitive radio networks. Agiwal et al. [23] studied the spectrum sharing of 4G and 5G mobile communication. Jeon et al. [24] reported a coordinated shared spectrum framework to improve radio spectrum utilization. These studies all optimized radio spectrum management using a sharing approach [20]-[24]. Meanwhile, Rony et al. [25] studied dynamic spectrum allocation using machine learning-based traffic predictions in 5G.
While previous studies focused on optimization-based and AI-driven approaches to spectrum sharing and allocation, this study addressed the temporal dynamics of spectrum migration using a system dynamics model. Unlike other methods, which often provide static or data-driven solutions, this research modeled the phased migration process and its systemic impacts, offering a predictive framework tailored to Indonesia's regulatory and geographic context. This study proposes a standardized strategy for allocating the 5G spectrum gradually, ensuring that previously used services adjust to its evolution. The case study was conducted in Indonesia, a country that does not yet have a 5G mobile communications roadmap. Late adopters of standard technology should consider implementation in other countries and make modifications according to their specific conditions [26]. The application of 5G mobile communications should also pay attention to the experiences of other countries that have implemented it before and adapt it to Indonesia's conditions.
Indonesia has 17,000 islands scattered over an east-west distance of about 5,000 km [27]. Indonesia's geographical conditions cause the need for wireless communication and broadcasting by utilizing a radio spectrum that is higher than in other countries. Allocation of low frequency bands of the radio spectrum for 5G is being carried out in stages for broadcasting from analog to digital. This study suggests a predictive model using the system dynamics methodology for allocating the 5G spectrum. This methodology is appropriate because it considers various variables needed to determine the impact of policy in the future. The model is expected to assist the government in making decisions regarding the 5G spectrum allocation stages. Therefore, this research can be part of the decision support system (DSS), because it produces models used in decision making [28].
2 Literature Review
Decision making is a crucial aspect of human cognition and organizational management. It involves selecting the best course of action from a set of alternatives while facing uncertainty. In complex and dynamic environments, decision makers often face challenges in evaluating the potential outcomes of their choices due to the inherent complexity, uncertainty, and interconnectedness of various factors [29]. Modeling and simulation techniques have become valuable tools for supporting decision-making processes. They provide decision makers with the ability to explore different scenarios, assess the potential impacts of their decisions, and identify optimal strategies [30].
Modeling involves simplifying real-world phenomena into representations, while simulation executes these models to mimic the behavior of the system being studied [31]. Developing and simulating computational models of complex systems can provide decision makers with valuable insight into the underlying
dynamics, relationships, and causal mechanisms governing the system [29]. Modeling and simulation can forecast future scenarios under several different conditions. By incorporating stochastic elements and uncertainty into the models, decision makers can generate probabilistic forecasts of future outcomes and assess the associated risks.
System dynamics is a methodology for understanding the structure and dynamics of complex systems based on feedback and can handle non-linearity, delay, and multi-loop structures of complex and dynamic systems [29],[32],[33]. Furthermore, it can be used to simulate the endogenous and exogenous variables that affect the phenomenon over a certain period.
Unlike optimization [20]-[24] or machine learning-based [25] approaches, system dynamics offers a structured way to model feedback loops and delays that are essential to understanding phased spectrum migration over time. It allows regulators to simulate how technical, economic, and policy-related factors evolve, which is particularly valuable in contexts like Indonesia, where 5G implementation is currently still unfolding.
System dynamics has also been widely used for engineered and social systems in numerous applied and fundamental studies [32],[34]. System dynamics has been utilized in a variety of fields. For instance, it has been used to analyze the sustainability of water resources [35], plans for energy production from municipal solid waste [28], analysis of urban sprawl, and determining the effects of carbon emissions in urban areas [36], smart groundwater governance [37], container management in ports [38], policy in regional technology innovation [39], sustainable development of port economies [40], capacity investment, and risk measurement for wind power units [41]. The system dynamics stages carried out in this research are in accordance with those from [29],[42],[43], as follows:
- 1. Problem formulation. In this stage, the problem to be modeled is defined using system dynamics, identifying relevant stakeholders and their motives related to the problem to be modeled. It also collects quantitative and qualitative historical data to be used as a reference when making the model. The boundaries of the model, such as endogenous, exogenous, and ignored limits, are determined in this stage.
- 2. CLD (causal loop diagram). This stage contains the creation of a CLD to determine the causal relationship between various important factors connected to the problem being modeled.
- 3. SFD (stock flow diagram). The formulation of the SFD model consists of the creation of an SFD using quantitative data for the simulations to be conducted.
- 4. Model validation. This stage consists of validation of the resulting model by conducting structural and behavioral tests to examine whether the resulting model matches the real system.
- 5. Policy simulation. This stage consists of a policy simulation using the previously generated SFD model as a reference for policy making.
3 Methodology
This section provides a comprehensive explanation of how the 5G spectrum management problem in Indonesia was modeled in this study using the system dynamics approach. The objective was to present a step-by-step methodology that captures the complexities and interdependencies involved in managing the 5G spectrum. Both theoretical and practical considerations were addressed, emphasizing the importance of reliable modeling techniques for effective policy analysis. By using Indonesia as a case study, this research offers insight into the specific challenges and contextual factors that influence 5G spectrum management in a geographically and demographically diverse country. The goal is to provide valuable recommendations and decision support tools for policymakers, researchers, and industry stakeholders.
3.1 Problem Formulation
Indonesia currently has several regulations governing telecommunications. An example is the regulation on frequency allocation, implemented in 2018, although it failed to discuss the process for 5G. Telecommunications regulations in Indonesia are in accordance with the standards issued by the 3GPP (3rd Generation Partnership Project) and ITU (International Telecommunication Union). The radio spectrum follows this standard to avoid interference that can propagate in all directions due to the unavailability of regional boundaries. Furthermore, the Indonesian government has also identified a radio spectrum management plan related to 5G, as shown in Error! Reference source not found..
| Radio Spectrum | Existing Services | Notes |
|---|---|---|
| Low-band | Radio and television | Very wide area coverage |
| (≤ 2 GHz) | broadcasting | Suitable for use in rural areas |
| Mid-band | Satellites, previous generation | Suitable for smartphones to replace |
| (2 - 6 GHz) | mobile broadband | 4G technology |
| High-band (≥ 6 GHz) | Satellites | Very high data rate but short range Suitable for use by IoT devices |
Tabel 1 5G Spectrum Allocation
After identifying the problem, the next step was to determine the limits of the system dynamics model. This was obtained through the selection of model limits based on variables whose sizes are determined outside and inside the model. The determination of these variables was based on the main issues that needed to be considered by policymakers when formulating strategies to encourage investment in 5G networks [44] and several other related variables [45],[46]. The limits of the 5G spectrum management model in Indonesia are as follows:
- 1. Endogenous: customer, business revenue, business profit, business competition, quality of 5G services, spectrum pricing, and low-band 5G.
- 2. Exogenous: broadcast services, spectrum sharing, and infrastructure sharing.
- 3. Ignored: wireless backhaul, access/sharing of passive infrastructure, investment case, access costs, 700 Mhz spectrum, 4G network strategy, spectrum roadmap, fiber investment incentives, fiber tax, copper migration to fiber, asset database, wayleave (rights of way) agreements, 5G testbeds, spectrum harmonization, mid-band 5G, and high-band 5G.
It is imperative for regulators to exercise caution when utilizing low-band frequencies for 5G deployment, as these frequencies are currently being allocated for other services. It is imperative that the migration process be executed in a gradual manner, thereby ensuring that the interests of the public are not compromised. Mid-band and high-band 5G technologies were excluded because of the regulator being capable of utilizing the spectrum without the necessity of replacing other services.
An endogenous variable is a variable that is determined within the model and is influenced by other variables within the model. Typically, endogenous variables are the focus of analysis or interest. On the other hand, an exogenous variable is outside of the model and is considered to have an independent effect on the endogenous variables. Exogenous variables are frequently utilized as explanatory variables in a model to clarify variations in the endogenous variables. Ignored variables are related to the model but are disregarded because their influence is not significant to the system.
3.2 Causal Loop Diagram
The next step after identifying the problem and determining the model limits is making a CLD (causal loop diagram). This model is used to describe causal relationships between related variables and form a loop pattern as shown in Error! Reference source not found.. The endogenous variables are represented in black text, while the exogenous variables are represented in green text.
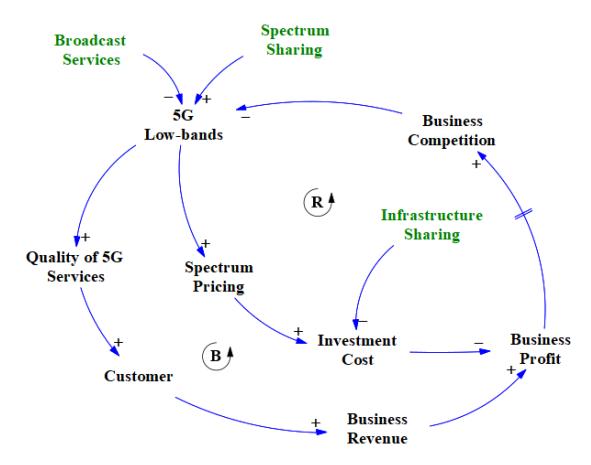
Figure 1 5G spectrum management CLD.
Error! Reference source not found. shows that the CLD generated in the case of 5G radio spectrum management consists of two kinds of loops, namely balancing and reinforcing loops. The description of all variables in Error! Reference source not found. is presented in Error! Reference source not found..
Tabel 2 5G Spectrum Management CLD's Variable Description
| Variable | Description | ||
|---|---|---|---|
| The radio spectrum is allocated for radio and television broadcasting | |||
| Broadcast Services | services. | ||
| Spectrum Sharing | Joint utilization of the radio spectrum to increase its optimization. This spectrum sharing can be in the form of using several 5G service provider operators or utilizing it along with other services, such as broadcast services, radio location, radio navigation, etc. | ||
| Infrastructure Utilization of the same infrastructure by more than one operator | |||
| Sharing | provides 5G services to reduce investment costs. | ||
| Low-band 5G | Radio spectrum with a frequency of ≤ 2 GHz is used for 5G services. | ||
| Quality of 5G Services | 5G network service quality. | ||
| Customers | The average number of consumers using the 5G service providers in a given year. | ||
| Business Revenue | Average annual revenue of the 5G service providers. | ||
| Business Profit | 5G service provider company's average annual profit. | ||
| Business Competition | The number of companies that are providers of 5G services. | ||
| The price that the 5G service provider company must pay to the Spectrum Pricing government to get the radio spectrum allocation. | |||
| Investment Costs | The initial investment required for a company to become a 5G service operator. This investment cost was assumed to be the same value for all service operators to simplify the case study and focus more on the relationship between service quality, business factors, and radio | ||
| Variable | Description |
|---|---|
| spectrum management. Investment cost in this case study focused on | |
| analyzing the increase in spectrum pricing. |
The balancing loop in system dynamics shows the relationship between related variables to form a goal-seeking pattern. This is explained more fully in Error! Reference source not found.. Meanwhile, the reinforcing loop is the relationship between related variables that form a pattern of growth or decline, as shown in Error! Reference source not found..
Error! Reference source not found. shows that the addition of low-band allocation for 5G improves the quality of 5G services. However, because the radio spectrum is a limited resource, 5G low-band is a spectrum that broadcast services also utilize. Thus, its addition will lead to a decrease in allocation for broadcast services. One of the solutions to increasing the optimization and utilization of the radio spectrum is by implementing spectrum sharing. Several studies have been conducted on the usage of 5G services [21]-[24]. Increasing the quality of 5G services will have an impact on raising the number of customers, which also has an impact on increasing business revenue. An increase in business revenue will lead to a rise in business profit without affecting the value of investment cost. This will indirectly cause more parties to become 5G service providers, leading to a rise in business competition. Therefore, the allocation of 5G low-band will be reduced, because more providers need radio spectrum allocation.
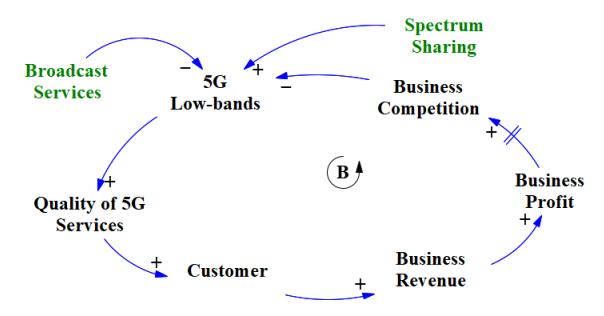
Figure 2 5G spectrum management balancing loop.
Error! Reference source not found. shows that the addition of 5G low-band allocation leads to an increase in spectrum pricing and investment costs. However, investment costs can be reduced assuming infrastructure sharing is carried out between the 5G service providers. An increase in investment cost will decrease business profit and indirectly reduce business competition. The decline in business competition will cause the allocation of 5G low-band to increase, thereby forming a reinforcing loop due to the continuous decline in the number of companies that are operators of 5G service providers. The inability of the government to intervene in this mechanism will only leave one 5G service provider operator to survive in the business competition.
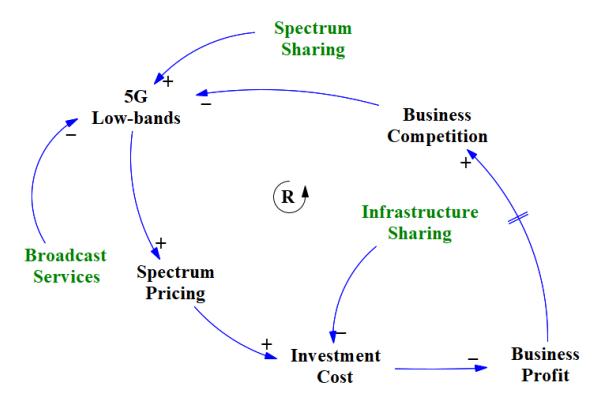
Figure 3 5G spectrum management reinforcing loop.
The CLD model does not need to be used for making SFDs continuously, because simulation is not important. Error! Reference source not found. shows the behavior of the reinforcing loops that are responsible for the continuous decline of business competition in the cellular industry in Indonesia. Therefore, the government needs to intervene to prevent monopolies by implementing regulations for spectrum pricing in the 5G service provider industry.
3.3 Stock Flow Diagram
The next stage of making a CLD is creating an SFD (stock flow diagram), an advanced process used to confirm the relevance of the structure modeled to realworld behavior. It examines the relationships between the variables, while the SFD predicts future behavior to eliminate logical inconsistencies. The process of making an SFD is generally carried out iteratively, hence, the resulting model is more realistic and robust [29]. In this study, the SFD model is a continuation of Error! Reference source not found., as shown in Error! Reference source not found..
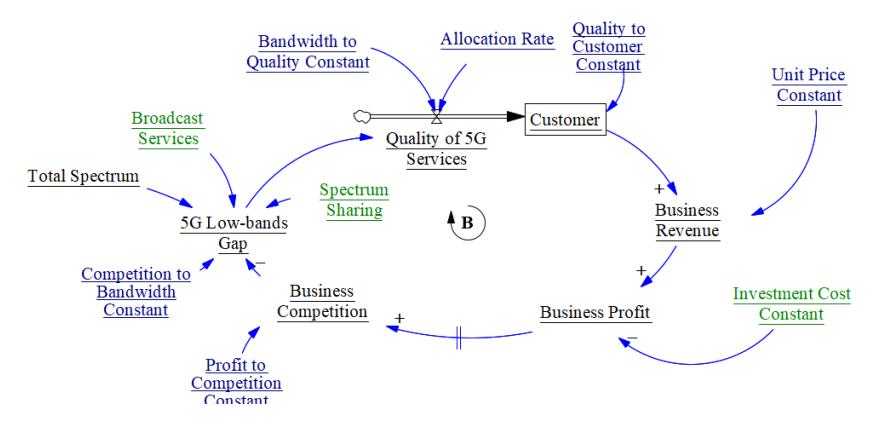
Figure 4 5G spectrum management SFD.
Error! Reference source not found. is an SFD model of the balancing loop shown in Error! Reference source not found., with both containing the same variables. In addition, there are also five constants and an allocation rate, whose values can be changed during the simulation. Error! Reference source not found. shows that Quality of 5G Services is a flow and Customers is a stock accumulated as the variable Quality increases. The equations of the model shown in Error! Reference source not found. were as follows:
Customers(t) = \[\int_{t_0}^{t} (Quality \text{ of 5G Services (s)})\] \[t_0 = x \quad Quality \text{ to Customers Constant x ds}) + Customers(t_0)\] (1)
Quality of 5G Services = 5G Lowband Gap x Bandwidth to
Quality Constant x Allocation Rate (2)
Business Revenue = Customers x Unit Price Constant (3)
Business Profit = Business Revenue – Investment Costs (4)
Business Competition = Business Profit ÷ Profit to Competition Constant (5)
5G Lowband Gap = Total Spectrum – (Competition to Bandwidth Constant x
The model begins with the variable Customers(t), representing the accumulated number of consumers of a 5G service provider at a given time t, measured in thousands of persons. Initially, Customers(to) is set to zero, reflecting the absence of users before the 5G service becomes available. The Quality of 5G Services(s) denotes the rate of increase in customers at time s, influenced by the enhancement of the service quality. This variable is measured in megabits per second per year (Mbps/year). The relationship between service quality and the number of customers is captured by the Quality to Customers Constant, which has a value of 68 persons/Mbps.
The model also incorporates several variables related to spectrum management. The variable 5G Low-band Gap represents the difference in bandwidth available for future service expansion, measured in megahertz (MHz). The Bandwidth to Quality Constant, valued at 14 Mbps/MHz, links the amount of allocated bandwidth to the resulting service quality. The variable Allocation Rate defines the annual increase in bandwidth allocated for 5G services, tested under three simulation scenarios—0.03, 0.06, and 0.10 per year—representing low, medium, and high allocation rates, respectively. The total available bandwidth for 5G services was assumed to be 60 MHz, reflecting the capacity of the low-frequency spectrum below 2 GHz. Furthermore, the variable Competition to Bandwidth Constant, valued at 30 MHz per business, expresses the relationship between market competition and bandwidth allocation, while Spectrum Sharing and Broadcast Services were both set to zero, as current Indonesian regulations have yet to enable spectrum sharing and much of the low-band spectrum remains occupied by broadcast services.
The economic component of the model describes the financial performance of the 5G service providers. The variable Business Revenue represents the annual income of providers, measured in billions of Indonesian Rupiah (IDR). This revenue is influenced by the Unit Price Constant, valued at 6 million IDR per person, which corresponds to the average revenue per user (ARPU) in Indonesia. Business Profit denotes the annual profit of the service providers, also measured in billions of IDR, and is affected by the Investment Cost Constant of 3,500 billion IDR, which represents the estimated spectrum license fee for 5G operators in Indonesia. The variable Business Competition captures the number of active 5G service providers in the market, with its relationship to profitability represented by the Profit to Competition Constant, valued at 5,000 billion IDR per business.
These variables interact through a system dynamics framework composed of stock and flow structures that capture the causal relationships influencing 5G service adoption and spectrum management. Customers(t) serves as the primary stock variable, accumulating over time as new customers subscribe to 5G services. The Quality of 5G Services(s) acts as a major inflow, driven by improvements in bandwidth allocation and service quality, while Allocation Rate determines the pace at which the 5G low-band spectrum expands. Economic variables such as Business Revenue, Business Profit, and Investment Cost form reinforcing and balancing feedback loops that reflect how profitability influences market competition and future investment capacity. Similarly, the interaction between Competition and Bandwidth Allocation introduces regulatory and market-driven constraints, shaping the overall equilibrium of the system. Together, these dynamic relationships enable the model to simulate goal-seeking behavior, where spectrum allocation, service quality, and customer growth evolve toward a stable equilibrium that represents the long-term performance of 5G lowband deployment.
3.4 Validation
Model validation aims to increase confidence in a system dynamics model. A system dynamics model has no absolute validity because it needs to be adjusted to make the model. The validation process needs to be carried out using statistics by comparing the model's behavior with historical data. However, the availability of quantitative data is very limited. System dynamics has a classification of information sources consisting of three levels, namely:
- 1. A numerical database is the ideal quantitative data used as a reference in making an SFD. However, making an SFD on the phenomenon of policymaking in a particular domain cannot only rely on numerical database data sources.
- 2. Written databases, found in books, journals, and other sources can be an additional reference source in making SFD models.
- 3. A mental database is data sourced from individual knowledge or experience related to modeling topics [47].
Validation used to increase confidence in system dynamics can be divided into structural and behavioral tests. The structural test is used to compare the structure of the system dynamics model with the real system. In addition, the model's structure must comply with the rules of system dynamics. Behavioral tests are conducted to determine whether the model's behavior corresponds to the real system's behavior [48].
The structure of the SFD model must reflect that of the real world. The first structural test is to examine the suitability of the structure of the SFD model made with the concept of system dynamics, which consists of four components [49], namely:
- 1. The stock-flow chain expresses the process. Error! Reference source not found. shows that the SFD formed a stock chain (Customers) connected to inflow (Quality of 5G Services) and several variables.
- 2. Information feedback. Error! Reference source not found. is an SFD that forms a loop.
- 3. Policy. In Error! Reference source not found., there is an allocation rate variable that can be set in value with several different scenarios to determine changes in flow.
- 4. Delay. There is a delay between the Business Profit variable and the Business Competition variable.
In addition, verification is also carried out on the parameters using a computer. Each variable must have parameters and the connected variables need to match the equations. The model in Error! Reference source not found. was created using the Vensim PLE x64, version 9.3.0 tools and complied with the structure rules and parameters.
Although Indonesia launched commercial 5G services in Jakarta and select cities in 2021, national adoption has remained modest. As of early 2025, penetration was only around 2% of mobile subscribers due to infrastructure limitations, spectrum rollout delays, and geographic challenges. This aligns closely with our Simulation 1 results—characterized by slow early growth—reinforcing that our model's behavior reflects real-world dynamics in the current phase of Indonesia's 5G rollout.
Indonesia's 5G infrastructure rollout remains selective and fragmented: by mid‑2023 only dozens of cities had coverage and most networks operate on the low‑band spectrum with limited capacity. This context aligns with our modeling focus on low‑band allocation and phased migration, further validating the framing of our simulation scenarios.
4 Results and Discussion
The simulation was conducted over a ten-year period from 2022 to 2032, reflecting the average lifespan of a cellular network technology before the next generation is typically introduced. The model focuses on the allocation of 60 MHz in the low-band spectrum (<2 GHz), under the assumption that this frequency is currently occupied by broadcasting services. As broadcasting transitions from analog to digital, the freed spectrum is gradually reallocated to support 5G services.
To analyze the system's behavior under different regulatory strategies, three allocation rate scenarios were tested:
- 1. Simulation 1 Slow allocation (0.03/Year)
- 2. Simulation 2 Moderate allocation (0.06/Year)
- 3. Simulation 3 Aggressive allocation (0.10/Year)
In Simulation 1, the results show a gradual increase in 5G users over time, with slow spectrum reallocation leading to a steady but modest growth in service adoption and business revenue. A graph of Simulation 1 can be seen in Error! Reference source not found.
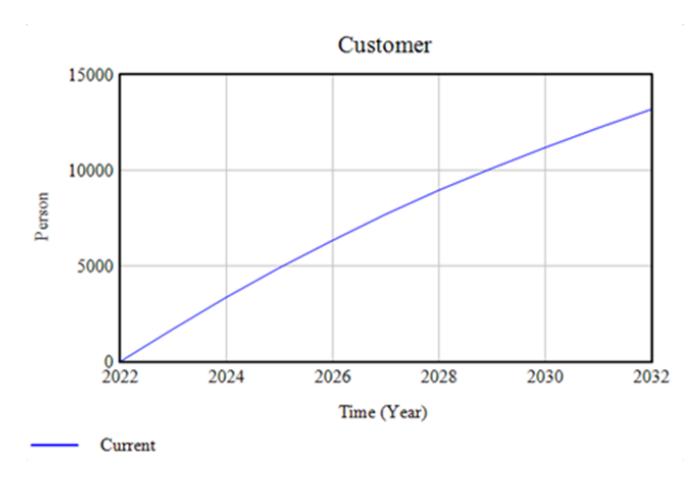
Figure 5 Consumers growth using an allocation rate of 0.03/year.
Error! Reference source not found. shows that the results of Simulation 1 with an allocation rate of 0.03/year indicate an increase in the number of 5G service users yearly. However, the increase tends to be slightly sloping annually. Simulation 1 result data can be seen in Error! Reference source not found.
| Year | 5G Low-bands Gap | Quality of 5G Services | Customer | Business Revenue |
|---|---|---|---|---|
| 2022 | 60 | 25.2 | 0 | 0 |
| 2023 | 58 | 24.36 | 1713.6 | 10281.6 |
| 2024 | 54 | 22.68 | 3370.08 | 20220.5 |
| 2025 | 50 | 21 | 4912.32 | 29473.9 |
| 2026 | 48 | 20.16 | 1713.6 | 38041.9 |
| 2027 | 44 | 18.48 | 6340.32 | 46267.2 |
| 2028 | 40 | 16.8 | 7711.2 | 53807 |
| 2029 | 38 | 15.96 | 8967.84 | 60661.4 |
| 2030 | 36 | 15.12 | 10110.2 | 67173.1 |
| 2031 | 34 | 14.28 | 11195.5 | 73342.1 |
| 2032 | 30 | 12.6 | 12223.7 | 79168.3 |
Tabel 3 Simulation 1 using an Allocation Rate of 0.03/year
Additional simulations were carried out to compare the behavior in this 5G spectrum management phenomenon. Simulation 2 demonstrates faster adoption, with a steeper increase in customer numbers and corresponding gains in business revenue. This suggests that a more proactive allocation policy can accelerate
economic benefits. The graph of Simulation 2 with an allocation rate of 0.06 is shown in Error! Reference source not found..
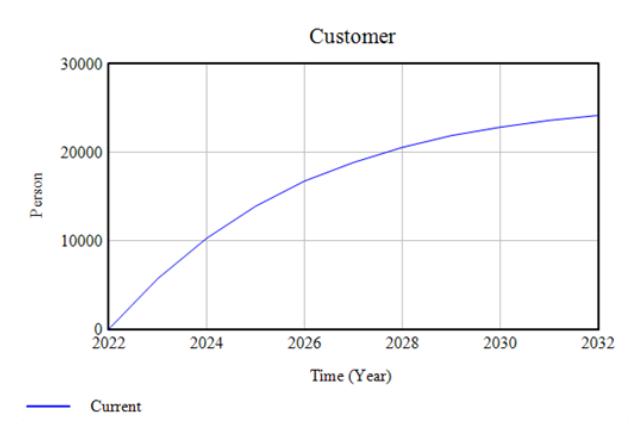
Figure 6 Consumer growth using an allocation rate of 0.06/year.
Simulation 2 in Error! Reference source not found., with an allocation rate of 0.06/year, indicates that the number of 5G service users tends to increase annually as in Simulation 1. Furthermore, the pattern of improvement shows that it is more sloping compared to Simulation 1. The data from Simulation 2 is shown in Error! Reference source not found..
| Year | 5G Low-bands Gap | Quality of 5G Services | Customers | Business Revenue |
|---|---|---|---|---|
| 2022 | 60 | 50.4 | 0 | 0 |
| 2023 | 54 | 45.36 | 3427.2 | 20563.2 |
| 2024 | 46 | 38.64 | 6511.68 | 39070.1 |
| 2025 | 40 | 33.6 | 9139.2 | 54835.2 |
| 2026 | 34 | 28.56 | 11424 | 68544 |
| 2027 | 30 | 25.2 | 13366.1 | 80196.5 |
| 2028 | 26 | 21.84 | 15079.7 | 90478.1 |
| 2029 | 22 | 18.48 | 16564.8 | 99388.8 |
| 2030 | 20 | 16.8 | 17821.4 | 106929 |
| 2031 | 16 | 13.44 | 18963.8 | 113783 |
| 2032 | 14 | 11.76 | 19877.8 | 119267 |
Tabel 4 Simulation 2 using an Allocation Rate of 0.06/year
A third simulation was carried out to determine the pattern that occurs in the phenomenon that is the topic of this research. Simulation 3 reveals a rapid uptake in the first years, eventually plateauing as the spectrum becomes fully allocated and market saturation occurs. This scenario highlights the goal-seeking behavior of the system, where growth stabilizes once resource limitations are reached. The graph of Simulation 3 with an allocation rate of 0.1/year is shown in Error! Reference source not found..
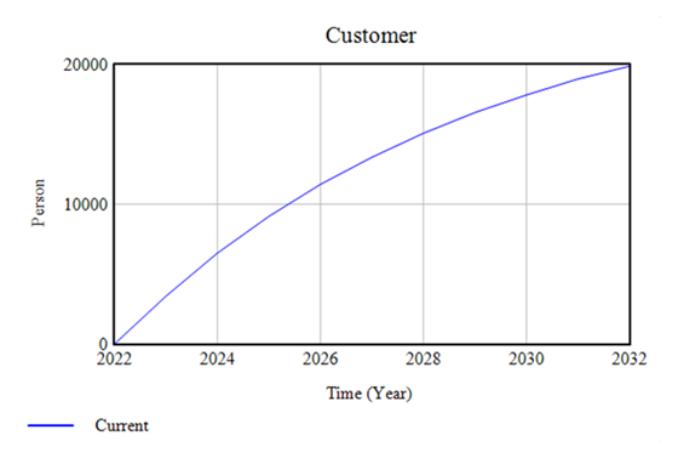
Figure 7 Consumers growth using an allocation rate of 0.10/year.
In Error! Reference source not found., the results of Simulation 3 with an allocation rate of 0.10/year show that the number of 5G service users has an increasing trend yearly, similar to Simulations 1 and 2. In addition, the pattern of increase shows a slope that ends up almost flat. Simulation 3 result data can be seen in Error! Reference source not found..
| Year | 5G Low-band Gap | Quality of 5G Services | Customers | Business Revenue |
|---|---|---|---|---|
| 2022 | 60 | 84 | 0 | 0 |
| 2023 | 48 | 67.2 | 5712 | 34272 |
| 2024 | 38 | 53.2 | 10281.6 | 61689.6 |
| 2025 | 30 | 42 | 13899.2 | 83395.2 |
| 2026 | 22 | 30.8 | 16755.2 | 100531 |
| 2027 | 18 | 25.2 | 18849.6 | 113098 |
| 2028 | 14 | 19.6 | 20563.2 | 123379 |
| 2029 | 10 | 14 | 21896 | 131376 |
| 2030 | 8 | 11.2 | 22848 | 137088 |
| 2031 | 6 | 8.4 | 23609.6 | 141658 |
| 2032 | 4 | 5.6 | 24180.8 | 145085 |
Tabel 5 Simulation 3 using an Allocation Rate of 0.10/year
Overall, the model confirms that the pace of spectrum allocation directly influences the rate of 5G adoption and industry profitability. However, an overly aggressive allocation may lead to diminishing returns if market demand stabilizes or infrastructure readiness cannot keep pace. These results support the need for phased, data-driven spectrum migration strategies. By simulating different allocation scenarios, policymakers can better anticipate long-term outcomes and design policies that balance service availability, economic impact, and market competition.
It is important to note that this model assumes fixed investment costs across all service providers and does not incorporate variations in consumer behavior, such as price sensitivity, service quality preferences, or regional adoption disparities. These simplifications were made primarily due to the current limitations in available granular data, especially in the Indonesian context, where 5G implementation is still at an early stage. Furthermore, Indonesia's geographic complexity—with over 17,000 islands—and diverse socioeconomic conditions present significant challenges in accurately capturing localized consumer behavior within a single quantitative framework.
Despite these limitations, system dynamics remains a highly suitable and robust methodology for this type of policy-oriented modeling. The main strength of system dynamics lies in its ability to model feedback mechanisms, time delays, and complex interdependencies between technical, economic, and regulatory factors. Unlike AI or optimization-based models, which often require highresolution datasets and focus on static decision points or resource allocations, system dynamics allows for a longitudinal view of system behavior. This is particularly important for phased implementations such as spectrum migration, where changes unfold gradually over time and depend heavily on policy interventions, infrastructure readiness, and technological evolution.
In this context, system dynamics offers a strategic-level tool for scenario planning and policy simulation. By abstracting individual consumer variations and focusing instead on systemic drivers—such as investment incentives, competition dynamics, and spectrum availability—the model provides actionable insight into long-term trends and outcomes. It allows regulators to anticipate bottlenecks, test the implications of alternative allocation strategies, and design phased interventions that align with national objectives. Future work can enhance this model by incorporating agent-based modeling or hybrid methods to capture micro-level behaviors, but for system-level planning and policy analysis, system dynamics provides a comprehensive and effective approach.
5 Conclusion
The results of Simulations 1, 2, and 3 show that the number of customers always increases yearly and in a continuous goal-seeking pattern. The goal-seeking pattern shows behavior that will lead to stability after a certain period. This occurs in the 5G spectrum management phenomenon because the frequency spectrum is a limited resource. Several studies have been conducted to optimize the use of radio spectrum through spectrum sharing. However, none have discussed the process of optimizing its use by modeling the phased migration from other services to 5G. Therefore, this research provides another perspective on optimizing the radio spectrum using a spectrum-sharing approach.
This study proposes modeling using system dynamics to determine the 5G spectrum management pattern influenced by endogenous and exogenous variables based on technical and economic aspects. The system dynamic modeling in this study used the Vensim PLE x64, version 9.3.0 tools and was conducted in three scenarios to determine the patterns.
The implementation of 5G services should pay attention to the supply-demand factors of 5G services. The supply factor of 5G services focuses on the availability of radio spectrum allocations, because it is a limited resource and the foundation for the implementation of 5G services. Meanwhile, the demand for 5G services is seen from the growth in demand for 5G services from consumers. This research focused on planning the stages of 5G implementation based on the supply factor, because the radio spectrum is a limited resource that is a determining factor for the implementation of 5G services.
There are four fundamental modes of dynamic system behavior, namely exponential growth, goal seeking, oscillation, and point process [29]. The results showed that the phenomenon of 5G radio spectrum management indicates goalseeking behavior because the radio spectrum is a limited resource. Goal-seeking behavior moves towards stability after a certain period. With this behavior, the number of consumers of 5G services will reach a maximum point after a certain period and there will be almost no more addition again. Furthermore, regulators can use this model to conduct simulations before setting 5G spectrum management policies.
This model serves as a strategic decision support tool for regulators, enabling simulation of various 5G spectrum allocation scenarios and their impact on service adoption, business dynamics, and economic outcomes. By providing visibility into how different allocation rates influence consumer uptake and operator profitability over time, policymakers are better equipped to plan phased spectrum releases that align with infrastructure readiness and actual demand. The model allows them to evaluate the consequences of spectrum pricing, bandwidth allocation pace, and regulatory intervention—ultimately guiding more effective and adaptive spectrum management strategies.
In addition, the model offers insight into how regulatory decisions affect market competition. Without intervention, high investment costs and rapid allocation may discourage participation by smaller providers, leading to monopolistic tendencies. Policymakers can use this model to test preventive measures such as staggered licensing fees, infrastructure-sharing mandates, or rural deployment incentives. Moreover, the model helps identify underserved regions at risk of digital exclusion, supporting policies aimed at equitable 5G access. By leveraging system dynamics, regulators can shift from reactive decision-making to proactive, evidence-based policy design—ensuring that 5G implementation supports inclusive growth and long-term national digital transformation goals.