
1 Introduction
Breast cancer constitutes around 23% of the total cancer cases, rendering it a prevalent ailment among women on a global scale [1]. In rare cases, it sometimes also occurs in men, who account for roughly 0.5 to 1% of all BC cases. BC is not an infectious or transmissible disease. It is typically a critical illness for women between the ages of 40 and 50. Breast cancer (BC) is a malignant neoplasm that has metastasized from breast cells. A malignant tumor is characterized by the presence of cancerous cells that possess the capacity to invade neighboring tissues and metastasize to far anatomical sites, including the brain, bones, and lungs [2].
In 2008, 1.38 million women were diagnosed with BC, representing 50% of all BC patients and about 60% of all deaths [3]. In 2012, there were 1.7 million new cases reported [4]. In 2013, around 232,340 women were identified as having BC, and among them 39,620 women died due to BC in the USA [3]. In 2015, India recorded approximately 156,100 new cases of BC and 76,000 women were expected to die from the disease according to the WHO [5]. In the USA, an estimated 316,100 new instances of breast cancer were reported, with an estimated 40,500 individuals projected to succumb to this ailment [6]. In the year 2018, 627,000 females died as a result of this devastating condition [7]. The ACS estimates that there were 3.1 million BC survivors in the USA. According to an ACS press release from 2019, invasive BC has been detected in 268,500 women and around 2,600 men, while 62,900 women had been diagnosed with noninvasive BC. In 2019, it was anticipated that 41,760 women and 500 men would die from BC [8]. According to the WHO, there will be 2.3 million females diagnosed with BC and 685,000 deaths worldwide in 2020. BC impacts around 255,000 women and 2,300 men annually in the USA. According to the CDC, breast cancer kills roughly 42,000 women and 500 men in the USA each year. Every year, 150,000 Indian women are diagnosed with BC, with 70,000 of them dying as a result, according to the ICMR. In the United Kingdom, 1 in every 12 females between the ages of 1 and 85 is diagnosed with breast cancer [9]. As to the WHO, 2.1 million women are impacted by BC annually. In 2021, around 284,200 women with BC were identified and 44,130 were expected to pass away from the disease [10]. Among women in the USA, it was projected that in 2022 there would be around 287,850 new instances of invasive BC and 51,400 cases of DCIS. Additionally, it was estimated that 43,250 people would succumb to BC [11].
As a result, BC is quickly becoming the most life-threatening disease in the world. BC cannot be avoided [12], but it can be cured if it is caught early enough, before it spreads to any other part of the body. If detected early and treated correctly, the mortality rate of BC will decrease. Finding preventative treatment is crucial given the severity of the life-threatening challenges that patients encounter. It is crucial to recognize BC early on in order to provide appropriate treatment, avoid complications, and lower BC mortality. Several studies have been conducted in order to develop an intelligent system for the prediction of BC using different methodologies like WNBC, (AR + NN), AdaBoost ELM model, and others. However, it is commonly observed that the majority of expert systems exhibit deficiencies in effectively managing data preprocessing and systematically select features.
In order to surmount these constraints, this research paper describes an intelligent system named Intelligent System for Predicting Breast Cancer (ISPBC) using a novel feature selection technique to diagnose BC based on symptomatic aspects. In the proposed ISPBC system, the EFS feature selection approach is utilized to identify the most pertinent features inside a BC data set. To get efficient features, EFS uses a heuristic search technique (HST) and stochastic hill climbing (SHC). HST approaches have the advantages of greater efficiency and effectiveness, reduced time complexity by reducing the search space to find an optimal solution. The SHC method makes the whole search space more likely to be explored and raises the chance of escaping local optima and discovering more relevant responses.
This study evaluated the accuracy of different stand-alone and ensemble machine learning algorithms, as well as numerous models found in the literature by comparing them to the proposed system based on a BC data set. To achieve optimal predictions, a tenfold cross-validation procedure was applied to validate the model. Hence, the proposed model offers a precise breast cancer detection system. According to the evaluation, the ISPBC demonstrated a peak accuracy of 96.09% when employed in conjunction with several single-classifier models, ensemble models, and models derived from the literature. The execution of the ISPBC system was also compared to the accuracy, precision, and recall of simple Decision Tree (DT) and simple Random Forest (RF).
The rest of this paper is organized as follows: Section 2 introduces related works in breast cancer prediction and their methodology. Section 3 describes the proposed model for breast cancer prediction. In Section 4, the data set description and data preprocessing methods used in this study are provided. Section 5 discusses the proposed feature selection method, the results, and appropriate commentary based on the models. Section 6 follows with the conclusion.
2 Literature Review
Numerous recent studies have been undertaken with the aim of forecasting the occurrence of breast cancer. Even though many researchers have worked on this topic using ML algorithms, this section summarizes previous research on BC diagnosis.
Dai et al. [13] discusses diagnosing of BC using RF. To achieve high prediction accuracy, the RF approach incorporates several eigenvalue features as well as the outputs of many DTs. The researchers used BC data from the UCI Repository with 569 instances. From the experimental analysis, they acquired a 95.56% prediction accuracy for BC. They also determined specificity, sensitivity, and precision. Gupta et al. [14] investigated various ML techniques for BC prediction, including K-NN, LR, DT, RF, and SVM, using a radial basis function kernel. They used a BC data set from the UCI Machine Learning Repository and compared the results of the various techniques. Deep Learning with ANN achieved the highest level of accuracy with a score of 98.9 percent. The best result came from Adam's gradient descent learning, which seeks to minimize errors while also training data as efficiently as possible. Kabiraj et al. [15] presents two ML algorithms, RF and XGBoost, to detect BC using a BC data set with 275 instances and 12 features. They compared the results in terms of accuracy, sensitivity, precision, F1-Score, and specificity to the mention classifiers. From the experimental analysis, they got a 74.73% prediction accuracy for BC using RF and a 73.63% accuracy using XGBoost. Aroef et al. [16] studied the classification of BC using RF and SVM. In addition, hold-out validation was utilized to validate and determine the performance of the abovementioned models. According to the results, RF achieved 90.9% accuracy and SVM achieved 95.4% accuracy. Therefore, SVM gave better results than RF.
Wang et al. [17] proposed the Improved Random Forest-based Rule Extraction (IRFRE) technique for diagnosing BC. This method uses a DT ensemble to develop precise and comprehensible classification rules for the diagnosis of BC. Three BC data sets were analyzed to assess method accuracy and interpretability. The empirical findings demonstrated that the IRFRE technique surpassed several widely used individual techniques, ensemble learning techniques, and rule extraction techniques in terms of precision and comprehensibility, thereby significantly enhancing the performance of cancer detection. Bharati et al. [18] used a variety of classification algorithms to detect BC, including NB, RF, LR, MLP, and K-NN. For this purpose, they used the WEKA data mining tool. They obtained a BC data set from the UCI machine learning library with 286 instances. The BC data set was explored in terms of Kappa statistics, FP rate, TP rate, and precision. The incidence of BC was predicted using a variety of approaches, and the results of each technique were compared. The performance of the K-NN classifier algorithm was 97.9021, which was the highest number of correctly classified items. Montazeri et al. [19] recommend a model named Trees Random Forest for the prediction of various types of BC survival using different machine learning methods. They also used a rule-based classification approach for this purpose. When compared to other methodologies, the TRF technique produced better outcomes in the investigation, with a 96% accuracy rate. Octaviani et al. [20] discusses breast cancer prediction using a Random Forest ensemble learning method. The BC data was taken from the UCI repository. The result of this experiment was more than 99% accuracy.
Table 1 Accuracies of previous works using Decision Tree and their limitations.
| Ref. | Year | Methodology | Limitation | |
|---|---|---|---|---|
| [21] | 2015 | DT + SVM model | No proper preprocessing and no mention feature selection technique | 91 |
| [22] | 2016 | NN, DT(J48), ANN, SVM, etc. | No proper data preprocessing method and does not check for outliers in the BC data set. | 94.56 |
| [23] | 2017 | J48, RF, Random tree, REP Tree Only missing value handling. Priority based | 95.43 | |
| [24] | 2017 | DT | No proper preprocessing. | 94.3 |
| [25] | 2018 | NB, RBFN and J48 Only missing value handling. | 93.41 | |
| [26] | 2018 | DT and ANN | No preprocessing. | 94.0 |
| [27] | 2019 | No proper data preprocessing K-NN, SVM, DT, method and does not check for RF, and MLP. outliers in the BC data set. | 92.85 | |
| [28] | 2020 | NB, J48, RF, SMO No feature selection and data and preprocessing MLP | 94.27 | |
| [29] | 2020 | BN, SVM, DT(J48), LG, RF, MLP | No proper data preprocessing method. | |
| [30] | 2022 | RF, SVM, MLP and DT | Only missing data handling | 93.41 |
| [31] | 2022 | J48, NB, LR, SVM and KNN | No proper data preprocessing method and does not check for outliers in the BC data set. | 92 |
| [32] | 2022 | SVM, LR, DT, RF and K-NN | Only missing value handling. | 94.29 |
| [33] | 2022 | ESBCP system | Does not consider the overfitting problem. | 94.01 |
Table 2 Accuracies of previous works using Random Forest and their limitations.
| Ref. | Year | Methodology Limitation | Accuracy of RF (%) | |
|---|---|---|---|---|
| [34] | 2017 | LR, DT and RF | No proper data preprocessing method and does not check for outliers in the BC data set. | 88.14 |
| [35] | 2018 | DT, RF, SVM, NN and LR. | No proper preprocessing and no mention feature selection technique. | 96.1 |
| [36] | 2019 | PCA+RF, RF, KNN, NB, ANN and PCA+ANN | Does not check for outliers in the BC data set. | 95.0 |
| [37] | 2019 | No proper data preprocessing RF, Randon Tree, method and does not check for NB,etc outliers in the BC data set. | 96. 63 | |
| [38] | 2019 | K-NN, SVM, DT, RF, and MLP. | No proper data preprocessing method and does not check for outliers in the BC data set. | 96.42 |
| [28] | 2020 | NB, J48, RF, SMO and MLP | No feature selection and data preprocessing. | 95.56 |
| [29] | 2020 | BN, SVM, DT(J48), LG, RF, MLP | No proper data preprocessing method. | 95.57 |
| [39] | 2020 | KNN, RF, ANN, SVM, and LR | Only missing value handling. | |
| [40] | 2020 | RF, SVM, KNN and LR | No proper data preprocessing. | 91.66 |
| [41] | 2021 | fuzzy-ID3 (FID3) model | No missing value handling and tenfold CV. | 94.36 |
| [42] | 2022 | LR, DT, RF, KNN and NB | No proper data preprocessing method and does not check for outliers in the BC data set. | 95.32 |
| [32] | 2022 | SVM, LR, DT, RF and K-NN | Only missing value handling. | 93.81 |
Research Gap: Although numerous researchers have used DT and RF methods to predict breast cancer, there is always room for improvement to make them more accurate. To improve BC prediction accuracy, the suggested work developed a unique feature selection technique named Enriched Feature Set (EFS).
This study concentrated on three main points:
- 1. Using two tree-based classifiers a decision tree classifier and a random forest classifier.
- 2. An innovative and effective approach of the feature selection model EFS.
3. A novel and efficient breast cancer prediction expert system – ISPBC.
3 Methodology
ISPBC is divided into three stages: a) data preparation; b) feature selection (FS); and c) classification. The term 'raw data' refers to a jumbled collection of several types of information. The BC data set is typically insufficient, inconsistent, lacking in specific patterns, and prone to various errors. The irrelevant and unneeded features are deleted during this data preparation phase in order to generate a data set with optimal features for BC prediction. Therefore, the raw BC data set is translated into a suitable and understandable format that can be easily understood. Feature selection is the process of picking a subset of relevant features. The next stage, i.e., feature selection, is used to select the best features from the BC data set. Classification is a basic task in data mining that has been extensively researched in statistics, machine learning, neural networks, and expert systems over the years. Here, DT and RF employ the proposed system to detect BC. The proposed ISPBC is depicted schematically in Figure 1.
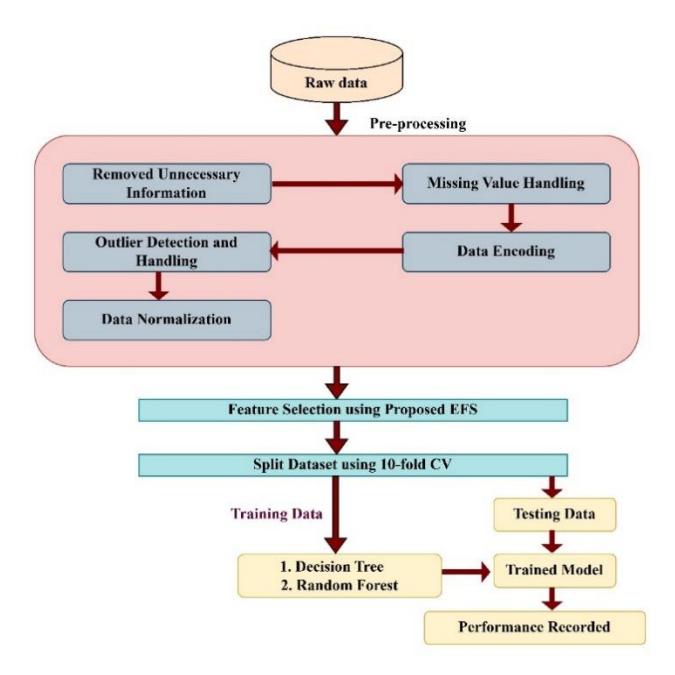
Figure 1 Intelligent System for Predicting Breast Cancer (ISPBC).
4 Data Description
In this study, we used the publicly available breast cancer data set created by Dr. W. H. Wolberg of the University of Wisconsin, which was obtained from the UCI
ML repository [43]. It has 699 cases derived from fine-needle aspiration articulations of human breast tissue. The data set contained 458 and 241 benign and malignant cases, respectively. Because 16 instances of the data set contained missing information, we employed 683 examples in our experiment, with 444 and 239 instances belonging to the 'benign' or 'not harmful' and 'malignant' or 'may be dangerous' classes, respectively. Every instance had eleven attributes, as shown in Table 3.
| SL NO | id | Clump Thickness | Uniformity of Cell Size | Uniformity of Cell Shape | Marginal Adhesion | Single Epithelial Cell Size | Bare Nuclei | Bland Chromatin | Normal Nucleoli | Mitoses | Class |
|---|---|---|---|---|---|---|---|---|---|---|---|
| 0 | 1000025 | 5 | 1 | 1 | 1 | 2 | 1 | 3 | 1 | 1 | 2 |
| 1 | 1002945 | 5 | 4 | 4 | 5 | 7 | 10 | 3 | 2 | 1 | 2 |
| 2 | 1015425 | 3 | 1 | 1 | 1 | 2 | 2 | 3 | 1 | 1 | 2 |
| 3 | 1016277 | 6 | 8 | 8 | 1 | 3 | 4 | 3 | 7 | 1 | 2 |
| 4 | 1017023 | 4 | 1 | 1 | 3 | 2 | 1 | 3 | 1 | 1 | 2 |
| 694 | 776715 | 3 | 1 | 1 | 1 | 3 | 2 | 1 | 1 | 1 | 0 |
| 695 | 841769 | 2 | 1 | 1 | 1 | 2 | 1 | 1 | 1 | 1 | 0 |
| 696 | 888820 | 5 | 10 | 10 | 3 | 7 | 3 | 8 | 10 | 2 | 1 |
| 697 | 897471 | 4 | 8 | 6 | 4 | 3 | 4 | 10 | 6 | 1 | 1 |
| 698 | 897471 | 4 | 8 | 8 | 5 | 4 | 5 | 10 | 4 | 1 | 1 |
Table 3 Raw Data Description.
Figure 2 describes the features' correlations with each other in the BC data set.
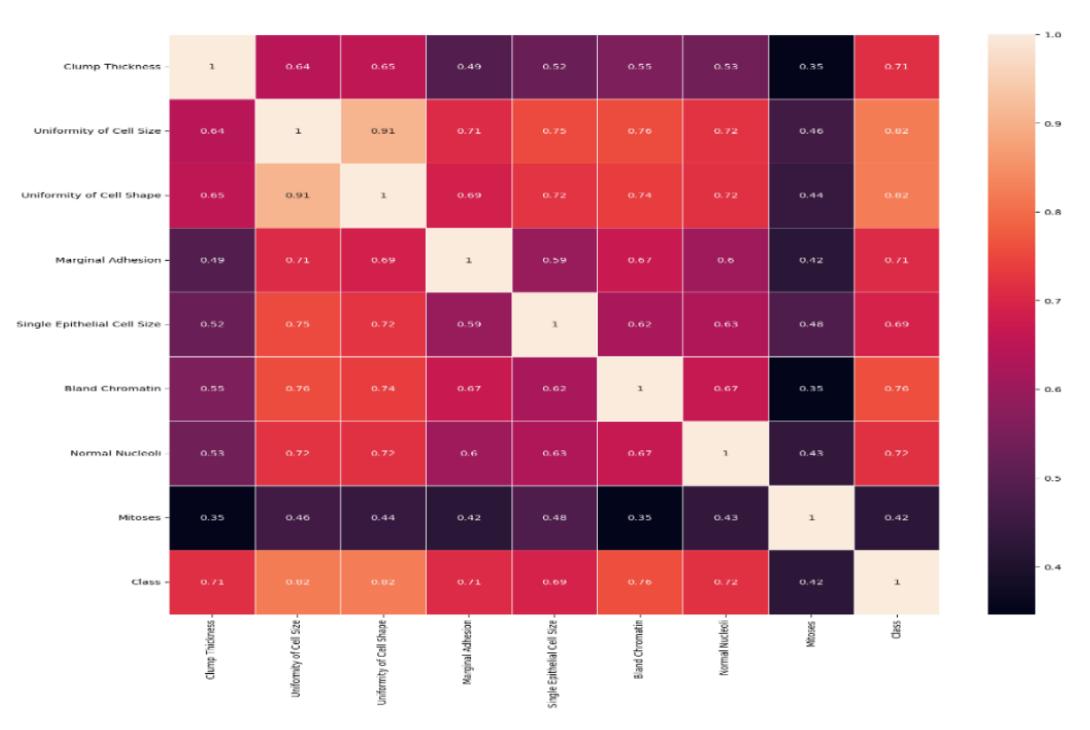
Figure 2 Heatmap of BC data set.
4.1 Data preprocessing
Data preparation is essential, because it transforms the data set into a usable format that the method can handle. It contains the following sub-phases.
4.1.1 Remove Unnecessary Information
One attribute was an extraneous feature. In order to generate homogeneous data collection, the item 'id' was removed in this stage.
4.1.2 Missing Data Handling
The collected BC data sets from the UCI repository contained a number of features to represent the data set. In the BC data sets, the bare nuclei attribute had 16 rows, with missing values denoted by '?'. There are several methods for dealing with missing values, such as imputation with the mean, mode, and so on. We removed these from the data set for simplicity. After removing them, the final data set contained 683 records, 444 of which were classified 'benign' and 239 of which were classiefied 'malignant'. The following table shows the data distribution of after deletion.
4.1.3 Data Encoding
Because the raw data of breast cancer (BC) consisted of 11 attributes, there was only one object data type among the most basic nuclei. To facilitate processing, the feature was encoded using label encoding, resulting in six labels, ranging from 0 to 6. The attribute class under consideration was classified into two distinct categories, namely benign ('2') and malignant ('4'). Furthermore, the encoding process involved assigning a value of 0 to benign tumors and a value of 1 to malignant tumors.
4.1.4 Outlier Detection and Handling
Outliers are elements that cause difficulties for learning and prediction. Detection and removal of outliers present in the data set is a challenging issue [44]. In our work, we utilized the z-score to find outliers in the data set. An absolute value of the z-score of less than 3 was taken into account; 73 records were identified as outliers.
4.1.5 Data Normalization
The features in the breast cancer data sets were converted in such a way that each characteristic contributed equally. This was mostly done to organize and analyze large amounts of data. It also converted the data from one format to another to enable further processing in this stage. For standardization to work, all of the input variables are adjusted independently by taking the standard deviation and subtracting the mean. This changes the distribution so that the standard deviation is one and the mean is zero.
4.2 Feature Selection
In this study, we present EFS to pick the most important BC data set features. This method uses heuristic search and stochastic hill climbing to choose the most important and promising features. A fitness proportionate selection approach (fitness function) eliminates insignificant features. Here, the search for features was carried out using a fixed number of iterations. The proposed algorithm uses total accuracy as its scoring function and modified DT is utilized as the learning model. Every feature in every data set is categorized according to the number of classes it belongs to and its distance from the centroid of the cluster determines its score. It is the value of this score that is utilized by the fitness proportionate selection procedure (FS). The modification is retained if the improved learning model's overall performance is a result of the additional subset of features. If it does not, it is ignored and another neighbor in the feature space takes its place. The largest number of predetermined iterations is used to execute this procedure. The EFS feature selection approach is shown schematically in Figure 3.
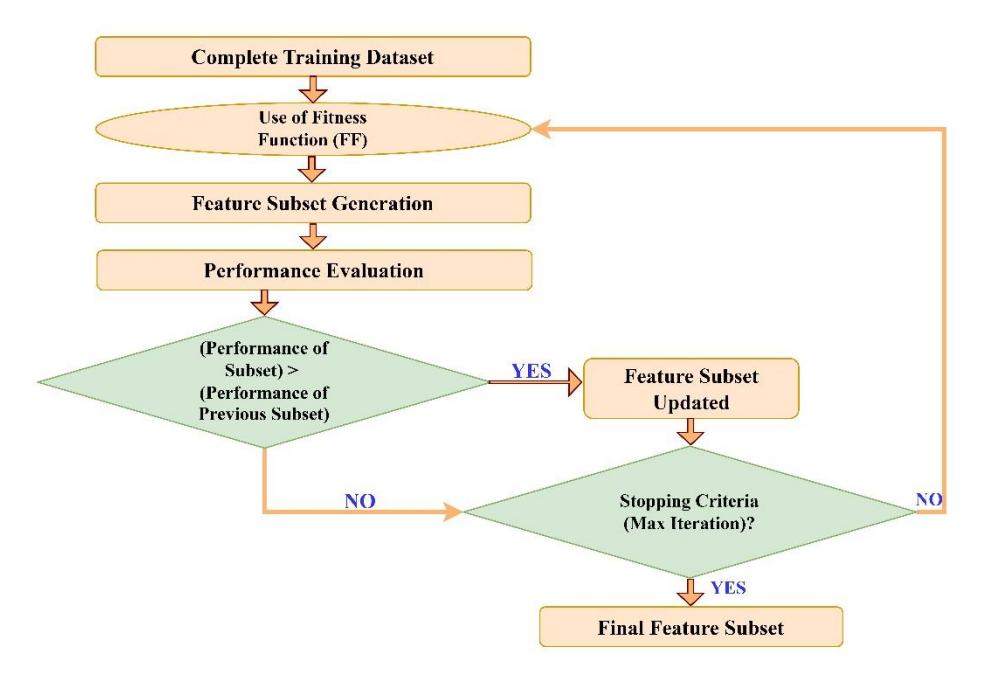
Figure 3 Enriched Feature Set (EFS).
The algorithmic form of the feature selection (FS) technique is shown below.
EFS algorithm for FS
Input: Initial set feature Output: Feature subset
Notations:
→
→
→
→
→
→ ℎ ℎ '
→
→ ℎ
→ ℎ ℎ
→ s
Procedure:
: ℎ () () .
: ℎ _ ℎ
. : () ℎ ℎ (. , . )
. :
\[dist = \sqrt{\sum_{k=1}^{m} (x_{ik} - y_{ik})^2}\]
− ℎ ℎ ℎ
. : ℎ
\[Centroid = \frac{\sum mean \ values \ of \ the \ features \ present \ in \ the \ cluster}{number \ of \ features \ in \ the \ cluster}\]
. :
_ () = ℎ .
:
S3. 1: \[SF = EFS\] (IFS, score_value)
S3.2: if \(P_{acl} > P_{ac}\)
\(FS = SF\)
\(P_{ac} = P_{acl}\)
\(IFS = SF\)
Return FF
4.3 Classification
RF is one of the most prominent supervised ML methods. It may be utilized for both classification and regression methods in solving problems. It is based on the ensemble learning technique, which integrates several classifiers to solve the problem and also increases the model's performance. It collects predictions from each DT and predicts the final output based on the majority of votes. In a RF, each DT is increased by utilizing a bootstrap sample of the training data. As a result, some cases are not utilized in the method of increasing a tree. This is called out-of-bag (OOB) and is used for evaluating variable importance and predictive performance [45-47].
The variable importance or feature importance of a decision tree can be determined by examining the prediction accuracy of the tree before and after random permutations of the actual feature. Variable importance or feature importance is the capacity to measure the significance of explanatory variables in prediction over all the decision trees in RF. The significance of explanatory variables is determined by the decrease in predictive accuracy when their values are randomly permuted. In this way, RF gives a more accurate and stable prediction.
Thus, an RF classifier is basically just a group of DTs chosen at random from the training set; the final prediction is then derived from the sum of all DTs' votes. However, during the data preparation process, data sets may include some irrelevant features that decrease the DTs' performance in building the RF.
5 Experimental Result and Discussion
Python is used to test the proposed intelligence expert model, ISPBC, in a Windows environment. The suggested model employs the proposed EFS feature selection method. Tenfold CV was used to validate the suggested model. It used a total of 683 estimators to analyze the data sets for BC prediction.
We used EFS in this work to select the most significant and promising features by removing irrelevant and redundant features from the existing feature set. To eliminate a feature, a fitness proportionate selection technique was used, with a probability of selecting a feature based on its score value. To validate the findings, the proposed approach was compared to simple DT and simple RF. The comparisons were based on accuracy, precision, and recall. A confusion matrix was used to describe the performance of the ISPBC model in this case. Table 4 shows the confusion matrix.
Table 4 Confusion Matrix.
| Predicted: NO | Predicted: YES | ||
|---|---|---|---|
| NO | True Negative (Tn) | False Positive (Fp) | |
| Actual: | YES | False Negative (Fn) | True Positive (Tp) |
This ISPBC model was used to determine the accuracy, precision and recall [51- 53] using Eqs. (1) to (3):
\[Accuracy = (Tp + Tn) / (Tp + FP + Tn + Fn)\] (1)
\[Precision(Pr) = Tp / (Tp + Fp)\] (2)
\[Recall(Rc) = Tp / (Tp + Fn)\] (3)
Table 5 shows the results for the ISPBC system's accuracy tested with DT and RF. The ISPBC system is contrasted with the simple DT and RF methods. Compared to their simple version, the suggested ISPBC with DT and RF exhibited a greater classification accuracy. This is due to the fact that the proposed ISPBC improves classifier performance by handling missing values and removing outliers. The suggested ISPBC with RF outperformed the competition in terms of accuracy, according to further analyses. According to the results, for the breast cancer data set, the accuracy of ISPBC was 2.43%, i.e., 0.94% more accurate than that of the simple DT and simple RF, proving ISPBC's capacity to improve the performance of the proposed model. For this experiment, ISPBC was found to be more accurate than simple DT and simple RF, respectively.
Table 5 Performance Comparison (in %).
| Metric | Simple DT | Simple RF | ISPBC using DT | ISPBC using RF |
|---|---|---|---|---|
| Accuracy | 93.17 | 95.12 | 95.60 | 96.09 |
| Precision | 94 | 95 | 94 | 96 |
| Recall | 92 | 94 | 92 | 95 |
Figure 4 is a visual representation of the accuracy comparison among the suggested ISPBC, simple DT and RF, which helps with viewing and understanding.
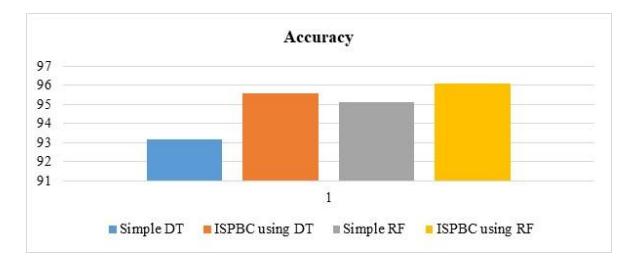
Figure 4 Accuracy comparison graph for BC.
Table 5 displays the precision of the ISPBC model compared with simple DT and simple RF. According to the results, ISPBC's precision for the BC data set was greater than that of simple RF but the same as that of simple DT. Although higher precision improves the effectiveness of the suggested model, there are still cases where actual positive malignant cases were predicted incorrectly. Enhanced precision performance demonstrates a reduced occurrence of false positives and a high level of accuracy in predictions.
Figure 5 is a visual representation of the precision comparison between the proposed ISPBC, simple DT and RF, which helps with viewing and understanding.
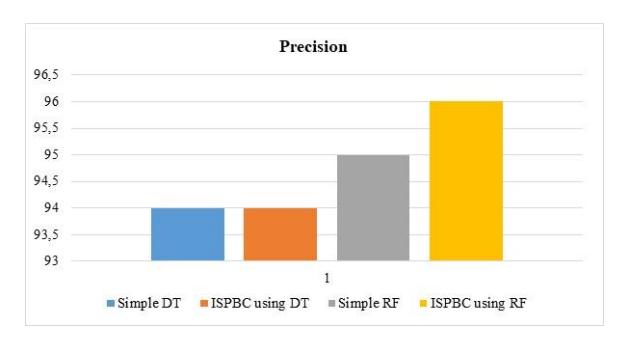
Figure 5 Precision comparison graph for BC.
Better performance in terms of recall illustrates that the number of false negatives is comparatively lower and the prediction is almost fully accurate. Table 5 displays the recall of the ISPBC system. Recall was taken into account to enhance this work. According to the results for the BC data set, the recall of ISPBC was 3% more accurate than that of simple RF, but the same as that of simple DT, proving ISPBC's capacity to improve the performance of the proposed model.
In order to better grasp the performance of the proposed ISPBC, simple DT, and RF, Figure 6 provides a graphic representation of the comparison of their recall.
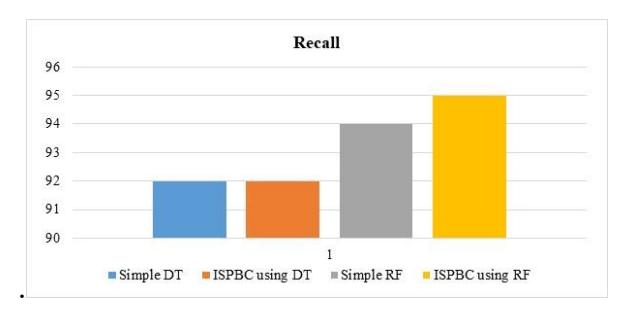
Figure 6 Recall comparison graph for BC.
Table 6 presents a performance comparison between the proposed ISPBC, singleclassifier, ensemble models and other models in the literature.
Table 6 Comparison with previous works.
| Reference | Methodology single-classifier models | Accuracy (%) | |
|---|---|---|---|
| [22] | J48 | 94.56 | |
| [24] | DT | 94.30 | |
| [25] | J48 | 93.41 | |
| [26] | DT | 94.0 | |
| [27] | DT | 92.85 | |
| [30] | DT | 93.41 | |
| [31] | J48 | 92.00 | |
| [48] | LR | 88.14 | |
| Simple DT | 93.17 | ||
Accuracy of the proposed Model ISPBC with DT is 95.60%, that is, better than the above works.
| Ensemble models | ||
|---|---|---|
| [28] | RF | 95.56 |
| [29] | RF | 95.57 |
| [32] | RF | 93.81 |
| [34] | RF | 88.14 |
| [36] | RF | 95.00 |
| [39] | RF | 95.71 |
| [40] | RF | 91.66 |
| [41] | RF | 94.36 |
| Various models present in literature | ||
| [21] | DT + SVM model | 91.00 |
| [33] | ESBCP system | 94.01 |
| [49] | WNBC | 92 |
| [50] | Firefly Algorithm based Expert System | 94.81 |
| Simple RF | 95.12 |
Accuracy of proposed Model ISPBC with RF is 96.09%, that is, better than the above works.
Table 8 shows that when ISPBC was compared to the following models: (DT + SVM) model [21], ESBCP [33], WNBC [49], and Firefly Algorithm-based Expert System models [50], the proposed ISPBC model stood head and shoulders above the others.
Also when compared to several single-classifier and ensembles of models, the proposed ISPBC model outperformed them all in terms of accuracy. These models included single-classifier models ([22],[24-27],[30-31],[48]) and ensemble models ([28-29],[32],[34],[36],[39], [40-41]).
Evaluating the performance in relation to current cutting-edge models, it was seen that the prior models did not properly employ feature selection and data preprocessing. So, from Table 6, it can be seen that the proposed model ISPBC performed better in terms of accuracy than the single-classifier-based models, ensemble models, and various models present in the literature.
A visual representation of the accuracy of the proposed ISPBC compared to models found in the literature is shown in Figure 7.
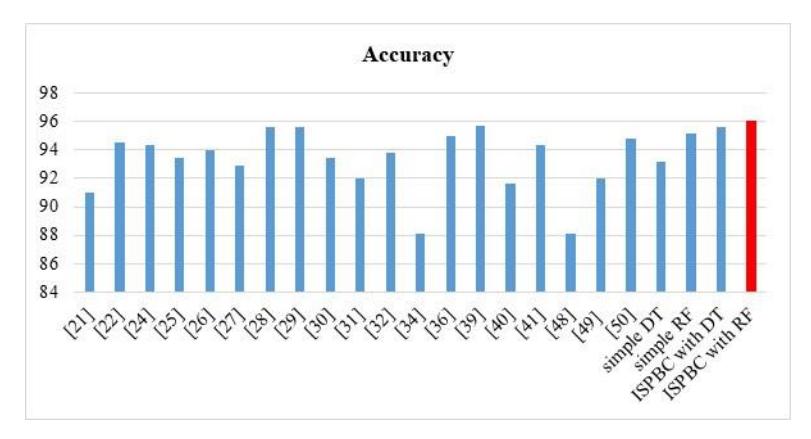
Figure 7 ISPBC performance compared to SOTA models.
6 Conclusion
Breast cancer is a life-threatening disease that has exploded into a global epidemic in recent decades. As a result, early detection and treatment of BC are critical. Even though all features of BC are not required for BC prediction, the proposed model employs DT, RF, and the EFS algorithm, demonstrating that such a lazy learning approach outperforms RF and DT, as shown above in Table 1 and 2. The Enriched Feature Set (EFS) method was developed to select the most significant features. The data preprocessing phase in the proposed model (ISPBC) takes the raw BC data set and preprocesses it by removing irrelevant features using Remove Superfluous Information, Missing Data Handling, and Normalized Data stages. Tenfold CV was used to validate the suggested model. Once the model had been trained, it was tested, and the results showed that the accuracy of ISPBC was superior to that of simple DT and simple RF by 2.43%, and 0.94%, respectively. Additionally, the recall and precision performance metrics were used to confirm the expert model's performance and it was further compared to simple DT, simple RF, and the proposed model ISPBC. It was found that the recall and precision performances of ISPBC were better than those of simple DT and simple RF, respectively. ISPBC uses symptomatic features to diagnose breast
cancer, saving time and money while also detecting breast cancer at an early stage. Because the ISPBC model outperforms simple DT, and simple RF, it can be summarized as a substantial, user-satisfying intelligent system for detecting BC early on.
The ISPBC model's performance may be improved in the future by training it on a larger set of data and then using various preprocessing approaches to remove all irrelevant and superfluous data.
Abbreviations
ACS: American Cancer Society; ANN: Artificial Neural Network; ESBCP: Expert System for Breast Cancer Prediction; FP: False Positives; FS: Fitness Function; HST: Heuristic Search Technique ; ICMR: Indian Council for Medical Research; IRFRE: Improved Random Forest-based Rule Extraction; ISPBC: Intelligent System for Breast Cancer Prediction; K-NN: K-Nearest Neighbors; LR: Logistic Regression; MLP: Multi-Layer Perceptron; NB: Naïve Bayesian; PCA: Principal Component Analysis; PID: Patient Identification Phase; RAFN: Radial basis function network; REP Tree: Reduced Error Pruning Tree; RF: Random Forest; SHC: Stochastic Hill Climbing; SVM: Support Vector Machine; TP: True Positives; TRF: Tree Random Forest; United Kingdom; USA: United States of America; UCI: University of California Irvine; WHO: World Health Organization; WNBC: Weighted Naive Bayes Classifier; XGBoost: Extreme Gradient Boosting;
Acknowledgement
This research received no specific grant from any funding agency in the public, commercial, or not-for-profit sectors.
Declaration of conflict of interest
The authors declare that they have no known competing financial interests or personal relationships that could have appeared to influence the work reported in this paper.