
1 Introduction
The rapid increase in global waste generation poses a critical environmental challenge, placing immense strain on waste management systems worldwide [1]. Ineffective waste segregation contributes to environmental pollution, resource depletion, and public health risks, with far-reaching consequences for ecological stability and community well-being [2, 3].
Improper sorting amplifies these issues by increasing landfill usage, reducing recycling efficiency, and allowing recyclable materials to be lost in the waste stream. This mismanagement also leads to additional greenhouse gas emissions and accelerates ecosystem degradation [2, 4].
Traditional waste-sorting methods rely heavily on manual labor and are prone to human error, resulting in low sorting accuracy and operational inefficiencies [5, 6]. The physically demanding nature of manual sorting contributes to worker fatigue, thereby increasing the likelihood of misclassification and reducing productivity [7]. Inadequate segregation also facilitates the accumulation of mixed waste, creating breeding grounds for pests, vector-borne diseases, and urban zoonoses, particularly in underserved communities with limited waste management capacity [8]. Addressing these challenges requires more efficient technologies and strengthened policy interventions to safeguard both environmental and public health [9].
Advancements in machine learning have opened new avenues for transforming waste management, particularly through automated sorting systems capable of real-time image analysis and material classification [10]. By processing data from sensors and cameras, ML-driven systems reduce dependence on manual sorting, minimize human error, and substantially enhance overall sorting efficiency. Recent studies also highlight the strong performance of various deep learning models, including convolutional neural networks (CNNs), graph LSTMs, and hybrid architectures, in accurately identifying and categorizing waste materials. For example, [11] achieved 97.5% accuracy in classifying common waste categories, while [12] reported an F1-score of 0.931 using SqueezeNet embeddings with XGBoost. Traditional ML algorithms, including Random Forests, Naïve Bayes, Support Vector Machines (SVMs), and Multilayer Perceptrons, have also shown competitive performance in classifying biodegradable and non-biodegradable waste [13]. These developments underscore the potential of ML-driven systems to enhance sorting accuracy, improve recycling rates, and advance sustainable waste management strategies aligned with the principles of Reduce, Reuse, and Recycle [14].
ML-based approaches offer scalability, adaptability, and operational efficiency, making them valuable tools for optimizing waste management processes [15]. However, despite substantial progress, challenges remain regarding model reliability, dataset limitations, and the absence of standardized performance benchmarks [16, 17]. These gaps highlight the need for continued evaluation of machine learning techniques, particularly traditional algorithms that offer simplicity and computational efficiency, attributes that are especially important in resource-constrained environments.
This study addresses these gaps by evaluating the performance of two traditional machine learning algorithms: Naïve Bayes and Support Vector Machine (SVM), for solid waste image classification in automated sorting systems. A comparative assessment using accuracy, precision, recall, and F1-score is conducted to determine the strengths and limitations of each model across five waste categories. The study further examines their practical suitability in real-world scenarios where datasets may be modest in size and computational resources are limited, making deep learning approaches less feasible.
Although deep learning represents the current state of the art in automated waste classification, its implementation typically requires large annotated datasets, substantial computational resources, and lengthy training times [18]. These constraints may limit its applicability in small-scale or low-resource facilities. In contrast, traditional machine learning models remain accessible, efficient, and effective when working with limited datasets. While this study does not provide a direct empirical comparison with deep learning models, situating its findings within this broader technological landscape highlights the complementary role of traditional ML and underscores their value as practical, lightweight alternatives for waste classification systems.
Unlike prior studies that primarily rely on deep learning or evaluate classifiers solely with high-level performance metrics, this study offers a fine-grained comparative analysis of Naïve Bayes and SVMs using handcrafted features. It incorporates complete confusion matrices, misclassification analysis, and an examination of image-level characteristics such as reflection, transparency, and noise that influence classification outcomes. This level of diagnostic insight is rarely reported in traditional ML-based waste classification research, thereby strengthening the study's contribution to the field.
2 Literature Review
This literature review examines the performance of the Naïve Bayes and SVM algorithms in image classification, emphasizing their simplicity and efficiency. It highlights vital studies to evaluate its strengths, limitations, and potential improvements compared to other machine learning techniques.
2.1 Image Classification
Recent research continues to examine the effectiveness of traditional machine learning (ML) techniques for image classification, particularly in comparison with modern deep learning approaches. Traditional ML typically relies on handcrafted feature extraction methods such as Histogram of Oriented Gradients (HOG) and Scale-Invariant Feature Transform (SIFT), followed by classifiers
such as Support Vector Machines (SVMs) and Random Forests [19]. In the context of waste classification, traditional ML approaches have demonstrated scalability, adaptability, and operational efficiency, making them valuable tools for optimizing waste management processes [15]. For example, [11] achieved 97.5% accuracy in classifying common waste categories, while [12] reported an F1-score of 0.931 using SqueezeNet embeddings with XGBoost. Traditional ML algorithms, including Random Forests, Naïve Bayes, SVMs, and Multilayer Perceptrons, have also shown competitive performance in classifying biodegradable and non-biodegradable waste [13]. These models are valued for their ease of implementation and interpretability, although they tend to scale poorly when applied to large or highly complex datasets compared with deep learning techniques [20]. Similarly, [21] demonstrated that four traditional ML models achieved reasonable performance in yoga pose classification, particularly on smaller datasets.
Traditional ML has similarly shown potential in fields such as heart disease prediction and clinical decision support [22, 23]. Despite their computational efficiency, however, these methods often struggle to generalize across diverse or imbalanced datasets and face interpretability and ethical challenges in sensitive domains such as medicine [24]. These findings highlight the foundational yet limited role of traditional ML in image classification. Nevertheless, modern deep learning approaches continue to dominate the forefront of image processing research due to their superior scalability, automated feature extraction capabilities, and state-of-the-art performance across a wide range of applications [25].
2.2 Naïve Bayes
The Naïve Bayes algorithm, known for its simplicity and efficiency, is highly suitable for classifying images based on extracted features [26]. For instance, the Naïve Bayes classifier achieved 98.67% accuracy, with high precision, recall, and F1-score, and demonstrated reliable real-time performance with an average decision latency of 1.8 seconds when identifying hazardous substances in e-waste [29].
In another application, the Naïve Bayes classifier accurately categorized deformation levels as safe or excessive [26]. The model also achieved high accuracy in identifying apple varieties [27] while achieving reasonable recognition rates in handwritten digit classification [28].
These studies highlight the versatility of Naïve Bayes for image classification, particularly in tasks involving well-defined categories and straightforward feature extraction. Although the algorithm may not match the performance of deep
learning models on more complex datasets, its efficiency, interpretability, and strong results on simpler classification problems make it a valuable tool in many practical settings [30].
2.3 Support Vector Machine
Support Vector Machines (SVMs) are widely recognized for their robust performance on high-dimensional data and have been applied across diverse domains, including face recognition, disease diagnostics, text recognition, sentiment analysis, plant disease identification, and network intrusion detection [31]. Supported by a strong mathematical foundation for both classification and regression, SVM remains a reliable and well-established framework in image classification tasks [32]. For instance, [33] employed SVM to classify sugarcane leaf diseases, achieving 95% classification accuracy. Similarly, SVM classifiers have demonstrated high accuracy in face recognition and disease identification applications [31]. These studies highlight SVM's effectiveness in early disease detection, particularly its robustness and ability to handle data with high signalto-noise ratios [33, 34].
SVMs also exhibit strong generalization performance when trained on limited labeled data, making them suitable for data-constrained environments. However, they face scalability challenges with large datasets and rely heavily on manual feature extraction, limiting their ability to capture complex patterns compared to deep learning models such as CNNs [25]. Despite these limitations, SVMs remain relevant for applications that prioritize computational efficiency, interpretability, and stability, complementing modern deep learning approaches in specific use cases.
Overall, traditional machine learning methods, such as Naïve Bayes and SVM, remain effective and efficient for straightforward image classification tasks. While their limitations in modeling complex, high-dimensional data have led to the widespread adoption of deep learning models in modern applications, the simplicity and computational efficiency of traditional approaches ensure their continued relevance in well-defined scenarios. Together, these methods offer complementary strengths that advance image classification research.
3 Methods
3.1 Datasets
The 284 unique JPEG images were captured from the local governmentautomated solid waste sorting facility and categorized into five classes: cardboard, glass, metal, paper, and plastic. No personally identifiable information was involved, and the images contain only non-sensitive waste materials, so no ethical clearance is required.
The images are distributed across these categories: 31 cardboard images, 60 glass images, 57 metal images, 83 paper images, and 53 plastic images. Each image has a resolution of 512x384 pixels. The dataset includes images captured from different angles and highlighting various parts of the waste materials, providing diverse representations of each category to enhance variability and ensure robust model learning.
The dataset was partitioned into 80% training, 10% validation, and 10% test sets, using stratified sampling to preserve class proportion when working with relatively small datasets [35]. The validation set was used exclusively to monitor potential overfitting during training and was not involved in hyperparameter tuning, consistent with recommended experimental controls for fair and unbiased model assessment [36]. To further strengthen the reliability of the findings, 10 fold stratified cross-validation was performed on the training data, improving robustness in classifier evaluation under limited-sample conditions [37]. The independent 10% test set was kept entirely separate and used solely for the final evaluation to verify model performance. This overall methodology ensures that the reported results reflect both strong generalization capability and reliability despite the modest dataset size.
3.2 Preprocessing
This stage involves preprocessing images to ensure uniformity and consistency. Images are resized to a fixed resolution of 512x384 pixels to standardize dimensions across the dataset. The pixel values are normalized to the range 0-1 to reduce bias and improve computational efficiency. When color information is unnecessary, images may be converted to grayscale, simplifying the data and lowering complexity while preserving essential structural features. These preprocessing steps are crucial for preparing images for precise and efficient feature extraction.
Handcrafted feature extraction techniques were employed, focusing on manually engineered features such as edges, textures, and colors. Techniques such as Histogram of Oriented Gradients (HOG) emphasize edge orientations [38], while Color Histograms analyze color distributions across RGB or HSV channels. These methods are efficient and effective for smaller datasets or well-defined features but require domain expertise and may struggle with complex datasets compared to automated deep learning techniques [36]. In addition, extracted features are transformed into numerical feature vectors, each representing an image's distinct characteristics. These vectors serve as input to classification
models such as Naïve Bayes or Support Vector Machines (SVMs), enabling them to identify and learn patterns in the data [39]. Visualization tools were used to ensure the extracted features were meaningful for classification. In contrast, feature importance analysis identifies and removes redundant or irrelevant features to enhance efficiency. Once validated, these feature vectors are used to train machine learning classifiers such as SVMs and Naïve Bayes. Finally, the quality of the features is critical to the model's ability to distinguish between classes, making this step essential for achieving reliable, accurate classification results [36].
3.3 Classifiers
3.3.1 Naïve Bayes
Naïve Bayes is simple and suitable for classifying small datasets [26]. It is a popular classification learning model for its effectiveness across various machine learning domains [40]. Applying Bayes' theorem with a strong independence assumption between the features produces good results for textual data analysis. The advantage of using Naïve Bayes for a small amount of training data is that it performs well and works much better in complex situations [41]. Below is Naïve Bayes's general formula:
\[P(c|x) = \frac{P(x|c) P(c)}{P(x)}\] (1)
where P(c|x) is the posterior probability of class (target) given predictor (attribute), P(x|c) is the likelihood, which is the probability of the predictor given class, P(c) is the prior probability of class, and P(x) is the prior probability of the predictor.
3.3.2 Support Vector Machine
SVM aims to find a hyperplane in a high-dimensional space to separate data points of different classes. The key objective is to maximize the margin, which is the distance between the hyperplane and the nearest data points of each class. The equation of a hyperplane is given by:
\[f(x) = w * x + b \tag{2}\] where w is the weight vector, x is the input feature vector, and b is the bias term. For non-linearly separable data, SVM uses a kernel trick to map features into a higher-dimensional space where a hyperplane can separate the classes [31].
3.3.3 Performance Evaluation
These performance evaluation metrics are essential for assessing the effectiveness of an image classification model. Accuracy measures the overall correctness by calculating the ratio of correctly classified images to the total number of images. At the same time, recall evaluates the ability to identify all relevant instances. Precision is the proportion of correctly predicted positive labels among all predicted positives. The F1-score, a harmonic mean of precision and recall, balances these two metrics, making them useful when they are equally important [37].
\[Accuracy = \frac{TN + TP}{TN + FP + TP + FN} \tag{3}\]
\[Recall = \frac{TP}{TP + FN} \tag{4}\]
\[Precision = \frac{TP}{TP + FP} \tag{5}\]
\[F1 - Score = \frac{2*Precision*Recall}{Precision+Recall}\] (6)
where True Positives (TP) are the number of samples correctly predicted as "positive," False Positives (FP) are the number of samples wrongly predicted as "positive," True Negatives (TN) are the number of samples correctly predicted as "negative," and False Negatives (FN) is the number of samples wrongly predicted as "negative." [24]. Additionally, a confusion matrix provides a detailed summary of true positives, true negatives, false positives, and false negatives, offering insights into classification errors for each category
3.4 Hyperparameter Settings
To ensure reproducibility, the study reports the specific hyperparameters used for both feature extraction and model training. Histogram of Oriented Gradients (HOG) features were computed using 9 orientation bins, a cell size of 8×8 pixels, and 2×2 cells per block, with L2-Hys normalization, following the standard formulation shown to be effective for extracting edge and gradient information. Color information was captured using HSV color histograms with 32 bins per channel and L1 normalization, as the HSV color space is robust to lighting variation and widely used in image analysis [38]. For classification, a Support Vector Machine (SVM) with a Radial Basis Function (RBF) kernel was implemented using C = 1.0, gamma = scale, and a one-vs-one decision strategy, consistent with established recommendations for handling nonlinear and highdimensional feature spaces [39]. Gaussian Naïve Bayes was also applied with a variance smoothing value of 1e-9, reflecting its minimal tuning requirements and suitability for small datasets [24].
4 Results and Discussions
The experiment used a dataset of 284 JPEG images of solid waste materials categorized into cardboard (31), glass (60), metal (57), paper (83), and plastic (53). Each 512×384 image was captured from various angles to ensure visual variability. The dataset was split into 80% for training (227 images), 10% for testing (28 images), and 10% for validation (29 images).
Preprocessing steps included resizing all images to uniform dimensions and normalizing pixel values to a 0–1 range. Feature extraction was performed using Histograms of Oriented Gradients (HOG) to capture edge and shape information, and Color Histograms (RGB/HSV) to represent color distributions, producing numerical feature vectors for model input. Two machine learning algorithms, such as Naïve Bayes and Support Vector Machines (SVMs), were then applied for classification, and model performance was assessed using standard evaluation metrics.
Although accuracy, precision, recall, and F1-score provide practical insights into model performance, formal statistical validation would offer more substantial evidence that the performance differences between Naïve Bayes and SVM are statistically meaningful rather than due to sampling variability. Tests such as McNemar's test for paired classification errors or paired t-tests on F1-scores across cross-validation folds could be used to assess the consistency of these differences. However, the relatively small dataset size and class imbalance in this study may limit the statistical power and reliability of such tests.
Figure 1 presents the confusion matrix heatmaps for both Naïve Bayes and Support Vector Machine (SVM), providing an initial visual overview of classification performance across the five solid waste categories. To complement these visualizations, Tables 1 and 2 present the complete confusion matrices for the two models, including the raw counts of true positives, false positives, false negatives, and true negatives.
These detailed numerical summaries enable a more comprehensive assessment of model behavior, particularly for less frequent classes, where percentage-based metrics may mask misclassifications.
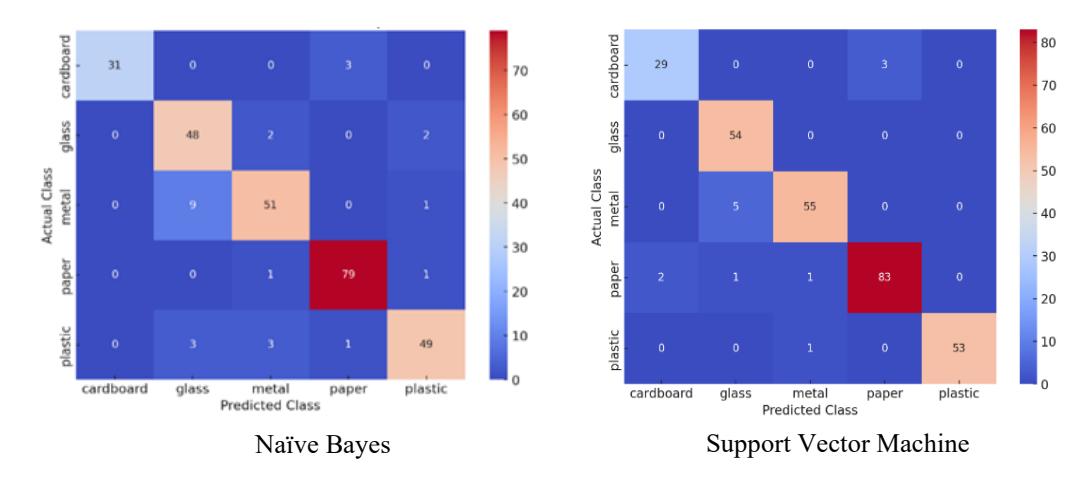
Figure 1 Confusion matrix heatmaps for Naïve Bayes and SVM showing perclass classification performance.
Table 1 Confusion Matrix for Naïve Bayes (Raw Counts).
| Class | Cardboard | Glass | Metal | Paper | Plastic |
|---|---|---|---|---|---|
| Cardboard (31) | 31 | 0 | 0 | 0 | 0 |
| Glass (60) | 0 | 48 | 7 | 0 | 5 |
| Metal (57) | 0 | 3 | 51 | 0 | 3 |
| Paper (83) | 0 | 0 | 0 | 79 | 4 |
| Plastic (53) | 0 | 2 | 2 | 0 | 49 |
Table 2 Confusion Matrix for SVM (Raw Counts)
| Class | Cardboard Glass Metal Paper Plastic | ||||
|---|---|---|---|---|---|
| Cardboard (31) | 29 | 1 | 1 | 0 | 0 |
| Glass (60) | 0 | 54 | 3 | 0 | 3 |
| Metal (57) | 0 | 1 | 55 | 0 | 1 |
| Paper (83) | 0 | 0 | 0 | 83 | 0 |
| Plastic (53) | 0 | 0 | 0 | 0 | 53 |
The Naïve Bayes classifier achieved strong performance on categories with distinct, easily separable features, correctly identifying all cardboard samples (31/31) and most paper images (79/83). However, performance declined noticeably for classes with overlapping visual characteristics, such as glass, metal, and plastic. For example, glass was correctly classified in 48 of 60 cases, with notable confusion between glass and plastic, while metal showed a similar pattern of misclassification (51/57 correct). These results reflect the limitations of Naïve Bayes in handling correlated visual features, as its independence assumption restricts its ability to differentiate between classes that share similar textures, shapes, or color attributes.
In contrast, the SVM model demonstrated superior classification performance across all categories. It correctly identified 29 out of 31 cardboard samples, 54 out of 60 glass samples, and achieved near-perfect performance in the metal category (55/57). Most significantly, SVM achieved perfect classification accuracy for both paper (83/83) and plastic (53/53). These results highlight SVM's ability to construct non-linear decision boundaries that effectively separate classes even when feature spaces overlap, making it highly suitable for complex image classification tasks.
Hence, Naïve Bayes is computationally efficient and suitable for simpler tasks. The SVM's robustness and precision make it the preferred model for datasets with overlapping or complex features, as well as for image classification tasks involving solid waste materials.
Table 3 demonstrates the performance of Naïve Bayes and SVM in an image classification task involving solid waste materials.
Model Accuracy F1-Score Precision Recall Naïve Bayes 98.90 0.908 0.911 0.908
Support Vector Machine 99.80 0.965 0.966 0.965
Table 3 Performance of classification models.
Naïve Bayes achieved an accuracy of 98.90%, an F1-score of 0.908, and a precision and recall of 0.911, highlighting its effectiveness for straightforward classification tasks. However, because of its feature-independence assumption, its performance was limited by overlapping visual features, such as similar textures or colors between glass, metal, and plastic. On the other hand, SVM outperformed Naïve Bayes, achieving 99.80% accuracy, 0.965 F1-score, 0.966 precision, and 0.965 recall.
SVM's ability to construct optimal decision boundaries enabled it to handle complex and overlapping features more effectively, leading to more precise and robust classifications. Its superior performance makes it better suited for image classification tasks where features like edges, textures, and color distributions are intricate and interdependent. While Naïve Bayes is computationally efficient and suitable for simpler datasets, SVM's robustness and precision make it the preferred choice for this image classification task, particularly in applications
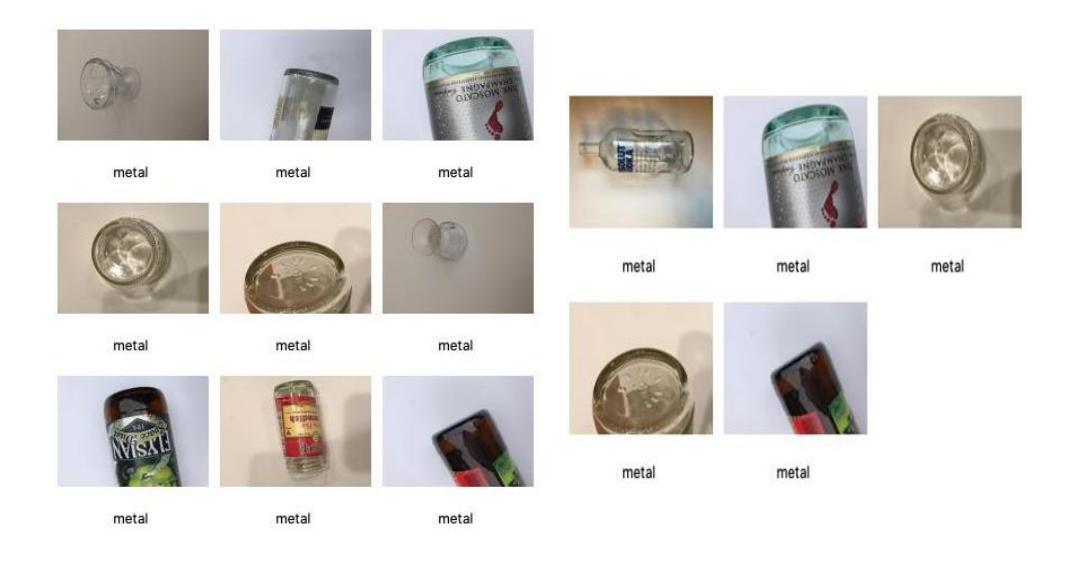
such as automated waste sorting, where accuracy is critical. Figure 2 below shows the misclassified solid waste items identified by the automated sorting system.
Naïve Bayes Support Vector Machine
Figure 2 Misclassified solid waste items by the classification models.
The misclassified samples reveal important insights into the challenges posed by the visual characteristics of certain waste materials and the limitations of the handcrafted features used in this study. Classes such as glass, metal, and plastic frequently exhibit overlapping visual properties, including high reflectivity, transparency, smooth surfaces, and varying levels of glare, which complicate classification. For instance, transparent or semi-transparent glass items often allow background colors or textures to affect the object's appearance.
At the same time, reflective metal surfaces may produce sharp highlights or uneven brightness patterns. These artifacts can distort gradient information, causing HOG descriptors to capture reflections rather than actual object boundaries. Similarly, plastics commonly share color tones with both metal and glass, and their appearance can vary due to surface shine, scratches, or environmental noise such as shadows or uneven lighting. Because Color Histograms summarize global color distributions without accounting for spatial structure, such distortions make plastic items appear nearly indistinguishable from glass or metal in feature space.
These underlying image characteristics reduced the discriminative capacity of the handcrafted features, thereby explaining the higher misclassification rates observed in the Naïve Bayes model. As a classifier that assumes independence among features, Naïve Bayes is particularly sensitive to ambiguous or noisy representations, which contributed to its difficulty in separating visually similar classes.
SVM achieved better performance by constructing nonlinear decision boundaries, yet the expressive limitations of the feature vectors still constrained its accuracy. Misclassifications in SVMs tended to occur in borderline cases, where reflections, transparency artifacts, or noise obscured subtle texture and shape cues that handcrafted methods cannot capture. This deeper analysis underscores a fundamental limitation of traditional feature engineering in imagebased waste classification: the inability to robustly encode fine-grained, contextdependent visual cues that are essential for distinguishing among highly similar materials.
These findings highlight the need for more powerful, adaptive feature extraction methods, such as learned deep features, hybrid descriptors, or attention-based representations, to better model complex image characteristics and improve classification accuracy in real-world waste-sorting environments.
In general, although the results demonstrate strong performance, the study is limited by its modest dataset size and reliance on manually engineered features, which may not generalize well to highly varied waste environments. Furthermore, the analysis includes only two traditional classifiers, which restricts the breadth of model comparison.
5 Conclusions
Naïve Bayes and SVM both demonstrated strong performance in classifying solid waste materials; however, SVM consistently outperformed Naïve Bayes across all evaluation metrics. Naïve Bayes achieved 98.90% accuracy and an F1-score of 0.908, indicating computational efficiency and suitability for simpler classification tasks. Nonetheless, it struggled with categories that shared overlapping visual characteristics, particularly glass, metal, and plastic primarily due to its assumption of feature independence. These classes often exhibit reflectivity, transparency, smooth surfaces, and color similarity, which handcrafted features such as HOG and Color Histograms are not well equipped to capture. As a result, Naïve Bayes frequently misclassified samples where reflections, glare, or noise obscured distinctive edges or color patterns.
In contrast, SVM achieved 99.80% accuracy and an F1-score of 0.965, demonstrating greater robustness in handling complex and overlapping features. Its ability to learn nonlinear decision boundaries enabled it to better differentiate between visually similar objects, leading to fewer misclassifications. However, even SVM was limited by the expressiveness of handcrafted feature vectors; borderline errors persisted when subtle visual cues, such as micro-texture, surface shine, or partial transparency, were poorly represented in the extracted features.
Overall, while Naïve Bayes performs well on simpler or more distinct classes, SVM's superior precision and recall make it better suited to complex classification tasks involving nuanced visual differences.
Future research should incorporate larger datasets, varied imaging conditions, and direct comparisons with deep learning models to assess the scalability of the findings better. Likewise, future studies may explore hybrid or deep learning– based feature-extraction methods that can capture more fine-grained visual characteristics, thereby improving classification performance in complex, realworld waste-sorting environments.
Acknowledgement
This research received no specific grant from any funding agency in the public, commercial, or not-for-profit sectors.