

INTRODUCTION
Presently used methods for the photometric determination of zinc in the microgram range are either complex (dithizone) (4, 15, 21), or, while simple, subject to interference by many foreign ions (zincon) (3, 17, 20).
A number of other methods have been proposed, but none has the sensitivity of either the commonly used dithizone method or the zincon method. The more important among these are those using oxine (21, p. 626), urobilin (26), resorcinol (25, 14, p.620) and, more recently, 1.10-phenanthroline (10) and \(\alpha, \beta, \gamma, \delta\) tetraphenylporphine (1).
The discovery that various bivalent metals react with thiocyanate or halide ions and various dyes, among them methylene blue (MB), giving differently colored complexes (11) was used as the basis of a new photometric determination of zinc, in which the zinc is reacted with thiocyanate and MB, thus reducing the amount of MB, the resulting decrease in absorbance of MB corresponding to the amount of zinc present. To develop this method to its fullest possibilities, the factors influencing the absorbance of MB and necessary details on the complex itself were investigated, among these:
- 1. The influence of pH and electrolytes on the absorption spectrum of MB.
- 2. The absorption spectrum of MB in organic solvents.
- 3. The influence of dilution and adherence to Beer's law.
- 4. The reducing influence of thiocyanate on MB.
- 5. The composition, solubility product and absorption spectrum of the complex.
- 6. The kinetics of the reaction.
From the results the most advantageous condition for the photometric determination of zinc can be found.
EXPERIMENTAL DETAILS
Instrumentation. Measurements were made with the Beckman DU spectro-photometer, the Leeds and Northrup potentiometer type K-2, in which the regular galvanometer was replaced by a mirror type galvanometer, Fisher No. 11-506-27, M and with a Beckman pH meter model G, using the regular glass electrode (N.T.L.N. number 290), standardized against a saturated solution of potassium hydrogen tartrate (24, p.868).
Reagents. When available, Reagent Grade Chemicals were used, except when other grades were purposely taken. Buffers were prepared according to (8), except the oxalate buffers which were prepared according to (7).
Methylene blue. The purity of the three available samples (Merck) was determined volumetrically with titanous chloride (24, p.317) in a carbon dioxyde atmosphere and concentrated stock solutions shown in Table I were prepared.
TABLE I MB samples and stock solutions.
| Code | Sample (Merck) | Purity as MB.HCl | Conc. mg/1 | stock solution \[F \times 10^2\] |
|---|---|---|---|---|
| A | B extra | 70.3% | 75.2 | 1.65 |
| B | Redox | 70.5% | 98.2 | 1.97 |
| C | Konzentriert | 74.9% | — | — |
These concentrated stock solution were diluted as required.
Hydrochloric acid. "C.P." acid (sp.gr. 1.20) was redistilled from an all Pyrex glass apparatus with granulated lead as boiling chips and standardized by comparison with standard oxalic acid through sodium hydroxyde titrations and diluted as required.
Sodium lsrtrate and sodium h,,-drogen tartrate, Prepared in solution from calculated anounts of tartaric acid and sodium carbonate. ,Soird sodium hydrogen tartrate was prepared by mixing saturated solutions of "C.P." tartaric acid and "C.P." sodium tartrate, crystallizing, washing and drying the uystals at 50"C.
Sodium thioc.vanate. Untill it became available, sodium thioyanate (A) was prepared by mixing hot concentrated solutions of sodium nitrate and potassium thiocyanate in equimolar amounts. At 5"C the potassium nitrate crystallized out and u'as filtered off. The rernaining potassium in solution was precipitated as the hydrogen tartrate with sodium hydrogen tartrate.
When it became available, sodium thiocyanate N.F. (B) was used.
The thiocyanate concentration was determined by titration rvith standard mercuric nitrate solution, using a ferric chloride indicator (9, p. 575).
Zinc solution A stock solution was prepared from Reagent Grade zinc sulfate and the concentration (1.001 F) determined gravimetrically as zinc pyrophosphate (9). This was diluted as required.
Redistilled v'ater. L'dboratory distilled rvater was redistilled from an all Pyrex glass apparatus, with addition of potassium pernlangirnate and boiling chips of manganese metal.
I. THE INFLUENCE OF pH AND ELECTROLYTES ON THE ABSORPTION SPECTRUM OF METHYLENE BLUE
1. Introiut t iott
Although the absorption spectrum of MB has already been determined (12), no details concerning the relation betrveen spectrum and pH were given.
To investigate this and the effe;t ol pH more fully, absorbance measurenents over the range of 200- 1000 mpr, were made using 1.65 X l0-5 F MB (A) in 4 F and I F hydrochloric acid and in an acetate buffer of pH 4.6.
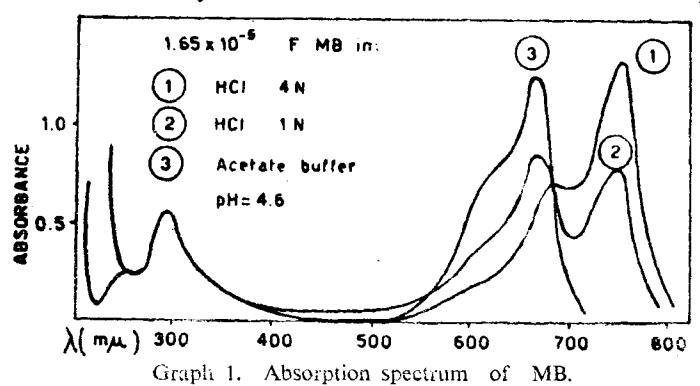
The resulting spectra in Graph I show no peaks beyond 800 mgt. However, between 200 and 800 mp three pronounced maxima show in 1.0 F acid at 745,666 and290 mp.. The peak at 290 mpr appears to be insensitive to pH but the absorbance at the peak at 666 mp decreases from 1.2 in a buffer of pH 4.6 to 0.85 in 1.0 F acid and the peak at745 m1t" is reduced almost to zero at a pH of 4.6 from an absorbance of 1.3 in 4 F acid. Also, at pH 4.6 a shoulder is noticed between 610 and 630 m1.r, which is barely discernable in 4 F acid. The absorbance increases rapidly below 230 mp, (250 mp in solutions of higher pH).
2. The influence of the pH on the absorption spectrurn.
As the peak at 666 mp and the shoulder at 625 my, appeared to be the most useful, the spectral region between 600 and 800 mp was investigated rncre thoroughly, using solutions of various acidities. The results compiled in
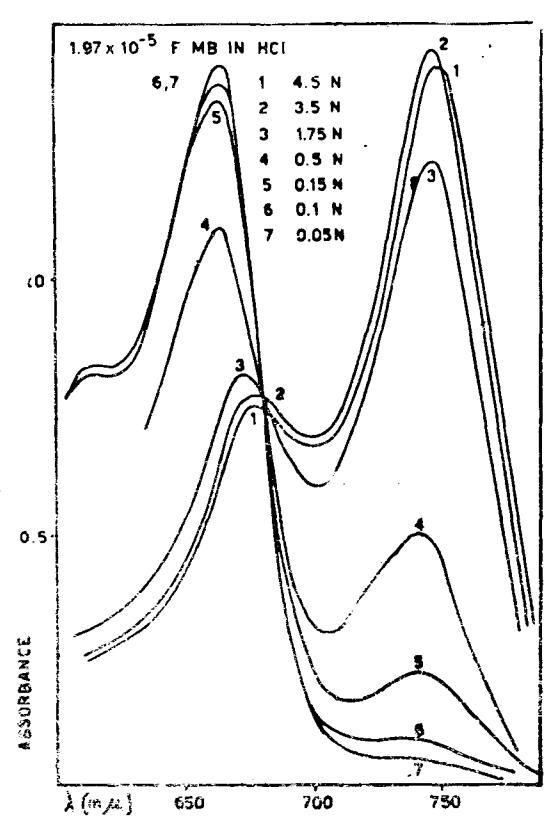
Grcph 2. Absoiption spectrum of MB in HCl,
Craph 2 show that MB is a pH indicator, its base form having arl absorbance peak at 666 mpr. and its acid form at 745 m1"r,. It appears to be entirely in the base form at pH above 1.3 and entirely in the acid form at pH below -0.5.
The peak at 666 mg. not only decreases with increasing acid content, but also shifts to the longer wavelengths. The shoulder at 625 mp seems to be relatcd to the peak at 666 my. insofar as it appears to decrease with the latter, this effect being hardly noticable at low acidities, but increasing rvith increasing acidity.
Also were determined absorption spectra of \(1.97 \times 10^{-5}\) F MB (B) in solutions of sodium hydroxide of various concentrations. In these solutions at first the color of MB disappeared, gradually followed by a violet color with an absorption peak at 590 m\(\mu\) which reached its greatest intensity after about 20 hours, after which it decreased again as shown in Graph 3.
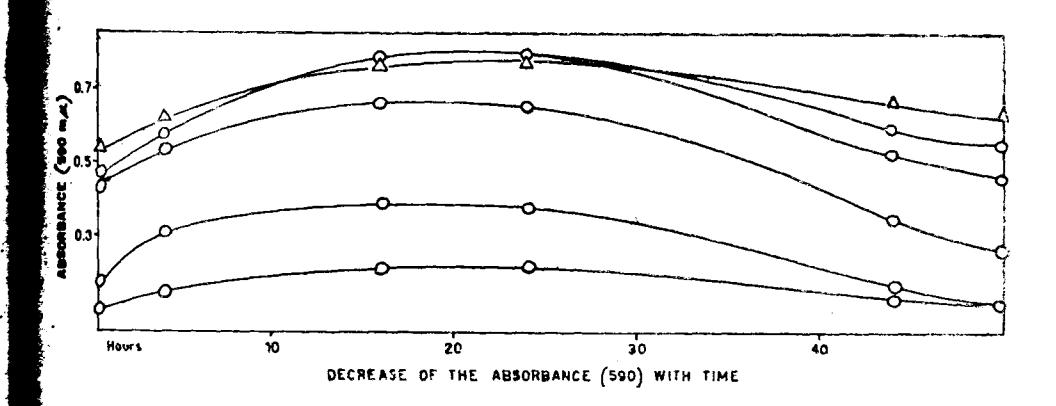
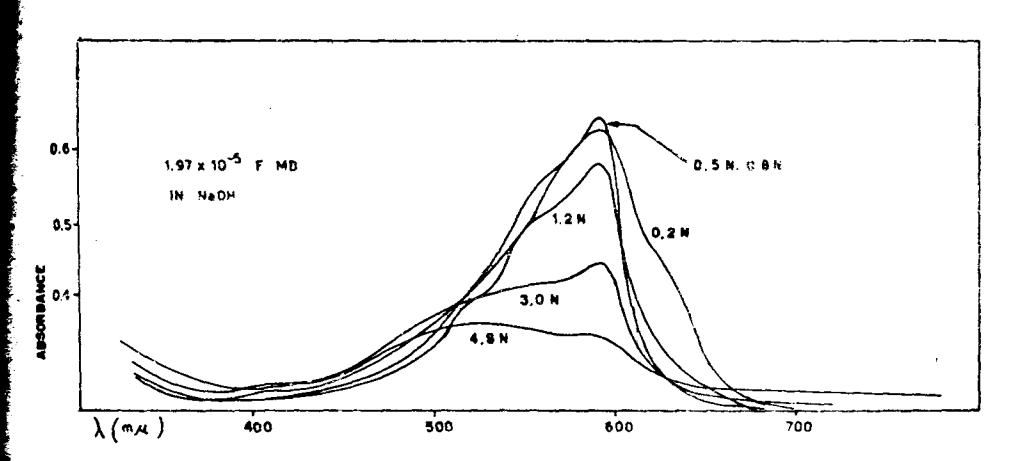
Graph 3. Absorption spectrum of MB in NaOH.
3. Calculation of the \(pK_{Ind}\)
Graph 2 shows the MB to be entirely in its acid form at acidities above 3.5 F in hydrochloric acid and in both its acid and base form below this acidity.
Assuming that MB reacts with acids according to the equation: \(MB + nH^+ \rightleftharpoons MB^{n+}\), where MB is the base form and \(MB^{n+}\) the acid form, then: \[K_{Ind} = \frac{C_{MB} - C_{H^+}^n}{C_{MB}^{n+}} \text{ and thus: } n \text{ pH} = \log \frac{C_{MB}}{C_{MB}^{n+}} + p K_{Ind}\]
Assuming that with these small concentrations Beer's law is obeyed (or, that at least deviations may be neglected), this ratio \(C_{\rm MB}/C_{\rm MB^{n+}}\) equals the ratio of absorbancies, \(\frac{A-A'}{A}\), where A is the absorbance at \(C_{H^+}=3.5\) and A' is the absorbance at that particular acidity.
Results calculated for two samples of MB are given in Table II, where also is given \[\log \frac{A - A'}{A} = Q\].
TABLE II.
Relative amounts of the acid and base form, expressed as
\[Q = log \frac{C_{MB}}{C_{MB}^{n+}} = log \frac{A - A'}{A}\], at various acidities.
| 1.0 | \(1.65 \times 10^{-5} \text{ F MB (A)}\) | \(1.97 \times 10^{-5} \text{ F MB (B)}\) | |||||||
|---|---|---|---|---|---|---|---|---|---|
| CH+ | pCH | A | Q | CH+ | \(p_CH\) | A | Q | ||
| 5.20 | -0.72 | 1.237 | 4.50 | -0.65 | 1.450 | ||||
| 3.70 | -0.57 | 1.223 | 2.50 | -0.40 | 1.250 | -1.13 | |||
| 2.23 | -0.35 | 1.116 | -0.965 | 1.75 | -0.24 | 1.350 | -0.80 | ||
| 1.04 | -0.02 | 0.830 | -0.308 | 1.00 | 0.00 | 0.925 | -0.25 | ||
| 0.74 | ÷0.13 | 0.622 | -0.005 | 0.50 | 0.30 | 0.510 | ÷0.26 | ||
| 0.30 | +0.53 | 0.250 | +0.612 | 0.25 | 0.60 | 0.225 | +0.74 | ||
Substitution of the values given in Table II in the equation:
\[n pH = Q + pK_{Ind}\]
shows that n = 2 and \(pK_{Ind} = 0.28\).
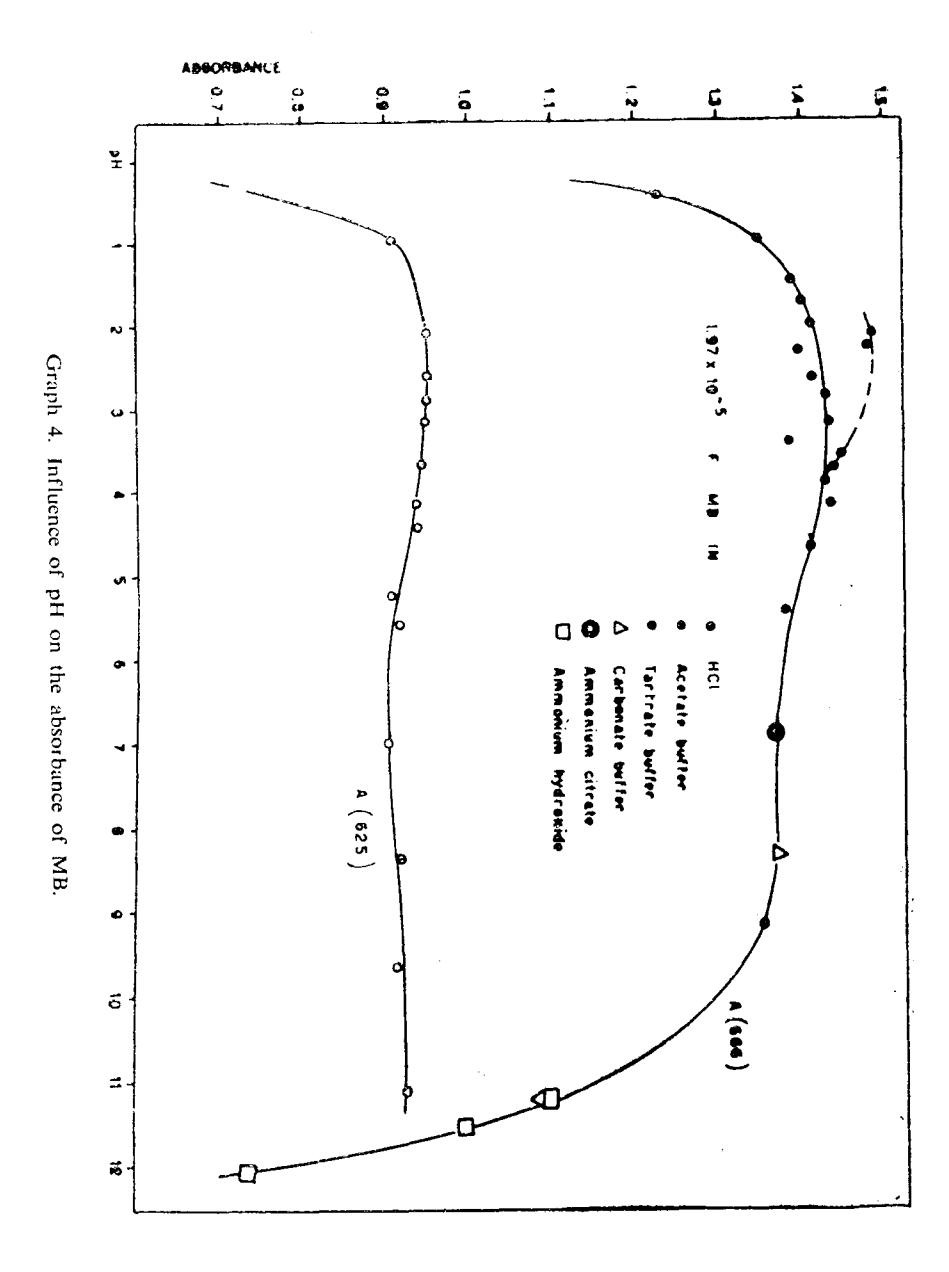
The absorbancies at the two wavelengths 666 mu and 625 mu, being the most useful ones, were investigated over the whole pH range. The resulting pH-absorbance curves at 666 mu and 625 mu shown in Graph 4 have the same general shape, each showing a maximum between pH 3.0 and 3.5, a slow decrease between pH 4 and 6, a level part between pH 6 and 9 and a sharp decrease below pH 1.5 and above pH 9.
Tartaric acid also influences the absorbance, in concentrated solutions it markedly increases the absorbance at 666 m\(\mu\), although the absorbance at 625 m\(\mu\) decreases, as shown in Graph 5.
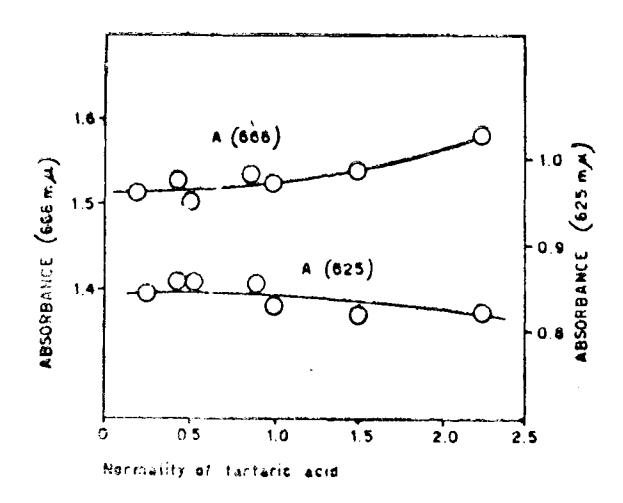
Graph 5. Influence of tartaric acid on the absorbance of MB.
Between a 0.2 — 1 F tartaric acid concentration the change in absorbance is negligibly small.
4. Influence of foreign electrolytes
The salt errors caused by KCl and KNO<sub>3</sub> have been investigated by G.N. Lewis (12) who reported a decrease of 5% in absorbance at \(666~\text{m}\mu\) in 1 F salt solutions. To obtain more detailed information, the absorbancies at \(666~\text{m}\mu\) of solutions of \(1.97\times10^{-5}~\text{F}\) MB (B) in a 0.1 F hydrochloric acid and in a 1F acetate buffer, pH 4.7, with varying amounts of foreign ions, were measured. Results in Table III show that the salt error is much pronounced in 0.1 F HCl.
TABLE III Salt error of a 1.97 × 10<sup>-5</sup> F solution of MB (B), expressed as a difference in absorbance at 666 mu, \(\triangle A\), in:
| Ī | 0.1 | FH | Cl | a 1 F acetate buffer, pH 4.7 | ||||||
|---|---|---|---|---|---|---|---|---|---|---|
| Fore electr | μ | A666 | ΔA | 1 | eign rolyte | μ | A666 | ΔA | ||
| None | | | 0.1 | 1.365 | None | 1.0 | 1.388 | ||||
| NaCl | 0.2 F | 0.3 | 1.261 | -0.104 | NaCl | 0.1 F | 1.1 | 1.378 | -0.010 | |
| 0.5 F | 0.6 | 1.231 | -0.231 | 0.3 F | 1.3 | 1.372 | -0.016 | |||
| KNO3 | 0.2 F | 0.3 | 1.293 | -0.072 | 0.5 F | 1.5 | 1.376 | -0.012 | ||
| 0.5 F | 0.6 | 1.167 | -0.198 | |||||||
| NH₄Cl | 0.4 F | 0.5 | 1.225 | -0.140 | ||||||
| 1.2 F | 1.3 | 1.110 | -0.255 | |||||||
TABLE IV
Salt error in tartrate buffers, pH = 2.8, with varying concentrations of MB and total tartrate content. Expressed as \(\triangle A\) at 666 and 625 m\(\mu\).
| MB | tartrate | NaCl | A(666) | △A(666) | A(625) | △A(625) |
|---|---|---|---|---|---|---|
| | | | | | | ||||
| \(1.65 \times 10^{-5} \text{ F}\) | 0.37 F | 0.0 F | 1.209 | 0.708 | | | | |
| ,, | 0.1 F | 1.207 | -0.002 | 0.706 | 0.002 | |
| ,, | ,, | 0.2 F | 1.201 | -0.008 | 0.699 | -0.009 |
| ,, | ,, | 0.4 F | 1.155 | -0.054 | 0.695 | -0.014 |
| ,, | ,, | 0.8 F | 1.085 | 0.124 | 0.124 | -0.032 |
| ,, | 0.22 F | 0.0 F | 1.184 | 0.680 | ||
| | -,, | | ,, | 0.1 F | 1.179 | -0.005 | 0.678 | -0.002 |
| ,, | ,, | 0.2 F | 1.168 | -0.016 | 0.680 | -0.000 |
| ,, | ,, | 0.4 F | 1.142 | -0.037 | 0.688 | +0.008 |
| ,, | ,, | 0.8 F | 1.055 | -0.129 | 0.695 | *0.017 |
| 6.6×10⁻² F | 0.37 F | 0.0 F | 0.511 | 0.274 | ||
| ,, | ,, | 0.1 F | 0.506 | -0.005 | 0.275 | +0.002 |
| ,, | —,,— | 0.2 F | 0.506 | -0.005 | 0.275 | +0.002 |
| ,, | ,, | 0.4 F | 0.496 | -0.015 | 0.268 | -0.007 |
| ,, | 0.8 F | 0.493 | -0.018 | 0.273 | -0.002 | |
| 0.22 F | 0.0 F | 0.505 | 0.276 | |||
| ,, | ,, | 0.1 F | 0.505 | -0.000 | 0.276 | 0.000 |
| ,, | ,, | 0.2 F | 0.495 | 0.010 | 0.280 | +0.004 |
| ,, | 0.4 F | 0.495 | -0.010 | 0.280 | ÷0.004 | |
| ,, | 0.8 F | 0.492 | -0.013 | 0.288 | ÷0.012 | |
| 13.2×10⁻⁵ F | 0.37 F | 0.0 F | 0.967 | -0.967 | 0.553 | |
| —,, | ,, | 0.1 F | 0.693 | -0.004 | 0.550 | -0.003 |
| —,,— | ,, | 0.2 F | 0.959 | -0.008 | 0.565 | +0.012 |
| ,, | 0.4 F | 0.939 | -0.028 | 0.562 | +0.009 | |
| ,, | ,, | 0.8 F | 0.298 | -0.039 | 0.562 | +0.009 |
| 0.22 F | 0.0 F | 0.963 | 0.567 | |||
| ,, | 0.1 F | 0.959 | -0.004 | 0.567 | 0.000 | |
| ,, | ,, | 0.2 F | 0.943 | -0.020 | 0.569 | +0.002 |
| ,, | ,, | 0.4 F | 0.932 | -0.030 | 0.553 | -0.014 |
| ,, | ,, | 0.8 F | 0.932 | -0.030 | 0.553 | -0.014 |
than in the acetate buffer, in which it is practically negligeble. This may be due to the pH, but also to the fact that the initial \(\mu\) in the acetate buffer is much higher, thus the small variations caused by the foreign electrolyte have hardly any effect.
Also was investigated the influence of varying the amounts of MB, buffer and electrolyte content, using a \(1.65 \times 10^{-5}\) F solution of MB (B) in tartrate buffers at pH 2.8, giving the results in Table IV.
The influence of different electrolytes was investigated, using a \(1.65 \times 10^{-5}\) F solution of MB (B) and an oxalate buffer, composed of 0.15 F oxalic acid, 0.1 F sodium hydrogen oxalate and 0.5 F tartaric acid; results are compiled in Table V.
These tables show, that the salt error increases with the ionic strength \(\mu\), increases with MB content, decreases with tartrate content and that with these buffers the salt error caused by 0.2 F sodium chloride may be neglected.
TABLE V Salt error, expressed as the difference in absorbance, \(\triangle A\), at 666 m\(\mu\), with varying electrolytes and \(1.65 \times 10^{-5}\) F MB (B) in an oxalate blffer, pH 1.5. Absorbance without foreign electrolyte = 1.073.
| F | \(KNO_3\) | k | (Cl | NaCl | |||
|---|---|---|---|---|---|---|---|
| for. electr. | A | ∆A | A | \(\triangle \mathbf{A}\) | A | ∆A | |
| 0.1 | 1.064 | -0.009 | 1.080 | +0.007 | 1.081 | +0.008 | |
| 0.2 | 1.067 | -0.006 | 1.070 | -0.001 | 1.082 | +0.009 | |
| 0.3 | 1.077 | +0.003 | 1.065 | -0.005 | 1.074 | +0.001 | |
| 0.4 | 1.053 | -0.020 | 1.058 | -0.018 | 1.069 | -0.004 | |
| 0.5 | 1.043 | -0.030 | 1.049 | -0.025 | 1.051 | -0.022 | |
5. Conclusion.
If MB is to be used in a photometric determination of zinc, conditions must be found where the absorbance of MB is as constant as possible.
From the foregoing it can be concluded that:
- the solution must be buffered, preferably between pH 3.0 and 3.5 or 6 and 9, but if necessary, the whole pH range 1.5 and 9 may be used, where the absorbance of MB varies only slightly with the pH.
- the final tartrate content should be at least 0.2 F.
- the amount of foreign electrolyte should be kept below an ionic strength of 0.2.
II. THE ABSORPTION SPECTRUM OF MB IN ORGANIC SOLVENTS.
1. Introduction
Lewis and co-workers (13) found that in solvents with low dielectric constant like glycerol and ethanol, MB is present as its monomer, the resulting high absorbance of which may well increase the sensitivity. In a zinc determination, an extraction procedure, free from reducing action of thiocyanate, salt errors and the influences of pH and MB concentration might be advantageous and consequently an incentive to investigate other solvents more extensively.
2. Solubility and extractability of MB and the complex
The solubility and extractability of both MB and the complex were determined in 0.1 F hydrochloric acid and in a buffer composed of 0.18 F tartaric acid and 0.18 F sodium hydrogen tartrate. Results compiled in Table VI show that the one promising solvent for the complex, methylsalicylate, unfortunately also extracts uncombined MB in the presence of thiocyanate, although not in its absence. Thus, as no solvents with the right properties were available, the extraction procedure was not feasible.
However, an organic solvent might still be useful; a miscible solvent might increase the sensitivity; an inmiscible one might be used to advantage to extract the MB remaining after separation of the complex, thus increasing the sensitivity.
3. Absorption spectrum in miscible solvents
The spectrum of MB in several alcohols and in acetone were investigated with the results shown in Graph 6.
Maximum absorbance occured at a lower wavelength in the organic solvent and the shoulder at 625 mµ had almost disappeared. To know the influence of water, several solutions, each \(1.65 \times 10^{-5}\) F in MB (A) were prepared in varying mixtures of water and organic solvents and the absorbance between 650 mµ and 700 mµ measured. The results compiled in Table VII show that the peak at 666 mµ increases with decreasing water content and at the same time shifts to the shorter wavelength, but the increase is only slight, amounting to a few % in a mixture containing 50% organic solvent.
Table VI. Behaviour of MB and the complex in various organic solvents.
| Solvent | MB (B), 7.52 tartr. buf. pH 2.8 | 2 mg/liter in 0.1 F HCl | Complex equivalent to tartrate buffer, pH 2.8 | 7.52 mg MB per liter in 0.1 F HCl | |
|---|---|---|---|---|---|
| Miscible | Acetone Ethanol Methanol Allylalcohol n-Propylalcohol Glycoi Ethylene glycol Diethylene glycol | bl. soln | bl. soln. | decompd. bl. soln. purpl. ppt. light nl. soln. decompd. bl. soln purpl (ish) ppt. light blue soln + purpl. ppt. white ppt. | decompd. bl. soln. -,- purpl. ppt. colorless soln. brownish soln. decompd. bl. soln. purplish ppt. light purpl. ppt,- |
| Immiscible | Diethylether Di isopropylether Petroleum ether 60 Benzene Toluene Xylene Chioroform Carbontetrachloride Ethylenebromide Trichloro ethylene Carbondisulfide n-Amylalcohol Amylenehydrate n-Butylalcohol Benzylalcohol Propionic acid Nitrobenzene Benzaldehyde Amylacetate Ethylacetate Methylsalicytate Paraldehyde | partly extd. largely extd. compl. extd. decol not extd. | extd. | plate out, partly decompd. compl. decompd. extd. | compl. decompd. decol. —,,— extd. —,,— —,,— plate out, partly decompd |
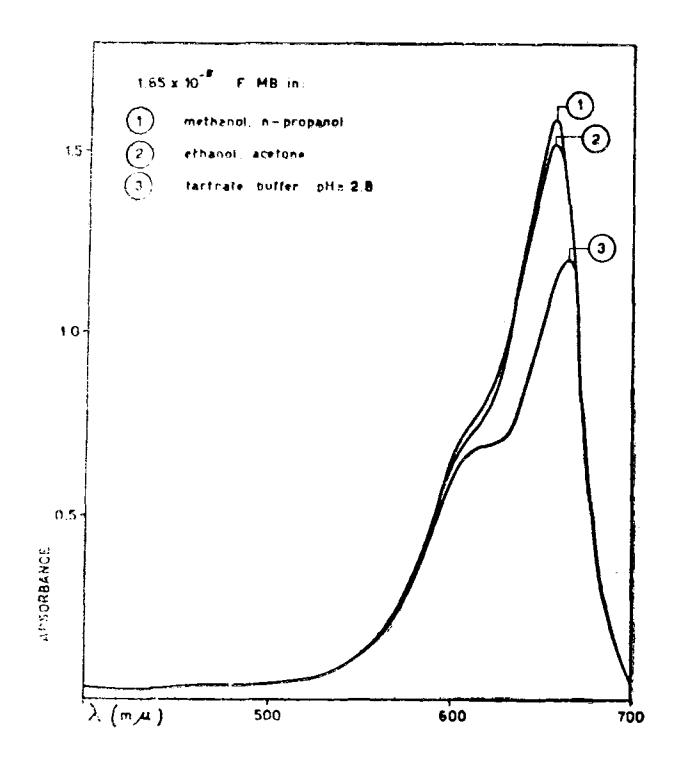
Graph 6. Absorption spectrum of MB in organic solvents.
4. Absorption spectrum in inmiscible solvents
Table VI shows that MB is extracted by nitrobenzene, propionic acid, benzylalcohol and benzaldehyde, the latter two at the same time gradually decolorizing the MB, thus being useless. The absorption spectrum (solvent as blank) was practically the same as for miscible solvents, as shown in the same Graph 6.
Benzylalcohol and benzaldehyde reduced MB and propionic acid is lighter than water, so only nitrobenzene was investigated. Further, as this showed the greatest possibility as an extracting solvent, the distribution coefficient of MB between nitrobenzene and water was determined.
Solutions of MB at various concentrations were prepared, each of which contained the same amount of MB, each of which contained the same amount of MB, by adding varying amounts water to 5.0 ml \(1.65 \times 10^{-5}\) F MB (A). These aqueous solutions were extracted with 5.0 ml nitrobenzene and the absorbance (666 m\(\mu\)) determined.
TABLE VII
Influence of water on the absorption spectra of 1.65×10<sup>-5</sup> F MB in organic solvents containing V ml organic solvent per 10 ml solution.
| A b | sorba | n c e | |||||
|---|---|---|---|---|---|---|---|
| λ(mμ) | V = 9 | V = 7 | V = 5 | V = 3 | V = 2 | V = 1 | |
| n-propenol | 700 | 0.073 | 0.076 | 0.085 | 0.092 | 0.118 | 0.122 |
| 675 | 0.796 | 0.900 | 0.983 | 1.076 | 1.116 | 1.126 | |
| 665 | 1.351 | 1.391 | 1.387 | 1.409 | 1.377 | 1.345 | |
| 660 | 1.538 | 1.524 | 1.467 | 1.420 | 1.366 | 1.282 | |
| 665 | 1.511 | 1.471 | 1.397 | 1.373 | 1.307 | 1.221 | |
| 650 | 1.408 | 1.399 | 1.270 | 1.244 | 1.193 | 1.123 | |
| acetone | 700 | 0.007 | 0.068 | 0.094 | 0.111 | 0.118 | 0.116 |
| 675 | 0.790 | 0.993 | 1.041 | 1.119 | 1.154 | 1.111 | |
| 6658 | 1.440 | 1.471 | 1.472 | 1.400 | 1.398 | 1.364 | |
| 860 | 1.553 | 1.539 | 1.498 | 1.442 | 1.405 | 1.346 | |
| 655 | 1.551 | 1.535 | 1.462 | 1.357 | 1.348 | 1.294 | |
| 650 | 1.440 | 1.409 | 1.330 | 1.277 | 1.235 | 1.190 | |
| ethanol | 700 | 0.060 | 0.071 | 0.090 | 0.111 | 0.118 | 0.110 |
| 675 | 0.796 | 0.903 | 1.036 | 1.130 | 1.112 | 0.983 | |
| 665 | 1.275 | 1.399 | 1.369 | 1.402 | 13.28 | 1.250 | |
| 660 | 1.438 | 1.431 | 1.414 | 1.368 | 1.291 | 1.207 | |
| 655 | 1.467 | 1.452 | 1.282 | 1.257 | 1.229 | 1.152 | |
| 650 | 1.346 | 1.329 | 1.292 | 1.184 | 1.102 | 1.051 |
Assume that the \(C_{MB}\) in the 5 ml nitrobenzene = C and the residual \(C_{MB}\) in aqueous solution (volume = V ml), = C'. Assume the molar absorptivity of MB in nitrobenzene = e and the absorbance measured = A. Thus, in the regular 1 cm Beckman cell: \(A = e \times C\), and the amount of MB = \[5 \times C = 5 \times \frac{A}{e}\] Mole.
Part of the MB is left in the V ml water. The total amount of MB present can be found by extrapolating V to 0 ml, the resulting A is the absorbance, if all of tbe MB is present in the nitrobenzene. From Table VIII this is found tobe 1.720, gi.ring a total amount of MB: 5 x l'120*ol"^ndanamountof e 11)O-4. MB in water : 5 x "'-" " mole, c concentration of MB in water : C' : exV F. and as the volume : V ml. the 5 x (1.720-A)
This gives \[K_{distr.} = C/C' = \frac{V \times A}{5 \times (1.720 - A)}\]
Results compiled in Table VIII show, that, except for the first value, agreement is satisfactory and Kdist,. : appr. 49, which is large enough for an extraction procedure if desired.
TABLE VTII
Absorbance A of MB extracted by 5 ml nitrobenzene from V ml water containing 5 X 1,65 x 10-7 mole MB (A)'
| 5 | 1.630 | 0.04.0 | 42.0 |
|---|---|---|---|
| l0 | 1.656 | 0.064 | 5 1.8 |
| 20 | 1.588 | 0.132 | 48.1 Mean: |
| 30 | r.541 | 0.179 | 49. 51.5 |
| 40 | t.419 | 0.254 | 46.8 |
| 50 | t.4r9 | 0.301 | 47.2 |
5. Conclusion
The use of a miscible solvent will be of little value, as it raises the absorbance only a few oylo and considering the extra trouble and risk to use another reagent, should be dissuaded.
An inmiscible solyerlt could be useful, but the advantagc is still questionable.
III. ADHERENCE TO BEER,S LAW
1. Introductiort
MB does rrot obey Beer's law (2, 72, 73, 16, l8), but the problemis, to what extent those deviations will be perceptible in an actual determination when resular 1 cm Beckman cells are used'
2. Organic solvents
Calculated amounts of a 3% solution of MB (A) in water were weighed out, and with miscible solvents these were diluted with the solvent to 50 ml, with an inmiscible solvent these were extracted with a single 50 ml portion of solvent. Extraction was practically complete. The resulting were diluted as required and the absorbance determined against the solvent as blank between 650 m\(\mu\) and 700 m\(\mu\). The maximum occurred at about 658 m\(\mu\).
TABLE IX \(\label{eq:table_table} The \ molar \ absorptivity \times 10^4 \ of \ MB \ at \ the \ maximum \ in \ various \ solvents.\)
| F MB × 106 | 1 | 2 | 3 | 4 | 5 | 6 | 7 | 8 | 9 |
|---|---|---|---|---|---|---|---|---|---|
| 3.3 6.6 9.9 13.2 16.5 | 9.58 9.25 9.27 9.24 9.30 | 10.0 9.77 9.70 9.70 9.69 | 10.0 9.85 9.70 9.67 9.68 | 9.27 9.25 9.24 9.24 9.30 | 10.8 10.8 10.3 10.3 10.2 | 8.46 8.35 8.39 8.40 8.21 | 7.73 7.63 8.00 7.99 7.96 | 7.61 7.40 7.68 7.64 7.65 | 8.06 8.34 8.40 7.64 8.22 |
| 1 = ethanol 4 = acetone 7 = acetate buffer 2 = methanol 5 = nitrobenzene 8 = 0.1 F hydrochloric acid 3 = n-propanol 6 = tartrate buffer 9 = oxalate buffer. | |||||||||
The results in Table IX show, that Ecer's law practically obeyed in a concentration range up to \(1.65 \times 10^{-5}\) F MB.
3. Aqueous solutions.
From the stock solution MB (A) solutions of varying concentrations were obtained in water, 0.1 F hydrochloric acid and in the following buffers: an acetate buffer of pH 4.7, a 0.18 F hydrogen tartrate buffer of pH 2.8 and an oxalate buffer composed of 0.15 F oxalic acid \(\pm\) 0.1 F sodium hydrogen oxalate \(\pm\) 0.5 F tartaric acid, pH 1.5.
The results are also compiled in Table IX, showing that when the regular 1 cm Beckman cells are used, deviations from Beer's law may be neglected in a concentration range from 3.3 to \(16.5 \times 10^{-6}\) F MB. However, for an extremely diluted solution, \(3.3 \times 10^{-7}\) F in MB, where absorbance was measured in a 15 cm long Lumetron cell, a molar absorptivity of 94000 was found using tartrate buffers. Compared with the values in column 6 of Table IX this shows defenitely a deviation from Beer's law.
4. Conclusion
Although the molar absorptivity in organic solvents is larger than in water, the increase is not too great, and consequently the sensitivity will not be increased appreaciably by organic solvents.
When regular Beckman cells are used, Beer's law may be assumed to be obeyed.
IV. THE REDUCING INFLUENCE OF THIOCYANATE ON METHY-LENE BLUE
1. Introduction
MB is gradually bleached by thiocyanate in dilute hydrochloric acid. The potentials for the MB and thiocyanate systems show that in strongly alkaline solutions MB will be reduced by thiocyanate, but that in acidic solutions reduction of MB by thiocyanate is highly improbable (5) and that bleaching of MB is apparently caused by decomposition products of thiocyanic acid. As thiocyanic acid is commonly regarded as a fairly strong acid (5, 19, 22), the undissociated acid will be present only at a sufficiently low pH. In view of these facts the reagents will be most stable in a weakly acid medium. This was checked experimentally as follows: to 1 ml \(1.65 \times 10^{-4}\) F MB (A) pipetted into a 10 ml volumetric flask, was added the required amount of buffer (or acid) solution and redistilled water to a volume of less than 9 ml. When the remaining reagent, NaCNS, was added (1.0 ml of a 3.8 F solution), the stopwatch was started. The solution was then rapidly diluted to the mark and transfered to the Beckman cell and the absorbance read at \(\lambda = 666\) m\(\mu\) and slit = 0.03 mm.
One difficulty was the inevitable contamination by small amounts of zinc, which resulted in an initial decrease of absorbance, thus the influence of the pH on the stability of the MB- thiocyanate mixture was indicated by the gradual decrease of absorbance, after the initial drop in the curve of absorbance vs time, which was caused by the zinc impurity.
2. In strongly mineral acid solutions
The samples in 6 F, 3.6 F and 1.2 F hydrochloric acid became almost colorless before they could be transfered to the cells; both peaks at 666 m\(\mu\) and at 745 m\(\mu\) had practically vanished. Apparently reducing action was very fast.
3. In dilute mineral acid solutions
With samples more dilute in hydrochloric acid, resp. 0.7 F, 0.4 F and 0.13 F, the bleaching was much slower and absorbance measurements could be made easily. The sample 0.7 F in acid was decolorized much faster than the other samples, where the decrease in absorbance could be followed easily over a period of five hours, as shown in Graph 7.
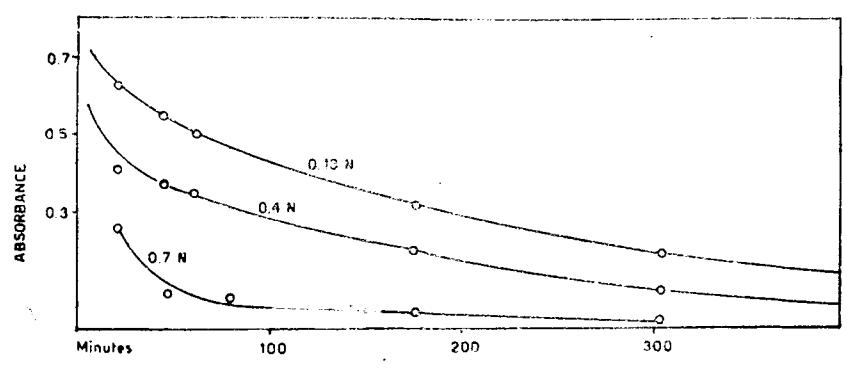
Graph 7. Bleaching of MB by CNS- in HCl.
4. In weakly acid and buffered solutions
Nine samples were prepared in solutions with pH, varying as shown below.
- a. 2 ml 1 F HAc, pH 2.5
- b. 2.5 ml 1 F HAc + 2.5 ml 1 F NaAc, pH 4.5
- c. 0.5 ml 1 F HAc + 5.0 ml 1 F NaAc, pH 5.5
- d. 5.0 ml 1 F HAc + 0.5 ml 1 F NaAc, pH 3.5
- e. 5 ml saturated potassium hydrogen tartrate, pH 3.5
- f. 5.0 ml 1 F ammonium acetate, pH 7.
- g. 5.0 ml 1 F ammonium chloride, pH 4.5
- h. 5.0 ml 1 F monosodium citrate pH 4.
- i. 5.0 ml 1 F disodium citrate pH 5.
The pH was checked with indicator paper, as exact values were not required. The results are practically the same in all cases and in Graph 8 only representative curves are given because the omitted curves are so similar that their inclusion would serve no purpose. After different initial decreases, caused by differing amounts of zinc contamination, the gradual decrease is practically the same and can be neglected over a period of 1 or 2 hours, thus proving the advantage of low acidities, in the pH range of 2 to 7.
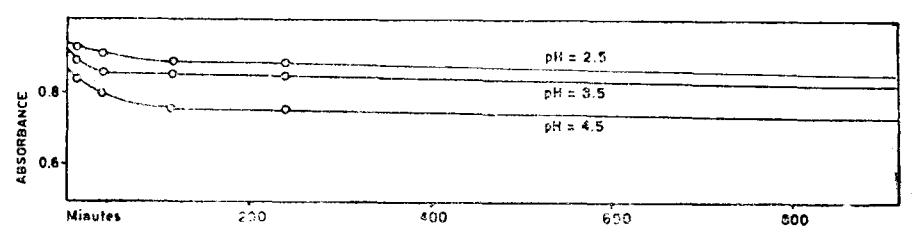
Graph 8. Bleaching of MB b_v CNS- in acetate buffers.
5. Influence of elevatecl tenlperatLrues
In dilute hydrochloric acid heating caused an c.lmost immediate bleaching of MB, but in weakly acid medium the mixture of MB and thiocyanate proved to be sufficiently stable. Tu,o problems had to be investigated:
- 1. Does the temperature decrease the stability of MB in tbiocyanate. If so, the horizontal part of the curve in Graph 8 will be much lower.
- 2. Does the temperature increase the reaction. If so, the horizontal part of the curve in Graph S rvill appear much earlier.
As this is not a kinetic problem, a regulated bath is not necessary.
To maintain a reasonably constant temperature, the samples in the volumetric flasks were placed in a I liter beaker of water at the desired temperature. This was placed in an empty larger beaker. The temperature dropped from 71o to 64" C during the reaction.
The flrst three experiments of the preceding section 4 were repeated at these higher temperatures. After intervals of 20, 40 and 60 minutes part of each solution was transfered to Beckman cells and the absorbanoe measured. The results resembled each other and that at pH 2.5 is given in Graph 9.
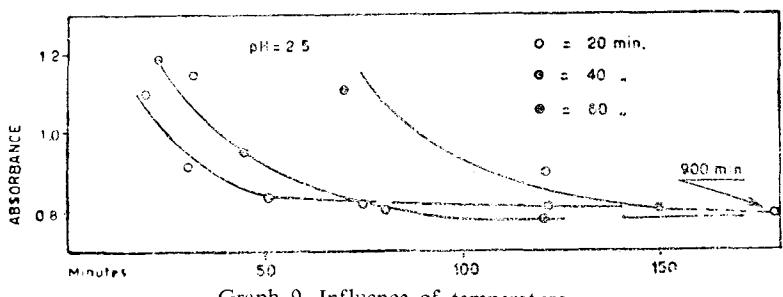
Graph 9 Influence of temperature.
This shorvs, that initiaiil', when th.e sample was still bot, the absorbance was much higher than in the experiments in the preceding section, but decreased as the solution cooled and finally leveled ofl, resembling the curve in Graph 8. Apparently at higher temperatures the complex is not
formed, probably being appreciably soluble, as proved by the fact that the initial decrease in absorbance of MB is not observed. Thus increasing the temperature will be useless to speed up the reaction. It is also significant, that the stability of the MB- thiocyanate mixture is not effected by a higher temperature at these pH's, contrary to the results observed with solutions in dilute mineral acids.
6. Mechanism of the reduction
Reduction of MB by the thiocyanate ion itself is highly improbable, as in this case raising the temperature should accelerate the bleaching even at higher pH's, while the results prove the reverse.
If the bleaching of MB is caused by decomposition products of free thiocyanic acid, then raising the acidity should accelerate it, as more free acid is produced. This is indeed shown in section 2. Moreover, raising the temperature in dilute mineral acid solutions will accelerate the bleaching: this was proved by the complete disappearance of the color within 10 minutes in dilute hydrochloric acid solutions at about 100°C. And raising the temperature in weakly acid medium will have no influence on the color, as no free thiocyanic acid can be present; this fact was proved in Section 5.
7. Conclusion
The bleaching of MB is caused by the decomposition products of free thiocyanic acid which is formed only at sufficiently low pH. Consequently, the color of MB is sufficiently stable in weakly acid solutions, but not so in dilute mineral acids.
Raising the temperature will not accelerate the bleaching of MB, but at the same time prohibits the formation of the zinc- MB- thiocyanate complex.
V. COMPOSITION AND SOME PHYSICAL PROPERTIES OF THE COMPLEX
1. Introduction
The complex probably consists of the MB cation and the tetrahedral \(Zn(CNS)_4^{2-}\) anion. Suppose for the sake of convenience the formula is \((MB)_2 Zn(CNS)_4\). This should dissociate thus:
\[(MB)_2 Zn(CNS)_4 \rightleftarrows 2~MB^+ + Zn(CNS)_4^{2-}\] with \(K_{sp} = C_{MB}^2 + \times C_{Zn(CSN)_4^2} -\).
Assume for the tetra thiocyanate zincate ion that:
\[Zn(CNS)_4^{2-} \rightleftharpoons Zn^{2+} + 4 CNS^{-}\] with the corresponding K<sub>instab.</sub>.
The formation of \(Zn(CNS)_4^{2-}\) proceeds in stages from \(Zn(CNS)^+\) to \(Zn(CNS)_4^{2-}\), but for the complete conversion the \(K_{instab} = K_1 \times K_2 \times K_3 \times K_4\).
Although a mixture of Zn<sup>2+</sup> and excess CNS<sup>-</sup> will contain the various complexes, this relation will hold:
\[K_{\text{instab}} = \frac{C_{Zn^{2^+}} \cdot C_{\text{CNS}}^4 - }{C_{Zn(\text{CNS})_4}^2}.\]
Multiplying by K<sub>sp</sub> gives:
\[K = K_{sp} \times K_{instab} = C_{MB}^2 + \times C_{Zn}^2 + \times C_{CNS}^4\] , where \(C_{Zn^{2+}}\) and \(C_{CNS}\)— are the actual concentrations present as such, and not the concentration added. However, as \(K_{instab}\) is not very small (6), so that the complex is not very stable, these actual concentrations will practically equal the concentrations added. Then the relation holds:
\[pK = 2 pMB + pZn + 4 pCNS\], where the concentrations are the concentrations added.
Varying the concentrations of the three reactants will give the lowest limit at which reaction occurs, as indicated by a sharp decrease in absorbance, which can be detected photometrically as well as visually.
If \(C_{\rm MB}^+\) is kept constant and \(C_{\rm Zn^{2+}}\) and \(C_{\rm CNS}^-\) varied until reaction takes place, then: pZn + 4 pCNS = constant.
Similarly if \(C_{Zn^2+}\) is kept constant and \(C_{MB}^+\) and \(C_{CNS}^-\) varied until reaction takes place, then: pMB + 2pCNS = constant.
Reaction rates will be of no concern, provided enough time is given for the reaction to reach equilibrum.
2. Experimental results
Various sets of solutions were prepared, buffered with 0.16 tartaric acid + 0.18 F sodium hydrogen tartrate. Each set contained a fixed amount of zinc and MB, to which varying amounts of thiocyanate were added. The upper and lower limits of the thiocyanate concentration were found in an orientating experiment by adding widely spaced amounts of thiocyanate. Visual observations located the concentrations between which that of thiocyanate should lie as denoted by an unchanged color and a complete decoloration. The same set was then prepared, but with amounts of thiocyanate spaced at intervals of 0.1 ml. The absorbancies of these solutions were measured after 75 minutes.
It was found that after a certain volume of thiocyanate the transmittance increased suddenly and that the change was so abrupt that it could be noted unambigiously even visually: the set of test-tubes showed a row that was almost identical in color, followed by a row much lighter-and decreasing-in color.
Results are compiled in Table X, where the values of the volumes of thiocyanates are the means of the last volume not reacting and the first volume reacting. These results prove, that with a constant \(C_{MB}\), the \(C_{CNS}-:C_{Zn}^{+2}=4:1\) and with a constant \(C_{Zn}^{+2}\) the \(C_{MB}:C_{CNS}-=1:2\), thus proving the formula \(MB_oZn(CNS)_d\) to be correct.
Substitution of the values found in: pK = 2 pMB + pZn + 4 pCNS will give the value for pK (last column in Table X).
TABLE X Calculation of the pK.
| pMB | pZn | pCNS | pK | |
|---|---|---|---|---|
| photom. | 4.78 | 3.00 | 1.83 | 20.4 |
| 2.00 | 2.06 | 19.9 | ||
| 3.00 | 1.73 | 19.5 | ||
| 2.00 | 2.03 | 19.6 | ||
| 4.00 | 1.56 | 19.8 | ||
| visual | 4.78 | 2.00 | 2.04 | 19.7 |
| 2.30 | 1.94 | 19.5 | ||
| 2.61 | 1.89 | 19.7 | ||
| 3.00 | 1.71 | 19.4 | ||
| 3.30 | 1.67 | 19.4 | ||
| 3.61 | 1.59 | 19.5 | ||
| photom. | 4.78 | 3.00 | 1.73 | 19.5 |
| • | 4.78 | 1.83 | 20.4 | |
| visual | 4.78 | 3.00 | 1.71 | 19.4 |
| 5.08 | 2.00 | 1.59 | 19.7 | |
| 4.78 | 1.99 | 19.3 | ||
| 4.61 | 1.79 | 19.4 | ||
| 4.30 | 1.95 | 19.5 | ||
| 4.48 | 1.85 | 19.4 |
The rnean value of pK : 19.6 and agreement is satisfactory. From thc r,alues found for K,^","0 (6, 23), then
\[pK_{sp} = pK - pK_{instab} = approx.\] 18.
This shows, that K." is only ntoderately smoll, so that precipitation will start only at moderately low concentrations, but the zinc can still be precipitated quantitavely if the reagent solutions alrea.dy contain enough zinc to react with the MB and thiocyanate.
3. Influence of tentperature
' The variation of K ivith temperature u as determined, using the visual method as dcscribed in preccding Section 2, except that the test-tubes were placed in a constant temperature bath. Rcsults compiied in Table XI show the pK to bc temperature dependent, but even at 0"C the decrcase in K is not cnough to increase the sensitivity to such an extent as to justify the additional inconvenience of using an ice bath.
TABLE XI Influence of tenrperature on the pK
| pCNS | pK | ||
|---|---|---|---|
| .1.78 | 20.58 | ||
| 18.95 | |||
| I A A | 13.36 | ||
| 3.00 | +. / o | l.4it | I 7.50 |
| 3.00 | 4.78 | i.l0 | 15.97 |
| 3.00 3.00 3.C0 | 1.78 | 2.25 1.85 1.70 |
However, the variation in pK is pronounced enough, that it may be expected that the temperature rvill effect the accuracy of a determinaticrn of zinc based on its complex formation rvith MB and thiocyanate.
4: Some physical properties of the contpler
The complcx :rp''peared iu dilute sohrtions as an ertremcly fine precipitate, clearly visible as an opalescence. When lcft in thc reaction vessel a part was "plated out" on the walls, as a barely visible purplish film. This was more pronounced in the ccrncrs as observed when the Beckman cclls were soaked in a deterge nt: the complex decomposed again into MB and thc bluc color of MB was distinctly deeper in the corners.
The film rvas fairly adherent, and the cclls had to be scmbbed clean.
Warming the solution caused the complex to coagulate as larger purplish flocks with a density apparently close to that of the solution, as centrifuging with a regular semimicro centrifuge could not separate the flocks from the solution. The complex could be filtered easily, using paper, a cotton plug or a glass wool plug.
i
5. Absorption spectrum of the complex
A difficuity of this detcrnination was the gradual scttling of the precipitate. However, a stable colloidal suspension was obtained with addition of gelatin. Solutions were prepared, containing 0.18 F tartaric acid +0.18 F sodium hydrogen tartrate,0.5o7o gelatine, thiocyanat€, zinc (in excess) and MB in varying concentrations.
The absorption spectrum in Graph 10 shows a peak at 560 m',r.
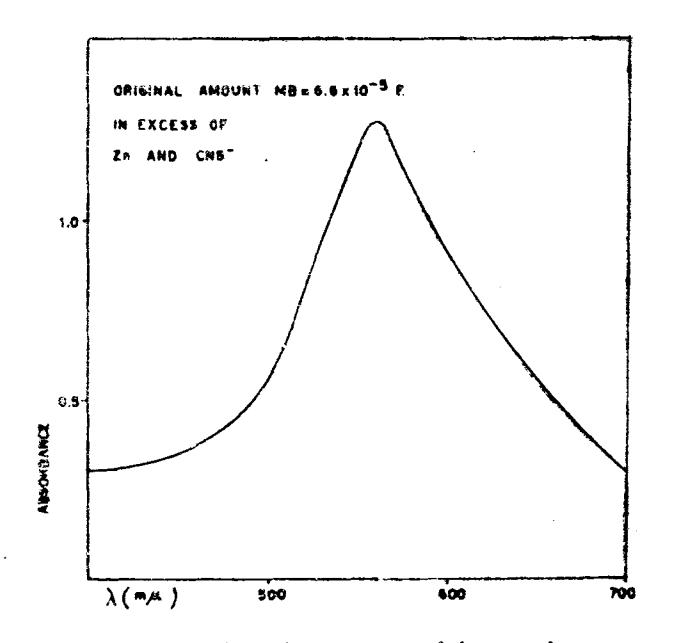
Graph l0. Absorption sp€ctrun of thc complex.
The absorbancies of the various solutions at 560 mp slrowed a good agreement with Beer's law (Table XII).
These suspensions are quite stable as shown by measurements made at regular intervals and even after standing overnight. Results given in Table XIII slrow practically no decrease of the absorbance lvith time.
TABLE XII
Absorbancies of the complex at 560 mp.
| 0.339 1.65 20400 0.62s 3.30 I 8900 | lper mole MB. |
|---|---|
| 4.95 19000 v.>-z | |
| 6.60 1.297 19600 | |
| 8.25 1.601 i9500 | |
| 9.90 1.894 19200 |
TABLE XITI
Stability of the colorof the complex with time, corresponding to 6.6x10⁻⁶FMB.
| A(560 mp) | |
|---|---|
| I hours | 1.293 |
| 2 hours | t.298 |
| 4 hours | 1.294 |
| 24 hours | 1.296 |
| 28 hours | 1.297 |
| 30 hours | t.298 |
The absorbance per mole MB is about 19500 at 560 mg. and 4150 at 666 mir. The high absorbance at 560 mi.r. would make a determination of zinc via the absorbauce of the complex possible, were it not that the MB itself notably absorbs at this rvavelength (molar absorptivity : 8500). Correcting the absorbance for the MB present by nreasuring the absorbance at 666 mp is possible, but will make the method more complex.
6. Conclusiott
The solubility product of the compiex is only moderately small, so to ensure a complete precipitation of zinc as possible, the thiocyanate content should be as high as possible. Preferably tire reagent solutions should contain some zinc, enough to cause reaction. Increasing the MB content rvill not be practical as this will result in a too high absorbance.
The complex itself could be used to determine zinc, but the method would involve some otherwise unnecessary calculation.
VI. KINETICS OF THE REACTION
l. Introduclion
The gradual decrease of the absorbance of a mirture of zinc, MB and thiocyanate shows that the complex formation is a slow reaction and thus the kinetics were investigated insofar as they might influence the determination itself.
As no recording attachment was available, two operators were needed, one of whom operated the spectrophotometer and read the transmittance at the time signalled by the second operator, who also recorded the results.*
In each "run", three samples were started, approximately three minutes apart, by adding the required amounts of thiocyanate to the otherwise completely prepared samples. The exact starting times read on a stopwatch were recorded and subsequent reading were made in the same order and at corresponding times.
2. Influence of pH
The influence of the pH on the reaction rate was found by using several buffers of varying pH's. Results compiled in Graph 11 show clearly that at lower pH's the reaction proceeds considerably slower than at higher pH's.
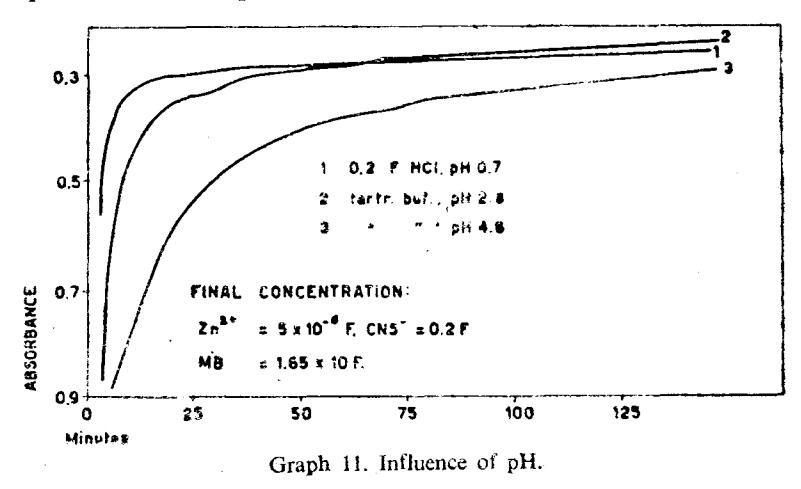
In 0.2 F acid the reaction is apparently complete after 30 minutes, as the curve shows only a slight regular decrease of absorbance after this. In the tartrate buffers however, apparently the reaction was not entirely complete after 60 minutes as shown by a steady increase of transmittance, the increase being larger with higher pH's. From this vieuwpoint a low pH would be advisable and oxalic acid buffers are apparently the most suitable, their only discdvantage being the low solubility of sodium hydrogen oxalate. But although with these buffers the reaction is much faster than with tartrate buffers, a small residual decrease in absorbance still persists, which should be taken into acount in a zinc determination.
* Pratiwi and Ang Tjoan Liem.
This phcnc.urenon may be due to a slow interaction between thiocyanate and MB in the weakly acid solntion, but also may be due to absorptionphellomenit. To chcck this, three samples were prepared, rvith the same flnal concentrations of 4 ppm zinc, 0.4 F thiocyanate and buffered with 0.15 F oxalic acid -i- 0.15 F sodium hydrogen oxalate, but \ith different amourts of N{8, resp. 1.65 x 2.48 and 3.3 ){ l0*5 F in MB (A). Part of each solution rvas filtered and the transmittance of both the liltered and unfiltered solutions measure d at regular time intervals. (Graph 12). If the increase in transmittance is due to absorption, the increase in solutions with larger MB content would bc larger and filtcred solutions should not show any increase at a.ll.
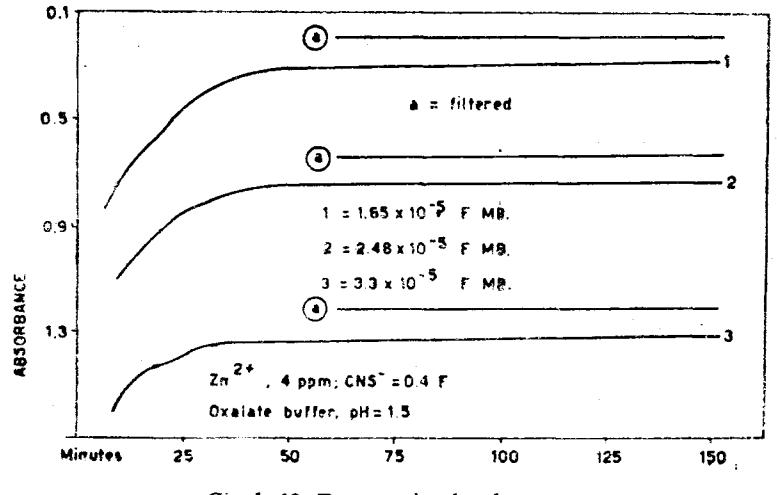
H orvever, 0,"",'"Jll:"""#:: :i:"ffied for a// so! uti o ns, tr*r s
any absorption may be neglected.
3. Influence of thiocvanate concentration
This was investigated by adding different amounts of thiocyanate to various samples and determining the transmittance vs time curve.
Results in Graph 13 show clearly the advantage of a largc excess of thiocyanate. Although in dilute (0.2 F) hydrochloric acid thc reactionis rapid enough with final a concentration of 0.2 F in thiocyanate, in oxalate buffers about the double amount (0.4 F) is required to get approximately the same rate. Of course more concentrated solutions are possible, but this has its practical limitations.
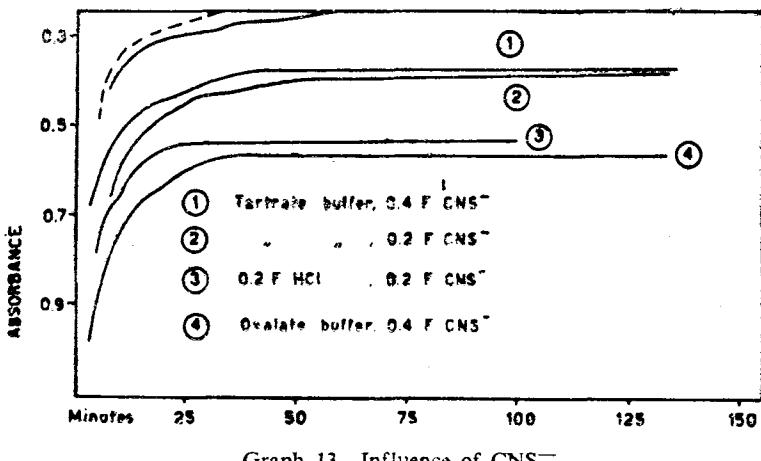
Graph 13. Influence of CNS-.
Calibration curves.
Reliable calibration curves for a zinc determination will be obtained only if the absorbancies are taken from the part of the transmittance vs. time curve that is as level as possible and the small decrease in absorbance still present makes it necessary to read the absorbance after a fixed time (about 60 minutes), but differences up to 5 minutes will cause no appreciable error. Plotting the absorbancies observed against the zinc concentrations in the usual way will give calibration curves with a downward slope and although there is no particular objection against this, a curve with an upward slope would probably be easier to use. These will be obtained if semilog paper is used or regular graph paper where the absorbance is plotted with the smallest A at the top.
5. The influence of temperature
As the temperature influence the solubility product of the complex, it can be expected to influence the calibration curve also.
To check this, 4 sets of solutions were prepared, all containing the same final concentration of a buffer at a certain pH, approximately \(4 \times 10^{-5}\) F MB (A), 0.4 F sodium thiocyanate and different amounts of zinc. Each set was kept at a chosen temperature and the absorbance read after 60 minutes. Results are compiled in Table XIV and a representative calibration curve is given in Graph 14.
Set I uses a buffer composed of 0.5 tartaric acid + 0.25 F sodium hydrogen tartrate, with a pH = 2.8. Apparently the curve at 20°C will lie a trifle higher, but between 20° and 40° C the deviations are so small that they may
Absorbancies of the residual MB after reacting with different amorrnts of zinc in various buffers-
TABLE XIV
| amounts of zinc per l0 ml in pg | ||||||||
|---|---|---|---|---|---|---|---|---|
| Temp. l- | ("c) | o.o | 3.75 | 5.00 | ||||||
| Set I. | 1.897 | 1.4s2 | 0.e39 10.703 10.4550.235 | ||||||
| pH:2.8 | 1.901 | 1.482 | 0.941 10.751 10.483 | 0.280 | |||||
| 2.000 |r.492 | 0.960 10.72t 10.475 | 0.291 | ||||||
| t.892 | r.495 | 0.918 10.733 10.495 | 0.306 | ||||||
| Set II. | | 17 | 1.r45 10.918 10.688 | 0.450 10.31s 10.298 | |||||
| pH:1.5 | 2 2 | | l.l9s 1 0.984 10.742 | 0.452 10.321 1 0.285 | |||||
| t.223 | 0.989 10.755 | 0.49210.301 10.290 | |||||||
| 1.229 11.002 10.757 | 0.480 |0.315 10.283 | |||||||
| 1.201 tr.002t0.767 | 0.512 | 0.32r lo.2e2 | |||||||
| 0.921 10.741 10.551 | 0.343 |0.218 l0.l6e | |||||||
| Set ilr. | zo I | I r.srz I r.rlr | 0.893 10.678 10.480 | |||||
| pH:0.7 | | 28 | ll.78sll.350 | 0.914 10.710 10.498 | |||||
| 35 | 11.807 tt.4r4 | 0.974 | 0.732 | 0.540 | ||||||
| 45 | 11.6s011.328 | 0.939 10.726 10.s29 | ||||||
| Set IV. | 17.5 | 1.628 | 1.139 | 0.896 | 0.678 | 0.446 | 1.25 pg: 1.354 | |
| pH:3.1 | 23 | 1.724 | 1.245 | 0.975 | 0.735 | 0.498 | 1.483 | |
| 28.5 | 1.755 | 1.28 r | 1.041 | 0.775 | 0.559 | L548 | ||
| 32.5 | 1.801 | 1.376 | r.086 | 0.85 I | 0.642 | 1.602 |
rvell be due to experimental errors and it can be concluded that between 20oC and 40"C with buffers of pH 2.8 the temperature has no influence on the results. In Set II an oxalic acid buffer is used, composed of 0.5 F tartaric acid + 0.15 oxalic acid + 0.10 sodium hydrogen o-ralate, with a pH of 1.5. Again practically the same results are obtained within a considerable temperature range, this time between 22" and 32"C. Beyond these limits however, marked changes are n<ited. At l7"C the absorbancies have decreased markedly and at higher temperatures of 40o and 50"C also a marked change in slope occurs.
In Set III a mirture of 0.2 F hydrochloric acid and 0.5 F tartaric acid, pH 0.7, is used. The deviations here are much more pronounced and the changes in slopes at higher temperatures are mnch more perceptible.
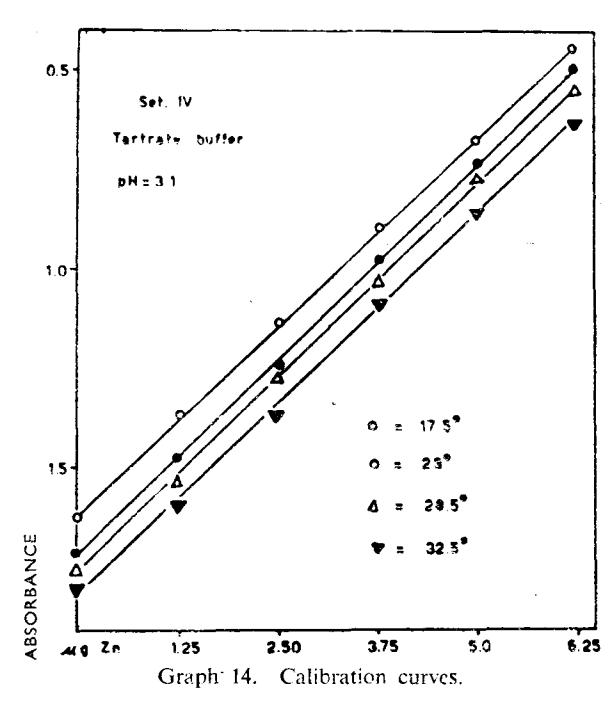
In Sct IV a 1 F solution of tartaric acid was used, neutralized with solid sodium carbonate to a pH of 3.1. The calibration curves have about the same slope, their location is different: those, at lower temperatures lying higher than at higher temperatures. Corrections can be applied of 0.05 µg zinc for each decrease in temperature of 1°C.
The unexpected temperature independence with buffers of pH 1.5—2.5 is probably due to two opposing effects of the temperature: an increase of temperature will increase the solubility of the complex, which increases the amount of free MB and thus increases the absorbance, but at the same time it will also probably increase the liberation of free thiocyanic acid, resulting in an increase in the bleaching of MB and thus decreases the absorbance.
Apparently these factors at pH 1.5 — 2.5 cancel out within a wide temperature range and no correction is necessary. Beyond these limits appropriate corrections can be applied.
It is remarkable, that at pH 3.1 the absorbance increases with decreasing temperature. This can be expected, as at this high pH value liberation of free thiocyanic acid is highly improbably, thus no counterbalancing decrease in absorbance is to be expected.
6. Conclusion
From the viewpoint of reaction rate a low pH is advantageous and buffers with a pH between 1.5 and 2.5 are desirable, as with these the calibration curves are temperature independent within a wide temperature range.
The thiocyanate content should be as high as conveniently possible; a final concentration of about 0.4 F is adequate.
The calibration curve found shows that a difference in absorbance of 1 corresponds to 0.5 ppm of zinc, thus giving an extremely high sensitivity.
DISCUSSION AND CONCLUSION
The formation of a complex by zinc with thiocyanate with MB can be made the basis of a new spectrophotometric determination of zinc, where the decrease in absorbance corresponds to the amount of zinc present. As one mole of zinc ties two moles of MB and MB itself has already a very high molar absorptivity, this method can be a very sensitive one. The absorbance of MB is practically pH independent over a wide pH range of 1.5—9 and with an ionic strength below 0.2 also free of salt errors. Measuring the decrease in absorbance of MB provides a method already sensitive enough and the use of organic solvents to increase the sensitivity will be of little use. Extraction with inmiscible solvents offers too many difficulties and not enough advantages.
As the complex formation is a slow reaction, conditions which offers the greatest speed should be found: the pH should be low (1.5 — 3) and the thiocyanate content should be high, about 0.4 F. Absorbance measurements should be taken after a fixed time (60 minutes), but differences of about 5 minutes will cause no appreciable errors. Convenient calibration curves are obtained when absorbancies are plotted with the smallest value above. These are practically straight and temperature independent over a wide temperature range.