

INTRODUCTION
The reaction of zinc with an excess of methylene blue (here shortened: MB) and thiocyanate will result in a decrease in absorbance of the remaining MB which subsequently can be used as a basis for a photometric determination of zinc.
The various factors influencing this decrease have been discussed in a previous paper (3), showing that:
- the pH should preferably lie between 3- 3.5.
- readings should be made after 60 minutes.
- the temperature should be corrected for or bc kept betu,'een 23"C and 29"c.
- the sensitivitv is extremelv high.
Because of the possibiiities shov,ed bv this method, an attempt was macle to e'i.aluate this method more in detail g'ith respect to simplicitl,, sensitir' itv, precision and freedorn trom interttrence.
EXPERIN{E,N]'AL DEI',\ILS
fwhunteittatioa. Photometric measurements v-ere made with the Beckman DU spectrophotometer. In a few cases the Colcn.ran Universal spectrophotometer, the Leitz compensatine photometer and the Lumetron photorTreter were used.
Reagents. Where ar.ailablc, Reagent Grade chernicals u'ere used the same as deseribed in (3). ,
Glasu-ool. Pyrex Reagent Grade, purit'ied b1 soaking overnight in 1 F h1'drochloric acid, washed untill neutral to litmus paper and dried.
NfETHODS USE,D
Solutions containing knos'n amounts of zinc in a volume of 4.00 ml were prepared b.v taking n ml of the zinc standard solution and (4- n) ml redistilled water in a P1'rcx testtube . Into this was pipettcd 5.00 ml of a mixture of the appropiate bufttr containinq complexing asents ancl a suitable amount of N{B. Mixing directll,' in a Beckman cell rvas not f easible because the complex plated out on the cells. At the moment the last reagent, 1.00 ml of thiocyanate solution v'as added, the stops'atch was started and the mixture shaken.
In procedare A the mixturc was left standing at room tempcrature and thc absorbance at 666 mu measured (water as blank) atler 60 minutes. In procedure B the mixture was left standing at room temperature in a beaker of wa.ter. After 55 minutes the solution rvas filtered through a plug of 30- 50 mg of loosely packed Pyrex glassu'ool.
The first tvzo ml were discarded, the following tiltrate caught directly in the Beckman cells and the absorbance at 666 mu measured (water as blank) after 60 minutes,
E,XPE,RIIVfENTAL RE,SULTS, PROCEDURE A
In all these follov'ing experiments bufrtr mixtures (at once acting as complexing agents) containing 0.375 mole of tartaric acid and 0.375 of sodium hvdrogentartrate pcr litcr v,'ere used.
To this mixture was added the required amount of MB. All determinations were carried out in triplicate, except where otherwise stated. The resulting mean values and standard deviations, dA, and the detailed experimental conditions are compiled in Tables I and II. Some representative calibration curves are given in Graph. 1, which shows varying shapes with different sets of reagents.
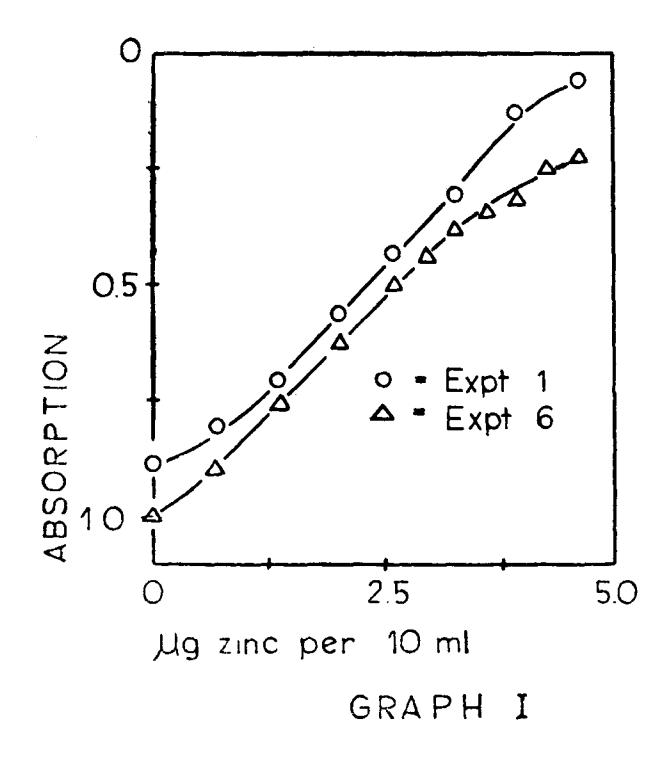
In Experiments 1 to 5 these have the same general shape, the beginning and the end showing a deviation from BEER'S law.
The deviation in the beginning is caused by the fact that the zinc in very low concentration does not react with the MB and thiocyanate. However, by adding a sufficient amount of zinc to the MB buffer mixture, a straight calibration curve is obtained (Expt. 6 and 7). In the higher zinc concentrations again deviations from BEER'S law occur, but straight calibration curves are obtained with up to 2.5 ppm of zinc (Expt. 8 and 9).
The slope is practically the same and 0.1 ppm of zinc corresponds to a difference in absorbance, dA = 0.201.
| TABLE I. | Absorbance | of the | residual | MB | at | 666 | mu | (1 | cm ( | cell' | ) |
|---|
| NaCNS MB/liter | 3.2 | ot. 1. F(A) MB(A) | 3.5 | t. 2. F(B) MB(A) | Exp 5.03 22.5 mg | F(B) | 5.03 | t. 4. F(B) MB(A) | t. 5. F(A) MB(A) | |
|---|---|---|---|---|---|---|---|---|---|---|
| μg Zn/10 ml | Am | dΛ | \(A_{\mathbf{m}}\) | dA | \(A_{m}\) | dA | \(A_{\mathfrak{m}}\) | dA | Am | dA |
| 0.00 | 0.886 | 0.018 | 0.948 | 0.023 | 1.069 | 0.040 | 0.934 | 0.031 | 0.941 | 0.033 |
| 0.65 | 0.808 | 0.010 | 0.831 | 0.007 | 0.998 | 0.002 | 0.801 | 0.011 | 0.908 | 0.014 |
| 1.31 | 0.709 | 800.0 | 0.744 | 0.004 | 0.947 | 0.010 | 0.740 | 0.005 | 0.711 | 0.020 |
| 1.96 | 0.563 | 0.006 | 0.611 | 0.006 | 0.869 | 0.017 | 0.606 | 0.011 | 0.584 | 0.008 |
| 2.61 | 0.434 | 0.001 | 0.947 | 0.005 | 0.759 | 0.005 | 0.466 | 0.005 | 0.457 | 0.001 |
| 3.26 | 0.311 | 0.001 | 0.381 | 0.006 | 0.622 | 0.007 | 0.381 | 0.005 | 0.370 | 0.016 |
| 3.92 | 0.204 | 0.005 | 0.273 | 0.001 | 0.482 | 0.002 | 0.250 | 0.006 | 0.278 | 0.007 |
| 4.57 | 0.161 | 0.001 | 0,235 | 0.007 | 0.368 | 0.004 | 0.204 | 0.004 | 0.345 | 0.007 |
TABLE II. Absorbance of the residual MB at 666 mu (1 cm cell)
| NaCNS | Expt. 6 1) | Expt. 7 2) | Expt. 8 1) | Expt. 9 2) | |
|---|---|---|---|---|---|
| MB/lit. | 3.78 F(A) | 3.78 F(A) | 3.78 F(A) | 3.78 F(A) | |
| 25 mg MB(A) | 25 mg MB(A) | 25 mg MB(A) | 25 mg MB(A) | ||
| μgZn/10 ml | \(A_{m}\) \(d\Lambda\) | Am dA | μgZn/10 ml | Am dA | Am dA |
| 0.00 | 1.000 0.001 | 0.907 0.050 | 0.00 | 0.999 0.007 | 0.863 0.016 |
| 0.65 | 0.905 0.012 | 0.752 0.016 | 0.16 | 0.949 0.037 | 0.841 0.019 |
| 1.31 | 0.755 0.018 | 0.633 0.014 | 0.33 | 0.950 0.003 | 0.812 0.002 |
| 1.96 | 0.637 0.014 | 0.502 0.008 | 0.65 | 0.902 0.016 | 0.741 0.010 |
| 2.61 | 0.512 0.007 | 0.371 0.013 | 0.98 | 0.832 0.006 | 0.688 0.010 |
| 2.94 | 0.444 0.004 | 0.325 0.006 | 1.14 | 0.803 0.008 | 0.674 0.006 |
| 3.26 | 0.388 0.001 | 0.285 0.007 | 1.31 | 0.766 0.014 | 0.623 0.008 |
| 3.59 | 0.342 0.007 | 0.254 0.002 | 1.63 | 0.701 0.002 | 0.559 0.016 |
| 3.92 | 0.292 0.018 | 0.232 0.007 | 1.79 | 0.660 0.018 | 0.536 0.002 |
| 4.25 | 0.259 0.007 | 0.210 0.011 | 1.96 | 0.629 0.011 | 0.497 0.010 |
| 4.57 | 0.230 0.005 | 0.206 0.006 | 2.28 | 0.576 0.008 | 0.444 0.013 |
| 4.90 | 0.229 0.007 | 0.203 0.005 | 2.61 | 0.507 0.007 | 0.382 0.020 |
Remarks: In all these experiments was used a buffer mixture composed of 0.375 mole of tartaric acid + 0.375 mole of sodium hydrogen tartrate per liter, adjusted with
<sup>1</sup>) \(2 \times 10^{-3}\) mmole zinc per liter.
<sup>2</sup>) \(4 \times 10^{-3}\) mmole zinc per liter.
Complexing action of this buffer mixture is quite satisfactory, as will be discussed in a later section.
Some difficulty was caused by gradual plating and floccing out and at higher zinc concentrations deviation occured, caused by the turbidity of the precipitate. This was avoided by filtering off the complex (procedure B) in the following experiments.
EXPERIMENTAL RESULTS, PROCEDURE B.
In all these experiments only purified MB was used. Various buffers and complexing agents were investigated.
The reagent mixture contained approx. 25 mg of MB per liter and enough zinc to start the curve at an absorbance of about 1.9.
A. Tartrate as buffer and as complexing agent.
The reagent mixture contained per liter 1 mole of tartaric acid and 0.2 moles of sodium hydrogentartrate.
In Expt. 10 was added 24 mg MB (A, pur) and in Expt. 11 was added 24 mg MB (B, pur).
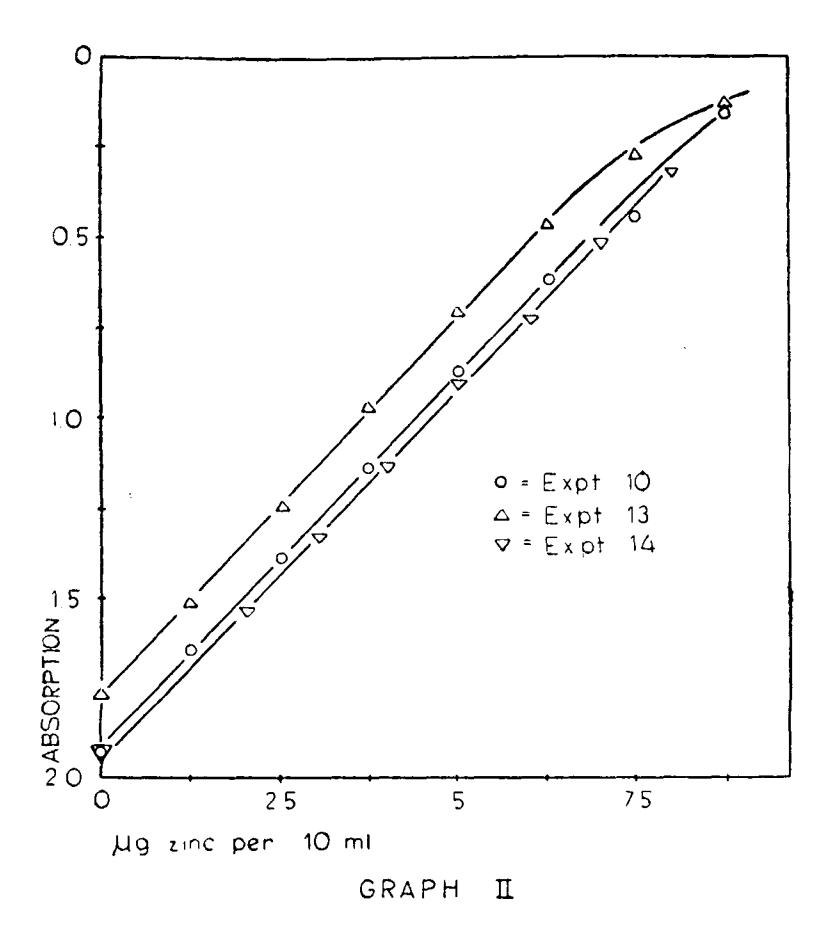
Results compiled in Table III and Graph 2 show that the reproducibility is good and that the limit of zinc concentration determinable has increased to 0.8 ppm. The calibration curve is a straight line up to 0.7 ppm; the slope is practically the same as with procedure A and a dA of 0.208 corresponds to 0.1 ppm of zinc.
B. Tartrate as buffer and ethylene diamine as complexing agent.
The reagent mixture contained 1.5 mole of tartaric acid, 0.5 mole of ethylene diamine hydrate and 0.25 mole of sodium hydrogentar-trate dissolved in 1 liter hot water. After cooling, the white crystals formed (possibly ethylene diamine tartrate) were filtered off and 24 mg MB (A, pur) added to the clear solution and diluted to 1 liter. Results of Expt. 12 compiled in Table III show larger deviations but on the whole are similar to those in Expt. 10 and 11; the slope is
slightly smaller, dA is 0.198 per 0.1 ppm of zinc. C. Dichloro acetate as buffer and tartrate as complexing agent.
The reagent mixture contained per liter 1 mole tartaric acid, 0.5 mole dichloro acetic acid, 0.5 mole sodium dichloro acetate and 24 mg MB (A, pur); pH is approx. 2 (pH Hydrion paper).
Results of Expt. 13 compiled in Table III and Graph 2 show results similar to those in Expt. 12; here, dA is 0.201 per 0.1 ppm of zinc.
TABLE III. Absorbance of the residual MB at 7666 mu (1 cm cell); 1 ml NaCNS (B) 3.6 F; 24 mg MB (pur) per liter.
| μg Zn | Expt. 10 | Expt. 11 | Expt. 12 | Expt. 13 |
|---|---|---|---|---|
| per ml | \(A_m\) \(dA\) | \(A_{m}\) dA | \(A_{m} = dA + 1\) | \(A_{m}\) \(dA\) |
| 0.00 | 1.921 0.020 | 1.856 0.008 | 1.892 0.068 | 1.765 0.039 |
| 1.25 | 1.644 0.008 | 1.608 0.008 | 1.675 0.015 | 1.502 0.014 |
| 2.50 | 1.389 0.005 | 1.345 0.008 | 1.408 .0015 | 1.237 0.019 |
| 3.75 | 1.142 0.022 | 1.077 0.008 | 1.168 0.020 | 0.960 0.027 |
| 5.00 | 0.871 0.011 | 0.808 0.010 | 0.919 0.025 | 0.718 0.021 |
| 6.25 | 0.614 0.006 | 0.603 0.011 | 0.614 0.003 | 0.496 0.028 |
| 7.50 | 0.450 0.005 | 0.328 0.009 | 0.332 0.014 | 0.262 0.025 |
| 8.75 | 0.138 0.019 | 0.128 0.019 | 0.131 0.020 |
D. Citrate and tartrate as buffer and as complexing agent.
The reagent mixture contained per liter 1 mole citric acid, 0.5 mole sodium hydrogen tartrate and 24 mg MB (A, pur); the pH was approx. 3.5 (pH Hydrion paper).
Results of Expt. 14 compiled in Table IV and Graph, 2 show results similar to Expt. 10 and 11; dA is 0.202 per 0.1 ppm of zinc.
E. Oxalate as buffer and tartrate as complexing agent.
The reagent micxture contained per liter 1 mole tartaric acid, 0.15 mole oxalic acid, 0.1 mole sodium hydrogen oxalate and 22.5 mg MB (pur); in Expt. 15 A was used MB (A. pur), in 15 B MB (B, pur) and in 15 C MB (C, pur). The results compiled in Table IV show quite a satisfactory agreement and dA is 0.206 per 0.1 ppm of zinc.
Absorbance of the residual MB at 666 mu (1 cm cell); 1 ml NaCNS (B) 3.6 F; 22.5 mg, B (pur) per liter.
| μg Zn per | Expt. 14 | Expt. 15A | Expt. 15B | Expt. 15C |
|---|---|---|---|---|
| 10 ml | \(A_m\) \(dA\) | \(A_{m}\) dA | \(A_{m}\) \(dA\) | Am dA |
| 0.00 | 1.921 0.038 | 1.785 0.018 | 1.807 0.013 | 1.920 0.014 |
| 2.00 | 1.537 0.005 | 1.596 0.063 | 1.695 0.013 | 1.755 0.030 |
| 3.00 | 1.334 0.011 | 1.408 0.008 | 1.495 0.009 | 1.508 0.030 |
| 4.00 | 1.138 0.003 | 1.206 0.012 | 1.297 0.003 | 1.322 0.013 |
| 5.00 | 0.904 0.035 | 1.012 0.009 | 1.095 0.004 | 1.125 0.011 |
| 6.00 | 0.721 0.009 | 0.791 0.004 | 0.876 0.018 | 0.918 0.002 |
| 7.00 | 0.517 0.009 | 0.583 0.015 | 0.653 0.030 | 0.741 0.030 |
| 8.00 | 0.333 0.013 | 0.378 0.010 | 0.463 0.010 | 0.531 0.024 |
To improve the reproducibility some zinc was added to the reagent mixture and this was used in Expt. 16, where smaller increments of zinc were taken.
The results compiled in Table V are satisfactory and show a better reproducibility.
TABLE V. Absorbance of the rcsidual MB at 666 mu (1 cm cell); 1 ml NaCNS (B) 3.6 F; 5 mg NfB. (pur) per liter.
| ug Zn per 10 ml | 16A Expt. dA | 168 Expt. A Or\ m | Epxt. 16C dA m | Expt. 16D A_ dA |
|---|---|---|---|---|
| 0.00 | 0.595 0.012 | 0.697 0.002 | 0.656 0.009 | 1.344 0.004 |
| 0.25 | 0.561 0.014 | 0.640 0.000 | 0.599 0.01s | 1.303 0.002 |
| 0.50 | 0.511 0.013 | 0.s85 0.009 | c.552 0.016 | 1.248 0.012 |
| 0.75 | 0.454 0.002 | 0.s38 0.004 | 0.s11 0.010 | 1.192 0.015 |
| 1.00 | 0.403 0.014 | 0.492 0.010 | 0.4s6 0.014 | 1.134 0.009 |
| 7.25 | 0.350 0,004 | 0.433 0.015 | 0.418 0.003 | 1.101 0.012 |
| 1.s0 | 0.310 0.003 | 0.374 0.005 | 0.365 0.011 | 1.031 0.002 |
| 1.75 | 0.265 0.011 | 0.341 0.006 | 0.315 0.005 | 0.978 0.010 |
COMPLE,XING ACI'ION OF ]'HE, VARIOUS REAGENT MIXTURES
This was determined as follou's. T'hree solution were prepa.red (according to Proc. A or Proc. B) contr.ining a certain amount of zinc. The absorbancies \r/ere measured and the mean value taken as the absorbance A for that particular amoLrnt ol zinc in a final volume of 10 ml.
Then solutions $/crc prepared, containing; exactlv thc same amount of zinc, but added to this certain amounts of foreign ions, and these absorbancies A' measured. From the ditterence A - A': dA was then calculated the deviation in zinc content, dZn, based on the slope with a dA of 0.2 corresponciing to 1 ug of zinc in 10 ml solution. In Tables VI, VII and VIII the column undcr A gir.es the cieviations and B gives the ratio of foreign ion to zinc prcscnt.
A deviation, excecciing 1 ue of zinc is noted as 1 f .
TABLE VI. The deviation in the zinc found, caused by foreign ions, expressed as dZn, in ug of zinc per 10 ml solution.
| Foreign | ug per | (1 | .) | (2 | 2) | (3) | ) | (4 | ł) | (5 | 5) |
|---|---|---|---|---|---|---|---|---|---|---|---|
| ion | 10 ml | A | В | Α | В | A | В | A | В | Α | В |
| Ni | 250 | 0.4 | 100 | 0.7 | 40 | 0.01 | 40 | 0.00 | 40 | 0.12 | 40 |
| 25 | 0.2 | 10 | 0.05 | 4 | 0.04 | 4 | 0.05 | 4 | 0.03 | 4. | |
| 3 | 0.01 | 1 | 0.00 | 1 | 0.02 | 1 | 0.05 | 1 | 0.00 | 1 | |
| Cu | 660 | 1.0 | 250 | 1.0 | 100 | 1.1 | 100 | 0.38 | 900 | 0.9 | 100 |
| 66 | 0.9 | 25 | 0.6 | 10 | 0.7 | 10 | 0.20 | 9 | 0.5 | 16 | |
| 7 | 0.3 | 3 | 0.2 | 1 | 0.3 | 1 | 0.03 | 1 | 0.3 | 1 | |
| Fe (III) | 280 | 0.5 | 100 | 1+ | 50 | 1+ | 50 | 0.14 | 40 | 1+ | 50 |
| 28 | 0.2 | 10 | 0.08 | 5 | 0.1 | 5 | 0.06 | 4 | 0.12 | 5 | |
| 3 | 0.04 | 1 | 0.03 | 1 | 0.06 | 1 | 0.07 | 1 | 0.03 | 1 | |
| Hg (II) | 270 | 1+ | 100 | 0.8 | 50 | 0.7 | 50 | 0.5 | 40 | 1 + 1 | 50 |
| 27 | 0.5 | 10 | 0.7 | 5 | 0.4 | 5 | 0.4 | 4 | 0.45 | 5 | |
| 3 | 0.03 | 1 | 0.2 | 1 | 0.2 | 1 | 0.01 | 1 | 0.14 | 1 | |
| Cd | 50 | 0.3 | 20 | 0.1 | 9 | 0.05 | 9 | 0.34 | 8 | 0.3 | 9 |
| 5 | 0.07 | 2 | 0.05 | 1 | 0.00 | 1 | 0.03 | 1 | 0.02 | 1 | |
| 1 | 0.02 | 0.2 | 0.01 | 0.1 | 0.02 | 0.1 | 0.04 | 0.1 | 0.03 | 0.1 | |
| Co | 290 | 1 + | 100 | 1+ | 50 | 1+ | 50 | 1 + | 40 | 1 + | 50 |
| 29 | 1 + | 10 | 1 - | 5 | 1+ | 5 | 1+ | 4 | 1 + | 5 | |
| 3 | 1+ | 1 | 0.5 | 1 | 0.5 | 1 | 0.3 | 1 | 0.8 | 1 | |
| Мn | 350 | 0.3 | 140 | 0.06 | 60 | 0.04 | 60 | 0.14 | 50 | 0.15 | 60 |
| 35 | 0.0 | 14 | 0.01 | 6 | 0.08 | 6 | 0.08 | 5 | 0.06 | 6 | |
| 4 | 0.02 | 1 | 0.02 | 1 | 0.01 | 1 | 0.0 | 11 | 0.02 | 1 | |
| Ca | 220 | 0.1 | 80 | 0.02 | 30 | 0.03 | 30 | 0.04 | 30 | 0.06 | 30 |
| 22 | 0.03 | 8 | 0.01 | 3 | 0.0 | 3 | 0.01 | 3 | 0.0 | 3 | |
| 2 | 0.02 | 1 | 0.03 | 1 | 0.01 | 1 | 0.03 | 1 | 0.02 | 1 | |
| Ba | 420 | 0.07 | 160 | 0.05 | 70 | 0.00 | 70 | 0.01 | 60 | 0.12 | 70 |
| 42 | 0.02 | 16 | 0.02 | 7 | 0.07 | 7 | 0.03 | 6 | 0.04 | 7 | |
| 4 | 0.01 | 2 | 0.03 | 1 | 0.02 | 1 | 0.01 | 1 | 0.03 | 1 | |
| Мg | 110 | 0.12 | 50 | 0.01 | 20 | 0.04 | 20 | 0.08 | 20 | 0.01 | 20 |
| 11 | 0.02 | 5 | 0.03 | 2 | 0.02 | 2 | 0.03 | 2 | 0.04 | 2 | |
| 1 | 0.0 | 0.5 | 0.02 | 0.2 | 0.02 | 0.2 | 0.04 | 0.2 | 0.03 | 0.2 | |
| РЪ | 1100 | 0.0 | 420 | 0.02 | 180 | 0.01 | 180 | 0.03 | 150 | 0.01 | 180 |
| 110 | 0.0 | 42 | 0.01 | 18 | 0.04 | 18 | 0.01 | 15 | 0.04 | 18 |
| Foreign | ug per | (1 | ) | (2 | 2) | (3 | 5) | (4 | ) | (5 | 5) |
|---|---|---|---|---|---|---|---|---|---|---|---|
| ion | 10 m | A | В | A | В | A | В | A | В | A | В |
| 11 | 0.0 | 4 | 0.01 | 2 | 0.02 | 2 | 0.02 | 2 | 0.01 | 2 | |
| Bi | 1300 | 0.05 | 500 | 0.04 | 200 | 0.07 | 200 | 0.06 | 170 | 0.01 | 200 |
| ļ | 130 | 0.03 | 50 | 0.03 | 20 | 0.12 | 20 | 0.09 | 17 | 0.17 | 20 |
| 13 | 0.02 | 5 | 0.06 | 2 | 0.04 | 2 | 0.04 | 2 | 0.02 | 2 | |
| A1 | 100 | 0.02 | 40 | 0.04 | 16 | 0.01 | 16 | 0.04 | 13 | 0.02 | 16 |
| 10 | 0.02 | 4 | 0.01 | 2 | 0.03 | 2 | 0.0 | 1 | 0.02 | 2 | |
| Sn (IV) | 1100 | 0.01 | 420 | 0.02 | 180 | 0.03 | 180 | 0.04 | 150 | 0.04 | 180 |
| 110 | 0.0 | 42 | 0.0 | 18 | 0.04 | 18 | 0.06 | 15 | 0.02 | 18 | |
| 11 | 0.0 | 4 | 0.03 | 2 | 0.02 | 2 | 0.02 | 2 | 0.01 | 2 | |
| Fe (II) | 620 | | _ | 1 +- | 100 | 1 + 1 | 100 | 1+ | 80 | 0.9 | 100 | |
| 62 | | _ | 1 + | 10 | 0.3 | 10 | 0.9 | 8 | 0.4 | 10 | ||
| 6 | | _ | 0.4 | 1 | 0.3 | 1 | 0.2 | 1 | 0.1 | 1 |
Sn (II), in amounts of 11, 110 and 1100 ug: large deviations, solution decolorized. J<sup>-</sup>, in amounts of 13, 130 and 1300 ug: large deviations, solution, decolorized.
\(S_2O_3^{2-}\), in amounts of 10, 100 and 1000 ug: large deviations, solution decolorized.
Notes: (1) = used reagent mixture of Expt. 5 and taken 2.62 ug of zinc.
(2) = used reagent mixture of Expt. 10 and taken 6.0 ug of zinc.
(3) = used reagent mixture of Expt. 12 and taken 6.25 ug of zinc.
(4) = used reagent mixture of Expt. 14 and taken 7.5 ug of zinc.
(5) = used reagent mixture of Expt. 15 and taken 6.0 ug of zinc
The Table shows, that the interference of:
- 1. copper, iron (III) and mercury (II) is relatively small in the citrate buffers. This may be due to the citrate itself, but also to the higher pH of these buffers.
- 2. cadmium is the smallest in tartrate buffers.
- 3. cobalt can not be eliminated by any of the buffers mentioned above, even in equal amounts as zinc.
To investigate the influence of pH, reagent mixtures were prepared containing all three complexing agents, 0.5 mole tartaric acid +0.5 mole citric acid and 0.13 mole oxalic acid per liter. Solutions of varying pH were prepared by adding varying amounts of selid sodium carbonate to portions of this solution. With these solutions the influence of interfering ions was determined in Expt. 17 and the results compiled in Table VII.
TABLE VII. The deviations caused by foreign ions at various pH's, expressed as dZn, in ug of zinc per 10 ml solution.
| Foreign | ug per | pH : | = 1.4 | pH : | = 3.0 | pH : | = 3.8 |
|---|---|---|---|---|---|---|---|
| ion | 10 ml | A | В | Α | В | A | В |
| Cd | 1000 | 1 + | 200 | 1 + | 160 | 0.103 | 140 |
| 100 | 0.67 | 20 | 0.9 | 16 | 0.063 | 14 | |
| 10 | 0.03 | 2 | 0.01 | 2 | -0.08 | 2 | |
| Hg(II) | 1000 | 1 + | 200 | 1+ | 160 | 1 + | 140 |
| 100 | 1 + | 20 | 1+ | 16 | 0.89 | 14 | |
| 10 | 0.36 | 2 | 0.03 | 2 | -0.65 | 2 | |
| Cu | 1000 | 1 + | 200 | 0.55 | 160 | 140 | |
| 100 | 0.19 | 20 | 0.39 | 16 | — 1.40 | 14 | |
| 10 | 0.03 | 2 | 0.06 | 2 | 1.55 | 2 | |
| Со | 1000 | 1 + | 200 | 1.55 | 160 | 1.16 | 140 |
| 100 | 1 + | 20 | 1+ | 16 | — 1.29 | 14 | |
| j | 10 | 1+ | 2 | 0.47 | 2 | 0.27 | 2 |
| Ni | 1000 | 0.15 | 200 | 0.03 | 160 | 0.67 | 140 |
| 100 | 0.04 | 20 | 0.04 | 16 | 0.03 | 14 | |
| 10 | 0.05 | 2 | 0.03 | 2 | 0.05 | 2 | |
| Fe(III) | 1000) | larce o | leviation | solution | decolori | 7.54 | |
| 100 ) | large | eviamon, | 1 | decoloriz | 200 | ||
| 50 | _ | 0.07 | 8 | 0.29 | 8 | ||
| 10 | 1 + | 2 | - | 2.78 | 2 | ||
| Ма | 1000 | 0.08 | 200 | 0.03 | 160 | 0.06 | 140 |
| 100 | 0.07 | 20 | 0.0 | 16 | 0.04 | . 14 | |
| 10 | 0.03 | 2 | 0.02 | 2 | 0.02 | 2 | |
| Pb | 1000 | 0.03 | 200 | 0.00 | 160 | 0.00 | 140 |
| 100 | 0.09 | 20 | 0.01 | 16 | 0.03 | 14 | |
| 10 | 0.00 | 2 | 0.02 | 2 | 0.03 | 2 | |
| 100 | 0.03 | 20 | 0.03 | 16 | 0.01 | 14 | |
| 10 | 0.02 | 2 | 0.01 | 2 | 0.03 | 2 | |
| Bi | 1000 | 0.04 | 200 | - 0.04 | 160 | 1.16 | 140 |
| 100 | 0.02 | 20 | 0.01 | 16 | 0.77 | 14 | |
| - 10 | 0.03 | 2 | 0.01 | 2 | 0,61 | 2 | |
| Sb | 1000 | 0.31 | 200 | 0.05 | 160 | - 0.11 | 140 |
| 100 | 0.23 | 20 | 0.01 | 16 | 0.08 | 14 |
| Foreign | ug per | рН | 1.4 | pН | 3.0 | рН | 3.8 |
|---|---|---|---|---|---|---|---|
| ion | 10 ml | Α | В | A | В | A | В |
| 10 | 0.00 | 2 | 0.01 | 2 | 0.05 | 2 | |
| As | 1000 | 0.71 | 200 | 0.10 | 160 | 0.16 | 140 |
| 100 | 0.30 | 20 | 0.03 | 16 | 0.02 | 14 | |
| 10 | 0.09 | 2 | — 0.03 | 2 | 0.00 | 2 | |
| Al | 1000 | — 0.17 | 200 | 0.03 | 160 | 0.79 | 140 |
| 100 | 0.08 | 20 | 0.03 | 16 | 0.04 | 14 | |
| ] | 10 | 0.02 | 2 | 0.02 | 2 | 0.02 | 2 |
| Be | 1000 | 0.07 | 200 | 0.15 | 200 | 0.19 | 140 |
| 100 | 0.08 | 20 | 0.06 | 20 | 0.36 | 14 | |
| 10 | 0.03 | 2 | 0.01 | 2 | 0.00 | 2 | |
| Mg | 1000 | 0.0 | 200 | 0.04 | 160 | 0.08 | 140 |
| [ ] | 100 | 0.02 | 20 | 0.04 | 16 | 0.05 | 14 |
| 10 | 0.05 | 2 | 0.01 | 2 | 0.02 | 2 | |
| Ca | 1000 | 0.09 | 200 | 0.00 | 160 | 0.01 | 140 |
| 100 | 0.09 | 20 | 0.03 | 16 | 0.02 | 14 | |
| 1 | 10 | 0.03 | 2 | 0.02 | 2 | 0.02 | 2 |
| Ba | 1000 | 0.01 | 200 | 0.13 | 160 | 0.12 | 140 |
| 100 | — 0.06 | 20 | 0.01 | 16 | 1.51 | 14 | |
| 10 | 0.02 | 2 | 0.01 | 2 | 0.00 | 2 | |
| Li | 1000 | 0.24 | 200 | 0.00 | 160 | 0.38 | 140 |
| 100 | 0.05 | 20 | 0.00 | 16 | 0.01 | 14 | |
| 10 | 0.00 | 2 | 0.02 | 2 | 0.01 | 2 |
The Table shows the pH of 3 to be the most favorable. Large errors occur at a pH of 3.8, the majority of them showing an incomplete reaction. The largest errors are caused by cobalt, mercury, copper and cadmium.
These were investigated more deeply and results are compiled in Table VII. These two Tables indicate, that nt pH = 3, none of the common ions interfere when present in the same amount as zinc. (zinc taken: \(6.0 \, \text{ug}\)). Cobalt interferes, when present in equal amounts as zinc.
Copper interferes, when present in twice the amount of zinc.
Mercury interferes, when present in three times the amount of zinc.
Cadmium interferes, when present in five times the amount of zinc.
Iron (III) interferes when present in ten times the amount of zinc.
All other ions, do not interfere in amounts up to 100 to 200 times the amount of zinc.
TABLE VIII. Interference by cobalt, copper, mercury and cadmium. at pH 3.0
| ug per 10 ml | Α | В | Foreign ion | ug per 10 ml | Λ | В |
|---|---|---|---|---|---|---|
| 50 | 0.16 | 10 | Со | 30 | 1.94 | 6 |
| 30 | 0.03 | 6 | 20 | 1.16 | 4 | |
| 20 | 0.03 | 4 | 10 | 0.47 | 2 | |
| 10 | 0.01 | 2 | 5 | 0.09 | 1 | |
| 50 | 0.62 | 10 | Cu | 550 | 0.25 | 10 |
| 30 | 0.15 | 6 | 30 | 0.19 | 6 | |
| 20 | 0.09 | 4 | 20 | 0.16 | 4 | |
| 10 | 0.03 | 2 | 10 | 0.05 | 2 | |
| per 10 ml | 50 30 20 10 50 30 20 | per 10 ml | per 10 ml A B 50 0.16 10 30 0.03 6 20 0.03 4 10 0.01 2 50 0.62 10 30 0.15 6 20 0.09 4 | per 10 ml A B Foreign ion 50 0.16 10 Co 30 0.03 6 6 20 0.03 4 4 10 0.01 2 50 50 0.62 10 Cu 30 0.15 6 6 20 0.09 4 4 | per 10 ml A B Foreign ion per 10 ml 50 0.16 10 Co 30 30 0.03 6 20 20 0.03 4 10 10 0.01 2 5 50 0.62 10 Cu 550 30 0.15 6 30 20 0.09 4 20 | per 10 ml A B Foreign ion per 10 ml A 50 0.16 10 Co 30 1.94 30 0.03 6 20 1.16 20 0.03 4 10 0.47 10 0.01 2 5 0.09 50 0.62 10 Cu 550 0.25 30 0.15 6 30 0.19 20 0.09 4 20 0.16 |
Note: Column A gives the dZn and column B the ratio foreign ion to zinc.
An error of 0.1 of zinc is considered as "no interference", as to the amount of zinc taken, 6 ug, this represent an error of only 2%, which lies well within the experimental inaccuracies of the method used.
INFLUENCE OF THE pH ON THE CALIBRATION CURVES.
The values found at pH 3.8 in Expt. 17 indicated an incomplete reaction. To check this more fully, several 100 ml of the acid reagent mixture as in Expt. 17 were neutralized with varying portions of sodium carbonate so that solutions were obtained with varying phH's. Calibration curves were found for these reagent mixtures, using Procedure A, to avoid any influence of filtering.
Results of this Expt. 18 are compiled in Table IX.
TABLE IX.
Influence of pH on the calibration curves. Procedure A, absorbancies of the residual MB at 666 mu, 1 cm cell.
| РН | |||||||||
|---|---|---|---|---|---|---|---|---|---|
| ug zinc | 2,30 | 2.52 | 2.80 | 2.95 | 3.28 | 3.51 | 4.05 | ||
| 0.00 1.25 2.50 3.75 5.00 6.15 7.50 8.75 | 1.733 1.524 1.321 1.087 0.873 0.602 0.379 0.297 | 1.710 1.493 1.287 1.048 0.821 0.562 0.384 0.315 | 1.625 1.400 1.230 0.975 0.731 0.524 0.399 0.347 | 1.608 1.373 1.117 0.900 0.697 0.483 0.322 0.326 | 1.547 1.316 1.073 0.854 0.631 0.493 0.407 0.359 | 0.879 0.883 0.870 0.757 0.588 0.475 0.402 0.355 | 0.830 0.714 0.701 0.648 0.565 0.585 0.520 0.466 | ||
When calibration curves are constructed according to the Table, these will appear to be parallel up to pH = 3.28, but at pH's of 3.51 and 4.05 large irregularities will appear, indicating that the highest pH value usable is 3.3.
PRECISION OF THE METHOD.
A reagent mixture was prepared as in Expt. 17 and a multiple determination was carried out, in which for each certain amount twentyfour samples were prepared. Details are given in Table IX. In this Expt. 19 the calibration graph was found from the values of zinc taken and the malnevalue, \(\Lambda_{\rm m}\), of the absorbancies found.
From this calibration graph was found the most probable value for the absorbance, \(A_{graph}\). The deviations, \(\triangle A\), found and the standard deviation, dA, are based on this value \(A_{graph}\).
The standard deviation dA is of the magnitude 0.05 to 0.1 ug of zinc.
TABLE IX
Precision of the method, with a reagent mixture of pH 3.05 \(A_{\rm m}\) is the mean of 24 measurements.
| ug of zinc taken | 8.75 | 7.50 | 6.25 | 5.00 | 3.75 | 2.50 | 1.25 | 0.00 |
|---|---|---|---|---|---|---|---|---|
| Am | 0.215 | |||||||
| \(\Lambda_{\rm graph}\) | 0.215 | 0.425 | 0.679 | 0.933 | 1.190 | 1.446 | 1.703 | 1.969 |
| dZn | 0.1 | 0.03 | 0.05 | 0.05 | 0.05 | 0.05 | 0.09 | 0.12 |
The Table shows that the standard deviation is of the magnitude 0.05 to 0.1 ug of zinc, so in the determination of the interference by foreign ions the limit of "no interference" was taken as 0.1 ug zinc. The greatest deviations occur at the lower and higher zinc concentrations and in the middle of the range determinable the relative standard deviation is of the magnitude 1%.
Below a zinc content of 2 ug per 10 ml the relative standard deviation becomes large, at 1.25 ug zinc it is about 10%.
At higher zinc concentrations the standard deviation increases, but the relative standard deviation remains of the magnitude 1 to 2%.
So with the standard Beckman equipment the range determinable is 2-8 ug of zinc with a precision of about 1%. However, with procedure \(\Lambda\) this method can be readily adapted to semi micro or micro techniques as no separation procedures, either extraction or filtrations, are required. Using semi micro Beckman cells the total volume can be decreased to 0.1 or 1 ml and with micro equipment to even less. The amounts of zinc determinable are then 0.02-0.08 or 0.2-0.8 ug of zinc.
In Expt. 19 was found that a \(\triangle A\) of 0.205 corresponds to 1 ug of zinc, this giving a sensitivity (5, 0p. 47) of 0.0005, while the corresponding sensitivities with the dithizone and di-2-naphthylthiocarbazene methods are respectively 0.0016 and 0.0006 ug (5).
For comparison, the factures of the more commonly used photometric determinations of zinc and this MB are compiled in Table X.
USE OF OTHER PHOTOMETERS.
Leitz compensating photometer. The Leitz filter No. 620 was used with absorption cells of various lightpath's depending on the intensity of the color. A straight calibration graph was found, but of a slope less than with the Beckman and a \(\triangle A\) of 0.11 corresponds to 0.13 ppm of zinc.
Coleman Universal Spectrophotometer. Used at 666 mu with 13 mm rectangular cells. The straight calibration curve has a slope of \(\triangle A\) 0.13 corresponding. to 0.1 ppm of zinc.
Lumetron photometer. No filter other than the Lumetron No. 650 was available. As this wavelength lies just on the slope of the absorption spectrum of MB deviations from Beer's law could have been expected; these were indeed found.
VISUAL COMPARISON.
Procedure B could be readily adapted to the standard series method, using metched 18 mm Pyrex testtubes. A MB standard can be used, but
TABLE X. Comparison of the MB method with the more important methods of determination of zinc.
| Method | МВ | Dithizone, A: mixed color B: mono color. | Zincon (4) | \(\alpha, \beta, \gamma, \delta_{-\text{tetra}}\) phenylporphine (1) |
|---|---|---|---|---|
| Range | 0.5 — 2 ug/10 ml | 5— 30 ug (2) A: 1 — 5 ug/5 ml CHCl3 (5) (0.2 — 1 ppm) B: 5-ugOing/0 — 25 ml CHCl3 (5) (0.2 — 0.5 ppm). | 25 — 100 ug/50 ml (0.5 — 2.0 ppm) | 10 — 60 ug/25 ml 0.4 — 2.4 ppm) |
| Precision | 0, ug, 1 % | 0.2 ug (2), 1% | 0.5 ug, 1% | 1 ug, 2% |
| Sensitivity (ug) | 0.0005 | 0.0016 (dithizone) 0.0006 (di-2-naphthylthiocarba- zone) | 0.003 | 0.0045 |
| Procedure | Sample mixed with MB-buffer- complexing agents mixture. NaCNS added. After 55 min. filtered (can be omitted). After 60 min, absorbance measured against water. | Mixed color (A). Sample buffered, complexing agents added and extracted with dithizone in CHCl3. Absorbance measured against CHCl3 Mono coler (B). Sample buffered, complexing agents added and zinc extd. with dithizone in CHCl3 Excess dithizone washed out, diluted and absorbance measured. | To sample added buffer and zincon reagent. Diluted to 50 ml, mixed well and absorbance measured against a reagent blank. Zincon very expensive. | To sample added reagent in glac, acet, acid and diluted to 25 ml with same. Absorbance measured after one hr. against acet, acid. Reagent not readily available. |
| Apparatus | Any photometer with th | Visual colorimetry possible | with first two. | |
| Interferences | None of the common ions in a- 1:1 ratio = Cu and Co only in large amounts. | A. Most of the common ions, copper even in small amounts. B. Practically free from interference, slight interference by cadmium | Many of the common ions, even in a 1:1 ratio | Copper, nickel, cobalt and iron (II) |
a solution of copper in a buffer composed of 0.5 F acetic acid and 0.5 F sodium acetate was found to be a satisfactory and completely stable standard. The standards were adjusted by comparison with colors of solutions with known zinc content and increments of 0.64 mg of copper per ml corresponded to 0.1 ppm of zinc. Although errors up to 10% occured, this visual method should be useful for some purposes.
SUMMARY.
In the method developed here zinc is determined by reacting with methylene blue and thiocyanate at pH 3 in a buffer composed of 0.5 mole tartaric acid, 0.5 mole citric acid and 0.13 mole oxalic acid per liter, neutralized with solid sodium carbonate to pH 3. The complex formed is filtered off, and the resulting decrease in absorbance of MB corresponds to the zinc present. The method is simple and highly sensitive. None of the common interferes in amount comparable to zinc and only copper and cobalt interfere when present in a more than 1:1 ratio. Cadmium and mercury begin to interfere in a 5:1 ratio.
A method for visual comparison has been worked out. The method can readily be adapted to semi micro and micro methods.
REFERENCES.
- 1. Banks, C.V. and Bisque, R.E., Anal. Chem. 29, 552 (1957).
- Charlot, G. and Bezier, D., "Quantitative Inorganic Analysis". John Wiley & Sons. Inc., New York, 1957.
- 3. Isjrin Noerdin, I.T.B. Proceedings, in print.
- 4. Rush, R.M. and Yoe, J.M., Anal. Chem. 26, 1345 (1954).
- Sandell, E.B., "Colorimetric determination of traces of metals" 2nd, ed., Interscience, New York, 1950.