

INTRODUCTION
..Y
I
It is a problem of considerable interest in the study of galactic structure, to determine whether the dB (dB8-dA2) and gK (gG8-gK2) stars occupy approximately the same position in space. In the anti-center direction McCuskey (L967) has found
:t) " Contributj-on from the Bosscha Observatory, No.46, L973.
that the B8-A0 main sequence stars and the G8-K3 giant stars decline in numbers per unit volume beyond \(400~\rm pc\). from the sun. But the B8-A0 group seems to reach a maximum space density at 300 to \(400~\rm pc\).
In a preliminary study of the distribution of dB and gK stars in the direction of the galactic center, at \(b = + 11^{\circ}\), Hidayat (1970) indicated that a correlation between space densities of B8-A2 stars and gG8-gK2 stars may exist.
The present study is aimed at determining the run of stellar space-density of the same groups of stars, in the direction of the galactic-center, at \(b = -10^{\circ}\). The results of the present study, when combined with earlier results for approximately the same galactic longitudes should be able to provide the information on the cross sectional distribution of stars in the plane perpendicular to the galactic in the galactic-center direction.
Currently, a study on the distribution of giant M stars is being made. A report on their distribution will be the subject of a subsequent paper.
OBSERVATIONAL DATA
Studied Area
The area of the sky chosen for the study is the Palomar-Groningen Variable-Star Field 3 (R. A. \(18^{\rm h}\) \(25^{\rm m}\); Dec. \(-33^{\circ}\); \(\ell=0.8\); \(\ell=0.8\); \(\ell=10^{\circ}\)). The total area covered approximately 25 sq. deq. It has been known by Plaut (1968), and by Wehinger and Hidayat (1973) that the area has a low and uniform interstellar absorption. Figure 1 shows the region under study, reprinted from a visual Bosscha-Schmidt Plate.
Spectra
Spectra of the stars were classified on 3 Kodak IIa-O plates taken with a 6° objective prism mounted on the 20-28-in. Schmidt telescope of the Bosscha Observatory. The exposure times were 2, 45 and 60 min. The dispersion of the spectra is 312 Å/min. at \(\rm H_{\gamma}\). Spectra were widened 0.20 mm. The criteria used in classifying the spectra are those given by Nassau and Seyfert (1946) and by Nassau and van Albada (1947).
The present authors classified common stars (65 stars) chosen at random at the beginning of the study. The results show that there is no systematic differences between the two classifications, within the spectral ranges included in the present study. An error of \(\pm\) 1.4 MK subdivisions is estimated from the comparison with catalogued spectra. A limiting mag-
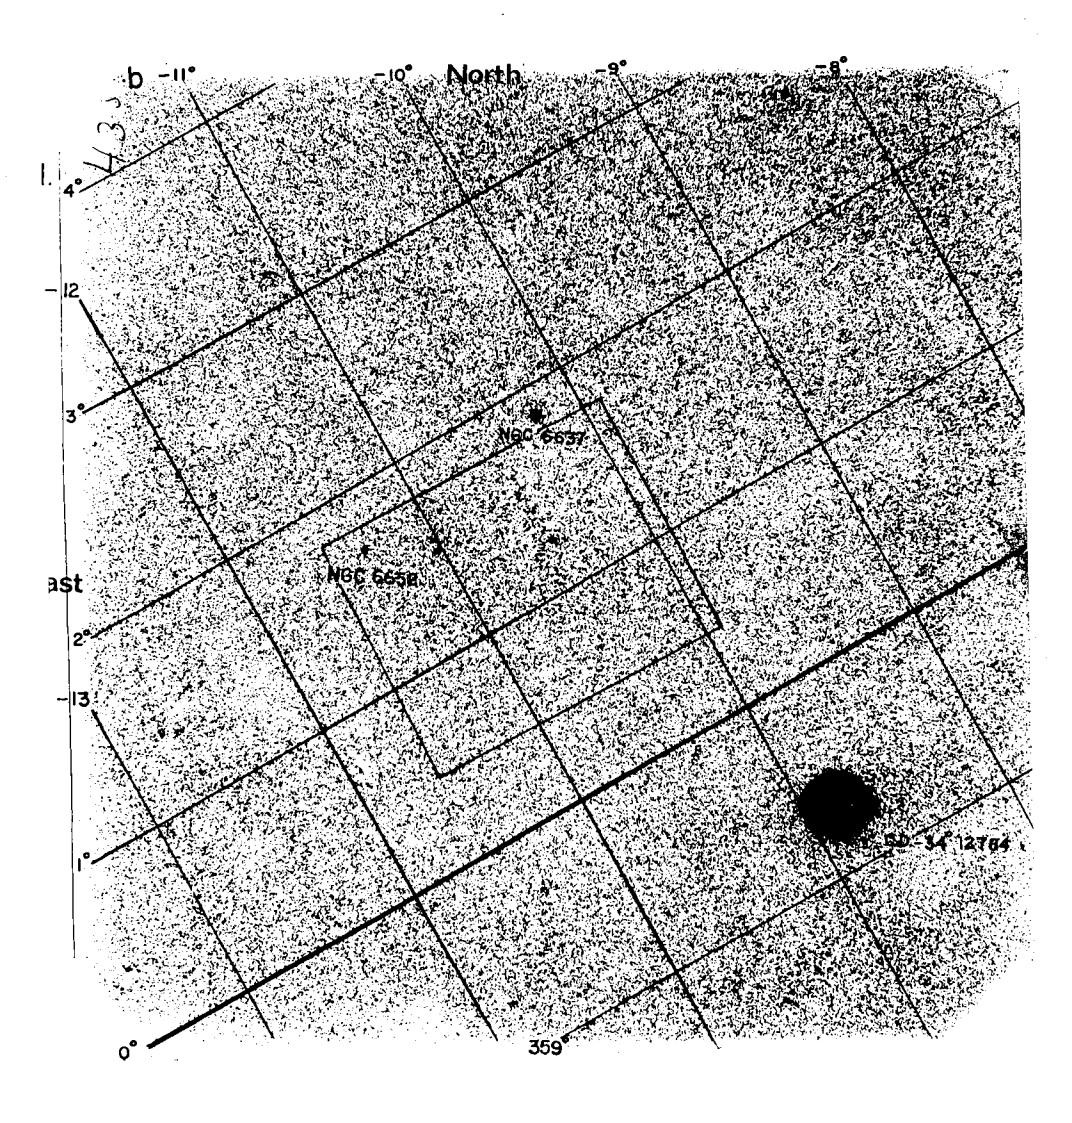
Figure 1. Palomar-Groningen Field No. 3. Reproduced from a visual plate obtained with the Bosscha Schmidt Telescope. Grids show galactic longitude and latitude.
nitude of approxinately npg = 12.8 \ras reached. 348 dB and 314 gK stars have been classified.
Photometry
V and B uragnltudes on the system of Johnson and Morgan (1953) were obtalned from three Kodak 103a-D pl-ates taken through a Schott GG 11 filter and three Kodak IIa-O pJ-ates taken through a Schott GG L3 filter. Al-1 the plates were obtained with the Bosscha Schrnidt Telescope tn 1966. All- stars for which spectra had been classlfled were measured on each of the pLates with Elchner Astrophotometer of the Bosscha 0bservatory
The photoelectric sequence used to callbrate the astrophotometer readlngs for each plate, is the sequence establlshed by Wehinger and Itidayat (1973). These stars have been carefully photographed in the center of the field under study.
In the present study attenpt has not been made to study the radlal effect of the rnagnitude determinatlons. For each plate the astrophotometer readings were fitted to the observed nagnitudes by a curv ' of a thtrd degree polynomlals.
The ranges of the magnltude measurements of the program stars were used to estlmate the error according to the method described by Schlesinger (1937). In the flnal catalogue of uagnltude of stars of the present study a probably error of + 0P09 and + 0T10 for V and B-V respectively are attached.
INTERSTELLAR ABSORPTION
An inspection on the deep red blue Bosscha Schmidt photometrlc plates of the area does not shor^7 any appreciable patchiness of surface distribution of interstell-ar materlal. We therefore assume that the same variation of interstellar absorption wi.th distance is appllcable throughout the area. The evaluation of the lnterstellar reddening has been made from photoelectric data given by Wehinger and Hidayat (1973).
For each photoelectric sequence stars MK spectral types have been asslgned. These spectra have been determined from the spectral plates obtained with the Bosscha Schmldt telescope. An assumption that the stars are of luminosity class V was made. Using absolute visual magnitudes and lnstrlsice colors calibrated by Blaauw (1963) and Fitzgerald (1970) the color excesses for each stars can readj-ly be calculated. The resulting values of E3-y are then plotted as a functl-on of the distance modulus.
Figure 2 shows the run of the color excess versus the uncotreeted distance modulus of the photoelectric sequence
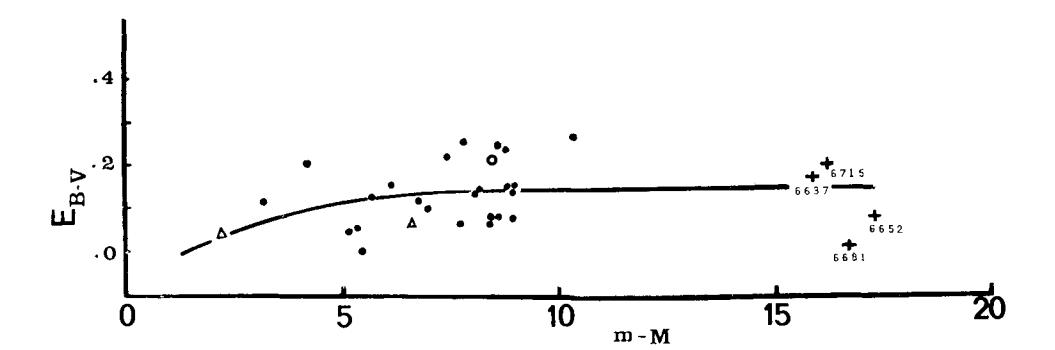
Figure 2. The run of interstel-lar reddening as the function of uncorrected distance modulus (sec text).
stars. In order to delineate the absorption at large distances the data for the cluster NGC 6637, 6652 and 6581, given by Kron and Mayall (1960) have been incorporated. It can be seen from FIg. 2 that the color excess increases slowly-from almost zero in the solar neighborhood to approximately O'l'1 at uncorrected distance rnodulus of 5. Peyond this polnt the reddening remains constant at Eg-y = O'j'12. Fitzgeral-d (1968) in his study of_distribution interstel-l-ar reddening material has found Ey ! OTfg at least up to r = 3 kpc for areas close to the field of the present study. In the following discussions a ratlo of 3 between the total visual absorption to the excess in B-V was adopted. Table I gives the variation of absorptlon as the functlon of distance.
Table I Total absorption ln the dlrection of Field 3
| (kpc) r | Av |
|---|---|
| 0.05 | oTr+ |
| 0.20 | o. 3 6 |
| 0.30 | 0.37 |
| 0.40 | 0.38 |
| 0.50 | o. 3 9 |
| 1.00 | 0.39 |
DISTRIBUTION OF STARS
A summary of the star counts for each \(0^m.5\) intervals in the surveyed area is represented in Table II. The lack of bright gK stars is rather obvious. But the drop in number beyond m = 12.5 may be due to the incompleteness of the survey, fainter than \(m_{pg} = 12.5\). Variation in the surface distribution of dB stars (B8-A0) has been noted by McCuskey (1965). The surface density found in the present study is approximately 14 B8-A2 stars per square degree. In the direction of \(\ell\) = 0, the surface density of B8-A0 alone, according to McCuskey (1965), reaches \(\ell\) stars per square degree. It is, therefore, expected that the surface density of B8-A2 stars would be larger than
Table II Observed distribution of dB and gK stars
| \(^{\rm m}{}_{\rm B}\) | dB | gK |
|---|---|---|
| 6.25 | 3 | _ |
| 6.75 | 3 | - |
| 7.25 | 8 | - |
| 7.25 | 6 | 1 |
| 8.25 | 15 | 8 |
| 8.75 | 23 | 10 |
| 9.25 | 32 | 18 |
| 9.75 | 48 | 26 |
| 10.25 | 48 | 36 |
| 10.75 | 55 | 49 |
| 11.25 | 40 | 55 |
| 11.75 | 40 | 43 |
| 12.25 | 21 | 36 |
| 12.75 | 5 | 26 |
| 13.25 | - | 6 |
that detected in Field 3. In his study of SA 158 (&=3.9, \(b=-9^{\circ}\)) McCuskey (1970) found a surface density of approximately 13 stars per square degree down to a limiting magnitude of 12.5. Assuming there exist a systematic difference in the spectral classification, the numbers of stars found in the two surveys are comparable.
From the frequency dlstribution shor,m in Table II, the ratio of the numbers of gK to dB stars can be shown to increase with increasi-ng apparent magnituda. Due to the absence of gK stars brighter than m = 8.00, the ratio at the brightend of the survey for these groups of st,ars hras not cornputed. In logarithruic scale the ratio of the number of gK stars (N gK) to the number of dB stars (N dB) is shown in Figure 3, together wlth the results obtained by McCuskey (1963) for SA 158 and by Weaver (1970) for Lacerta 0B 1-Associati.on. In absolute number the results for FieLd 3 of the present study is comparable t.o that of SA 158. However, they are being smaller than the value found in Lacerta 0B 1. The fact that in Weaver's analysis (1970) the K3 and 43 stars were included in N (K) and N (B) may explain part of the difference. Anorher reason may be caused by a "latitude-effectrt. There seems to be no dlfference in the trend of increase of the ratio of N (gf) to N (dB) in both galactic latitudes discussed here.
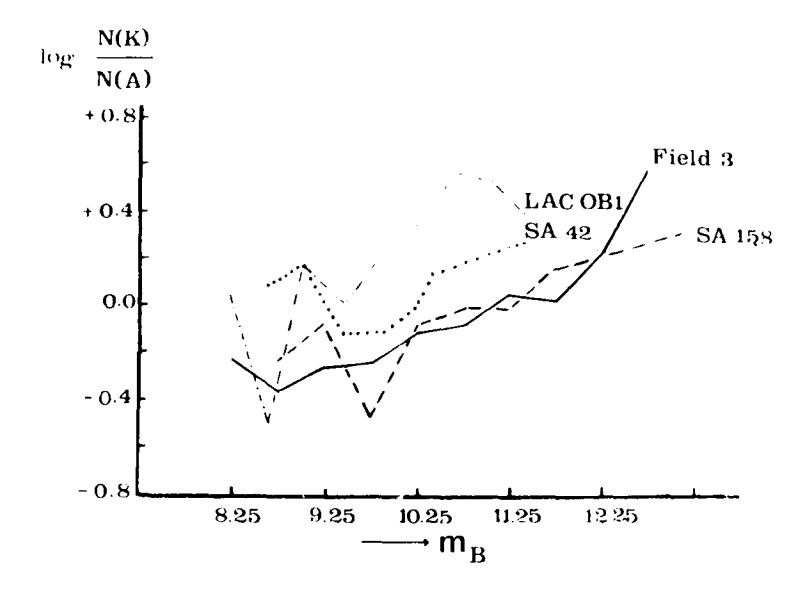
stars to B stars in various The result of the present the results obtained bv Wea-Figure 3. The ratlos of glant K galactic longltudes. study is superposed on ver (1970).
The space densities of dB and gK stars were evaluated using the Malmquist method. In the space-density calculation the urean absolute visual magnitudes of 0.7 and 0.8 for dB and gK groups, respectively, were adopted. In both cases a dispersion in absolute magnitude of \(\sigma_M\) = 0.8 was used. The absolute visual magnitude for dB stars adopted here is fainter than the newly published results by McCuskey and McMillan (1973).
The resultant space-dencities, corrected for interstellar absorption, the run of which is shown in Table I, is given in Table III. The correction was carried out in the manner described by Seeliger.
For the purpose of comparison, the results for Field 2 and SA 158 are given in Table III. The data suggest that, if the result for \(r=100~\rm ps\) in the direction of Field 3 can be considered accurate, a large concentration of dB and gK stars may exist at the distances between \(150-250~\rm pc\). Earlier, high concentration of dB stars has also been detected at approximately the same distance range by McCuskey (1946) in SA
Table III Space densities for dB and gK stars in Field 3, shown with other results (expressed in stars per \(10^5~{\rm pc}^3\)).
| r | Fiel - 1 | Fiel + | d 2(1) 11° | G. Center direction (2) | |
|---|---|---|---|---|---|
| (pc) | dB | gK | dB | gK | B8 - A0 |
| 100 | 41 | 21 | _ | - | 20 |
| 150 | 59 | 40 | - | 26 | |
| 200 | 49 | 42 | 42 | 64 | 28 |
| 250 | 44 | 40 | 25 | 49 | 25 |
| 300 | 33 | 35 | 19 | 32 | 19 |
| 350 | 27 | 30 | 16 | 28 | - |
| 400 | 23 | 26 | 14 | 25 | 16 |
| 500 | 15 | 18 | 9 | 19 | - |
| 750 | 8 | 11 | 7 | 16 | - |
| 1000 | 4 | 6 | 7 | 19 | 3 |
| 1500 | 1 | 3 | 4 | (16) | 2 |
(1) obtained by Hidajat (1970)
158 and by Hidayat (1970) in Field 2. A rather steep decline in the space density function is observed beyond the distance of 250 pc.
(2) " by McCuskey (1970).
In order to exhibit the density variation with respect to the distance from the galactic plane, the r-values in Table III were transformed into z-values. Here z is the distance from the galactic plane. The density variation with z is shown in Table IV. Again the results obtained by McCuskey (1964) for B8-A0 stars in the direction of SA 158 is smaller.
Table IV Space-density variation with distance from the galactic plane (expressed in stars per \(10^5~{\rm pc}^3\)).
| Ž | Field 3 \(l = 0.8\) b = -10° | Field 2 \(k = 4^{\circ}\) b = -10° | SA 158 \(k = 4^{\circ}\) \(b = -9^{\circ}\) | ||
|---|---|---|---|---|---|
| (pc) | dВ | gK | dB | gK | B8 - AO |
| 50 | 39 | 38 | 25 | 40 | 19 |
| 75 | 21 | 26 | 14 | 27 | 15 · |
| 100 | 13 | 17 | 9 | 19 | 10 |
| 125 | 10 | 15 | 7 | 17 | 6 |
| 150 | 7 | 9 | 7 | 16 | 4 |
| 175 | 5 | - | 6 | - | 3 |
| 200 | 3 | - | 6 | _ | 2 |
This difference can probably be accounted for not including the A2 stars in McCuskey's analysis.
DISCUSSION
Regions of high stellar concentrations have been detected by several authors. Stegman and Fitzgerald (1972) found a marked increase of the density of B8-A0 stars in Vela (& = \(268^{\circ}\), b = -0.93), between the distances of 500 to 800 pcs. The maximum density found by Stegman and Fitzgerald is 30 stars per \(10^{5}\) pc<sup>3</sup>, as compared to 49 stars for the same unit ov volume found in the direction of Field 3. It would be interesting to compare the run of the ratio of gK to dB stars in these two galactic longitudes.
Another region with high stellar density distrlbution nas found by Drilling (1968), between^50O to 1000 pcs ln the dlrection of LF 15 ([ = 32998, b = -2".2). Similarly, Bok (1956) a high density zone in the direction of 9- = 2930, which is thought to be a brtdge between the loca1 and the Sagittarius arns. The results presented above, if compared to the results for the LF regions (Orilling 1968) suggest that probably the densities in the southern latitudes are 1-arger compared to the densities in the corresponding northern l-atitudes. Again the result for the field under the present study indlcate that l-ess B8-A2 stars are found in the soLar neighborhood, as compared to that in the zone of 150-250 pc. Thls result ls not in contradlction with the assertion that ol-der stars are 1ocated in the inner part of the arm, which is delineated by gas.
ACKI.IOWLEDGEMENTS
This study was possible due to the generousity of Dr. S. W. McCuskey, the Director of the Warner and Swasey Observatory, in Cleveland, USA, who provided the Bosscha Observatory with the photographic materlal needed in the present study. The authors would like to express thelr thanks for this invaluable help and for his interest.
Part of this study was supported by the ITB-PELITA Funds (I973-I974), Thls grant is gratefully acknowledged.