INTRODUCTION
Surface finish inspection of many products has been mainly done by random sampling inspections. The results are expected to represent the quality of the entire production output of certain kind. Quantitative measurements of the surface finish is given by means of knowing the rms. values of surface roughness \(\sigma\) and surface slopes m. For randomly roughened surface, \(\sigma\) is defined as the standard deviation of the surface heights' distribution. The values of the surface slopes m's are defined similarly, but for the tangents of the local slopes.
Mechanical measurements of surface - finish are commonly done by using a profilometer. This instrument uses a fine diamond stylus moved across the surface and thus follows the contour of the surface undulations, and its up and down movements are electronically amplified and integrated. The readouts are either rms. (root mean square) or arithmatic value of the surface roughness distribution. The rms. surface slopes m's are in this case obtained through a relationship between o's and the so called auto-correlation distance defined as the standard deviation of the statistical distance between the peaks of the surface asperities (7). Mechanical surface
roughness measurements, however, are limited to surfaces with undulations larger than the dimension of the profilometer's stylus. Moreover, this method is a destructive test in nature and is prohibitive in many applications.
Many precision type products, however, may require strict individual non-destructive type quality control inspection and more accurate techniques are therefore needed. Some examples of these products are, for instance, microminiature parts used in various gyroscopic components, various components used in the weapon systems, etc. The optical methods based on the theories of Davies (2) and Beckmann (3), can be developed into a more accurate method of surface finish inspection technique. Both theories can accurately calculate the rms. surface roughness, however, the application of Beckmann's theory to calculate the rms. surface slopes is still under continuing investigation with inconclusive results (4,5).
This paper presents two different optical methods to determine the quality of metal surface finish using a double-beam spectrophotometer. These methods have been successfully employed by Abdulkadir (4) and Abdulkadir and Birkebak (12).
THEORY
The theoretical models used to determine the surface roughness parameters are based on the assumption that the normalized bidirectional reflectance in the specular direction consist of a component contributed by the specular (coherent) reflectance and another component contributed by a diffuse (incoherent) term. Mathematically, Davies' theory is expressed as the spectral specular reflectance of any surface normalized by the spectral specular reflectance of polished surface of the same material, both taken at the same observation angle \(\Psi\),
\[-\left(\frac{4\pi \cos \Psi \sigma}{\lambda}\right)^{2}\] \[\frac{\rho_{s,\lambda}}{\rho_{sp,\lambda}} \simeq e + \frac{2^{5} \pi^{3}}{m_{o}^{2}} \left(\frac{\sigma_{o}^{4}}{\lambda}\right) \cos^{3}\Psi \Delta\omega \qquad (1)\] where \(\sigma_{_{O}}\) is the optical rms. roughness, \(\lambda\) is the wavelength used and \(\Delta\omega\) is the solid angle of observation. Beckmann's theory for the same condition gives, as presented by Houchens and Hering (6),
\[-\frac{4\pi \cos \Psi \sigma_{0}}{\lambda}^{2}\] \[\frac{\rho_{s,\lambda}}{\rho_{dh,\lambda}} \simeq e + f_{ic} \frac{\cos \Psi}{\pi}^{\Delta\omega} \qquad (2)\] where
\[f_{ic} = \pi^2 (\frac{1}{\lambda})^2 \exp \left[-(\frac{4\pi \sigma_0 \cos \Psi}{\lambda})^2 \sum_{n=1}^{\infty} \frac{(4\pi \frac{\sigma_0}{\lambda} \cos \Psi)^{2n}}{n(n!)}\right]\](3)
The specular reflectance has been normalized by directional reflectance \(\rho_{dh}(\Psi)\) of the roughened material. The first term on the right side of equation (1) and (2) is the specular (coherent) term and the second is the diffuse (non - coherent) term. The relationship between 1, the autocorrelation distance between the roughness' peaks and m, the rms. value of the surface slopes, has been shown by Bennett and Porteus (7) to be
\[1 = \frac{\sigma}{m} \sqrt{2}\] (4)
The dimensionless parameter \(\sigma_0/\lambda\) is called the optical roughness, and is a measure of the relative value of the surface roughness with respect to the wavelength involved. As \(\sigma_0/\lambda\) becomes smaller, there is a wavelength region beyond which one is not able to distinguish the surface asperities and the surface looks smooth. In this situation one expects the specular term to be a dominant factor in both Davies and Beckmann's equations. Inspection of both equations (1) and (2) verifies this observation, i.e. that their second terms can be neglected wrt. the first ones.
Therefore, for \(\sigma_0/\lambda\) << 1. Davies' equation simplifies to
\[\frac{\rho_{s,\lambda}}{\rho_{sp,\lambda}} \simeq \exp\left[-\left(\frac{4\pi\cos\Psi \sigma_0}{\lambda}\right)^2\right] \tag{5}\] and Beckmann's equation follows the same form. The normalized reflectance, \(\rho_{s,\lambda}/\rho_{s,\lambda}\) or \(\rho_{s,\lambda}/\rho_{dh,\lambda}\), are obtained experimentally and will be discussed later.
mentally and will be discussed later. Plotting \(-\ln (\rho_{\rm s,\lambda}/\rho_{\rm sp,\lambda})\) and \(-\ln (\rho_{\rm s,\lambda}/\rho_{\rm dh,\lambda})\) vs. \(1/\lambda^2\), one has a set of straight lines from the origin with the slopes equal to \(16\pi^2\cos^2\Psi\sigma_0^2\). With each element known except \(\sigma_0\), it can thus be easily calculated. \(\sigma_0\) is then used to calculate \(\sigma_0\). It can be seen, that for \(\lambda << \sigma_0\), the specular term can be neglected with respect to the diffusion term in equations (1) and (2). The normalized reflectance of both Davies and Beckmann forms can thus be expressed only in their diffusion terms, and m can be easily derived.
INSTRUMENTATION
The experiment was conducted using a Perkin-Elmer Model 621 spectrophotometer. The instrument is of a double beam type and is capable of spectral measurements from 2.5 to 50 \(\mu m\). The standard PE-621 spectrophotometer is usually employed to study the spectral transmittance or absorptance of any transparent material and also to do chemical composition analysis.
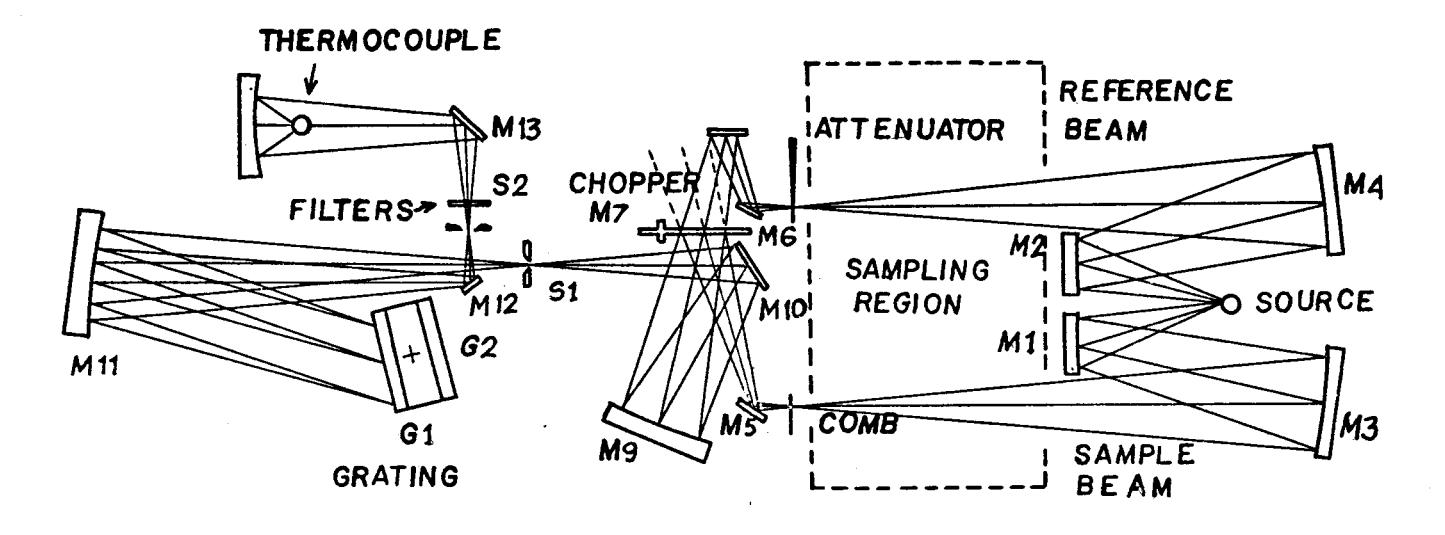
The optical diagram of PE-621 spectrophotometer is shown in Figure 1. A Nernst glower source output is divided into a sample and a reference beam. The sample beam passes through the sample compartment and the reference beam through an optical attenuator. Both beams are interrupted by a chopper, M7, which rotates at 13 cps. The chopper alternately transmits the energy from the reference beam and the sample beam toward a dual - grating monochromator (G1 and G2) through an entrance slit S1. The beams are dispersed into component frequencies and then focused on an exit slit. They then pass through a filter, as essentially monochromatic light, to a thermocouple detector. Any difference in the radiances of the sample and the reference beams result in an AC signal of 13 cps. in the form of radiant energy at the detector. This signal is used in the attenuation servo system to drive the optical attenuator in the direction that eliminates the difference of the beam radiances. The attenuator position is coupled to the pen drive system to move the pen proportional to the distance the attenuator is moved. More detailed information can be obtained from (4).
Modifications to the original alignment of source optics of the spectrometer were made for the measurements of the specular reflectance and tb.e he'nlspherlcal dlrecttonal- refl-ectance. The origlnal source optLcs for the reference and sample beern are aligned such that the Nernst glower source I.s always at their cormon polnt of focuses. Therefore, Lf the Nernst glower Is removed and the output from an external source ls focused at the point of the origlnal Location of the glower, the beam then can be directed towards mlrror Ml or M2, Figure I and the resultlng optLcal path w111 foll-ow the orlglnal lnternal optl-cal path. In order to uae external source, lt was therefore necesaary to cut a rectangular opening of about L0x15 cn. ln the rear slde of the metal cover of the aource optlcs to enable any externally orlglnated source to enter the sourcers optlcal compartment.
SPE CULAR REELECY AN CE WASUREMENT S
Figure 2 shoers the measurement for the specular reflectance measurements. The test sample waa attached to a specLal holder whlch in turn was nounted on a vertLcal shaft. The Nernst glower source, cirtgtnally lnstalled lnsLde the source compartment, was moved outside and wae used to lllunLnate the sample. The source wae installed about 165 cru toward the left slde and sltghtly behind the sample holder (F{gure 2). A spherical mlrror (no 1) of 75 m dtaneter and focal length of f = 200 mrn nas l.nscal1ed about 43 cn from the gLower and about 38 cn Ln front of the saurple. Radiant energy from the Nernst gLower was focused by thts mlTror ooto the saoplets surface. The soltd angle of the'lncldent bearo Aur was selected by partta1ly nasking the surface of rnlrror no L. By rotatLng the sample holder about Lts vertLcal axls, and adlustLng mirror no 2, the angle of LLlunlnatLon wrt. the nomal of the teat 6urface could be set at any deslred value. MLrror no 2 Ls a first surface alunlnlzed type and was posltloned at the specular refl-ectance angle. Its focal length and solid angLe of colLectLon wae the spme a8 mLrror no.L. Thls mLrror was 1ocated about 22 cm from the te6t sample and was orLented such that Lt woul-d focus the reflected beam exactly at the orLginal location of the Nernst glower Lnslde the conpagtment. The optics are adJusted so that the bean follorqs the origLnal path for the sampJ-e beam.
The reference beam was obtained by collectl.ng the tl,luuination from-the sarne Nernst glower by means of a 100 m dLameter, f = 20d m spherlcal ml.rror no 3, located about 46 cn fron the source. An apperture was placed on.no 3rs surface to cortrol the solld angle such that reasonable lnstrument readings were obtalned. The posltion and orlentatlon of mlrror no 3.were selected such that the radlation was focused at the origlnal locatlon or the Nernst glower and oriented al-ong the reference beam optical paths. The Nernst glower was operated at the recommended source current of 0.8 amperes.
Three separate wavelength scans were made to obtain the data necessary to determine the ratio of the specular reflectance of a roughened surface to that of a polished surface of the same material. The spectrophotometer outputs when a roughened surface, posithed surface or zero reading is made are respectively, \(\Delta(\mathbf{r})\), \(\Delta(\mathbf{p})\) and \(\Delta(\mathbf{z})\). The zero reading is made when the source is blocked off. The experimental results are evaluated by the following equation
\[\frac{\rho_{s,\lambda(\Psi)}}{\rho_{sp,\lambda(\Psi)}} = \frac{\Delta(r) - \Delta(z)}{\Delta(p) - \Delta(z)}\](6)
DIRECTIONAL REFLECTANCE MEASUREMENTS
The evaluation of the experimental data using Beckmann's equation requires the normalization of the specular reflectance by the directional – hemispherical reflectance value for the surface. In order to benefit from the data given previously as \(\rho_{\rm s,\lambda}/\rho_{\rm sp,\lambda}(\Psi)\), the present experiment was designed to obtain the result given by
\[\left[\frac{\rho_{s,\lambda}(\Psi)}{\rho_{sp,\lambda}(\Psi)}\right] / \left[\frac{\rho_{s,\lambda}(\Psi)}{\rho_{dh,\lambda}(\Psi)}\right] = \frac{\rho_{dh,\lambda}(\Psi)}{\rho_{sp,\lambda}(\Psi)}\](7)
In the case in which the incident radiation is diffusely distributed, it can be shown (8) that the directional - hemispherical reflectance can be replaced by its hemispherical -directional reflectance, provided the angle of illumination \(\Psi\) is equal to the angle of viewing \(\theta\). The right hand side of equation (7) can therefore be written as \(\rho_{\rm hd}\), \(\lambda^{(\Psi)}/\rho_{\rm sp}\), \(\lambda^{(\Psi)}\).
The integrating sphere reflectometer used was a hollow sphere coated in its innerside with a highly-diffusively reflecting material. The one used in this study was 100 mm diameter and made of copper. It had three openings on its wall: one for attaching the test sample, the second opening, 180° from the first one, is for the observation of the test sample.
The third opening, 90° from the other two, is for the illumination beam to enter the sphere, as shown in Figure 3. The innerside of the sphere was coated with Sauereisen potting cement which in turn was covered by glass beads of about 400 micrometers in diameter. The glass beads layer was finally vacuum-coated with a film of evaporated gold. The random pattern of the inner wall roughness diffusely reflects any radiation falling on it.
The gold layer highly - diffusely reflects the infrared radiation which thus gives high infrared radiance inside the sphere.
The sample was carefully clamped in position on the sample opening. The observation hole was cut such that the observation angle was 12° as measured from the surface normal. A second Nernst glower, powered separately, was positioned very close to the integrating sphere. A blockage lip was placed between the Nernst source and the sample such that no direct radiation from the source could fall onto the test sample, a condition required by the analysis of the energy exchange inside the integrating sphere (4).
The radiation reflected from the sample was collected by a 100 mm diameter spherical mirror of f=150 mm positioned such that it directed the radiation from the sample toward mirror M1 inside the optical source compartment and along the spectrophotometer optical path. A maximum solid angle of collection of \(\Delta\omega\simeq\frac{\pi}{240}\) was used. The entire arrangement is shown in Figure 4. The reference beam was provided by the original Nernst glower source of the spectrophotometer. A partition was installed between the Nernst source and the sample optics (mirrors M1 and M3) and thus prevented the radiation from the internal Nernst source from entering the sample slit.
The theory of the energy exchange between surface elements inside the integrating sphere is well understood and will not be repeated in this report. If rough and polished samples are alternately placed on the sample holder, the respective outputs of the detector will be directionally proportional to their directional reflectance values. Since smooth or polished samples show the same values for both the specular and the hemispherical - directional reflectance (9), it can be shown (4) that
\[\frac{\rho_{\text{hd},\lambda}(\Psi)}{\rho_{\text{sp},\lambda}(\Psi)} = \frac{\Psi_{\text{a}}}{\Psi_{\text{s}}} \text{ for } \theta = \Psi\] (8)
where \(V_a\) and \(V_s\) are the detector outputs from reading the rough and the smooth samples, respectively, measured with respect to zero reference reading. The zero reference was obtained by placing a blockbody in the place of test sample.
TEST SAMPLES
The test samples were made from the type 304 stainless steel rod of 25.4 mm diameter and 3.2 mm thick. Each specimen was machined to have both surfaces smooth. One side of the surfaces of each set of four samples were further processed to have their roughness ranging from very smooth (polished) to a very rough characteristic. Three sets of these samples were then vacuum deposited with, respectively, aluminum, gold and chrome. Another set was left uncoated and was intended to be stainless steel 304 samples. The rms. values of the surface roughness heights were measured using a profilometer with a G-type tracer point of 25 µm diameter. The respective values of the mechanically measured surface roughness are presented in Table 1.
RESULTS
The specular and hemispherical-reflectance measurements were obtained in the wavelength range from 2.5 to 16 \(\mu m\). Beyond 16 \(\mu m\) the signal level was too small to be effectively usable. The spectrum range from 2.5 \(\mu m\) to 16 \(\mu m\) is, however, sufficient to obtain the objectives of this study. Figures 5 to 7 are presented to show that the system functioned properly and the results are compatible to the theoretical prediction. Only stainless steel 304 results will be presented in Figures 5 to 7, since the other metals used in this study show similar behavior (4).
Presented in Figure 5 are plots of the normalized specular reflectance \(\rho_{s,\lambda}(\Psi)/\rho_{sp,\lambda}(\Psi)\) vs \(\lambda\) for stainless steel 304. The results are similar to those previously reported, such as in (10). The relationships between \(\rho_{s,\lambda}(\Psi)/\rho_{sp,\lambda}(\Psi)\) and \(\sigma_{o}/\lambda\) are presented in Figure 6 where \(\sigma_{o}\) has been obtained from eq. (5). For small values of \(\sigma_{o}/\lambda\), the data for all samples fall very close to the theoretical line given by eq. (5). At large values of \(\sigma_{o}/\lambda\), the influence of the diffuse component becomes important and the data no longer follows exactly the theoretical results.
The surface rms slopes m is calculated from the diffusion term in eq. (1), where, for wavelength below a given value, the influence .of the specular term is relatively negligibLe. The value of I used in the calculation of m was selected when the nagnitude of the specular term is around 1% of the total reflectance. Figure 7 shows the pJ-ot phd,tr(Y) /9"0,^(Y) vs oo/tr for stainless 'steel test sarnples. In the region where the wavelengths are large compared to the surface roughness oor the hemispherical - directional reflectance approaehes the specular reflectance value and therefore, as oo/l approaches zero, the curves of phd,^(V)/0"n,^(Y) approaches unity. The results compare favorably with those presented in Reference (1r) .
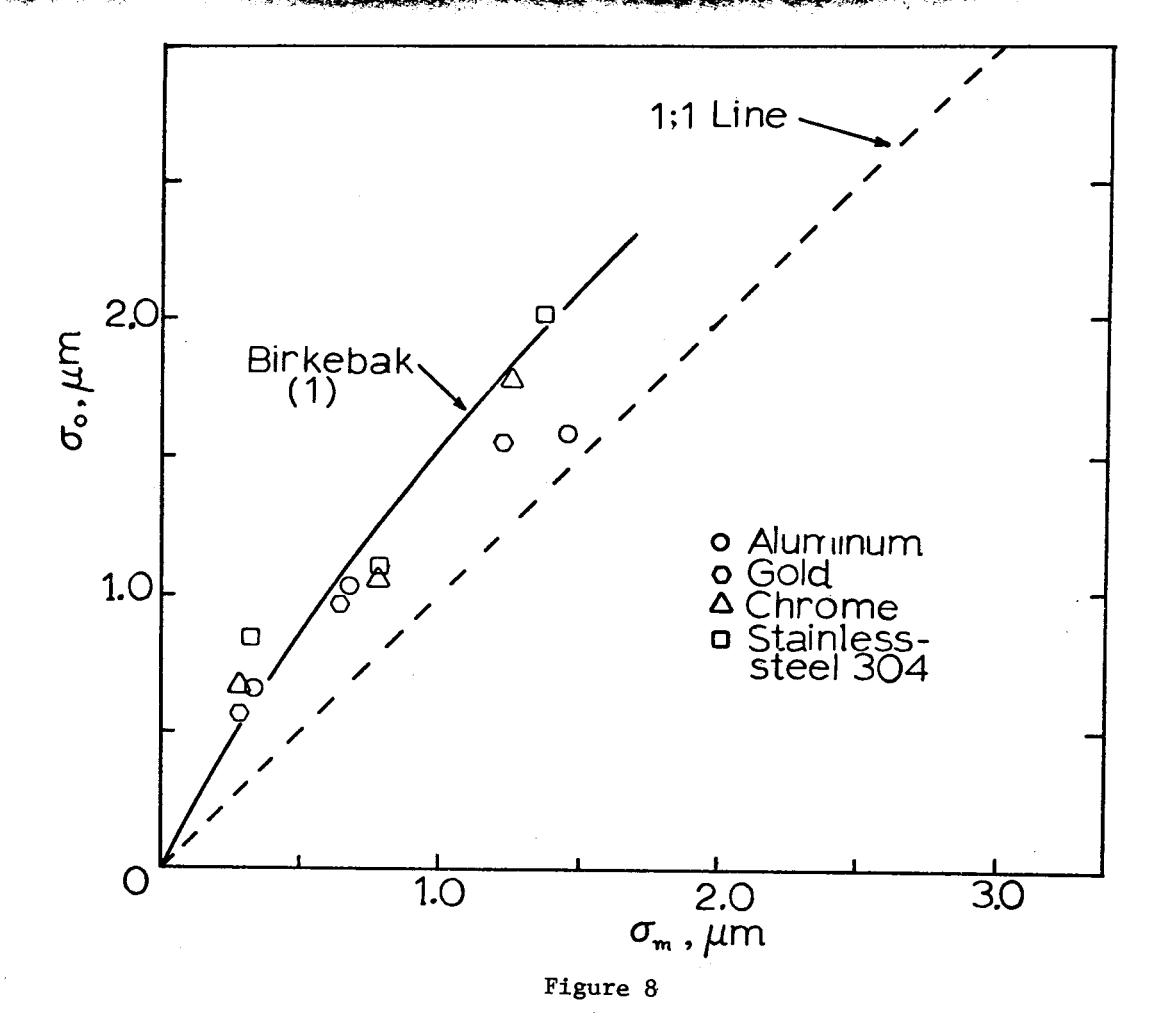
The complete results of the rms. and arithrnatlc values of the mechanically measured surface roughness, the optical va1 ues of surface roughness and slopes, are presented in Table 1 for the entire samples. The correlation between the mechanica] and optical- surface roughness is presented in Figure 8 and the data points are ln general in the viclnity of the predicted l-ine proposed by Blrkebak (1).
CONCLUSIONS AND RECOWENDATIONS
An experlmental technique has.been presented which uses a double - beam spectrophotometer to measure the rms. surface roughness and slopes. Both Davj-es' (2) Beckmannrs (3) theories h'ave been used to calculate the optical values of the rms" surface roughness, with the flrst theory also applied to calculate the rms. values of surface slopes. The results compare favorably with those previously obtained using different techniques.
Some auromation, as suggested by Bennett and Porteus (7) and was later patented by Bennett (13) shows the practical application of Davies' theory. 0ther possibilities sti1l remaln open, including the appllcation (and further study) of Beckmannts theorv.
ACK],lOWLEDGEMENTS
The authors appreciate the help of Messrs. Dan Huber, Larry 01son and Mil-e Vannier. This research was a part of a grant from the National- Science Foundation, Grant No. GK12989.
Table 1 Surface properties of the test samples
| Test Samples | Mechanically }leasured Surface Roughness | Optically Measured | ||||
|---|---|---|---|---|---|---|
| RMS. Value o m | ARITH. Value o^ | Surface From Davies | Roughness o From Beckmann | Surface Slopes m (rrom uavlesJ | ||
| Aluminum | 1 \ a L ) | u.J4J U m | 0.309 U m | un 0.657 | pm 0.676 | 0 .688 |
| 3 | '|l 0.696 | t l 0.629 | l l L.OL2 | l t 1.091 | 1.002 | |
| 4 ]Ltf | r r 1.431 | '|l L.297 | t l 1.586 | t l 1.88 | L.220 | |
| Gold | ,) 1I | r l 0.295 | r r 0.252 | t l o.567 | 'i, 0.53i | 0.472 |
| J 1r | t t u.o)z | r l 0.601 | r r 0.961 | 0 .963 '|, | 0.847 | |
| IL 4 | L.236 '|l | t t 1.191 | r.547 '!, | t l l598 | L.094 | |
| Chrome | lla | 0.301 r r | 'i, o.267 | '!l 0.640 | 'il 0.565 | 0.557 |
| # 3 | r t o.77 0 | 1 , 0.660 | r l 1.504 | r , 1.056 | 0.510 | |
| lIq | '!, 1.27 4 | 'i, l109 | ' 1.788 | ' , L.665 | L.392 | |
| Stainless il 2 | '|, 0.339 | r l 0 .305 | '!r 0.804 | 0.590 ' , | 1.020 | |
| Steel | ll 3 | 0.660 r l | r l 0.720 | r l 0.875 | r r L.076 | 0.635 |
| It 4 | 1.194 r , | '!l 1.094 | l l 1 t aa L.qLZ | 1.563 ' | 2.L26 | |
f) A11 samples numbered "onet' are smooth polished.
t .
$1,52 : Slits Source : Nernst Glower
Figure 1: Optical diagram PE-621 Spectrophotometer.
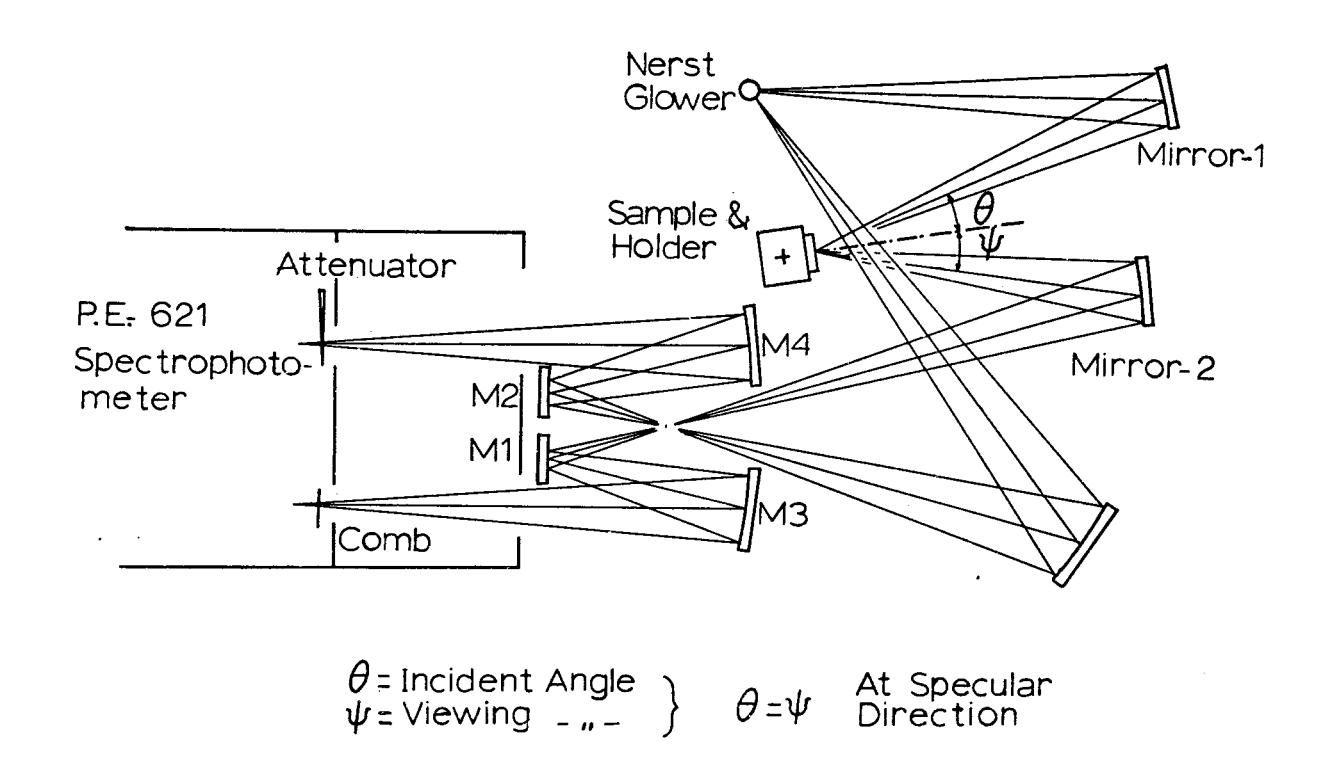
Figure 2: Experimental Set-up used with Davies Theory.
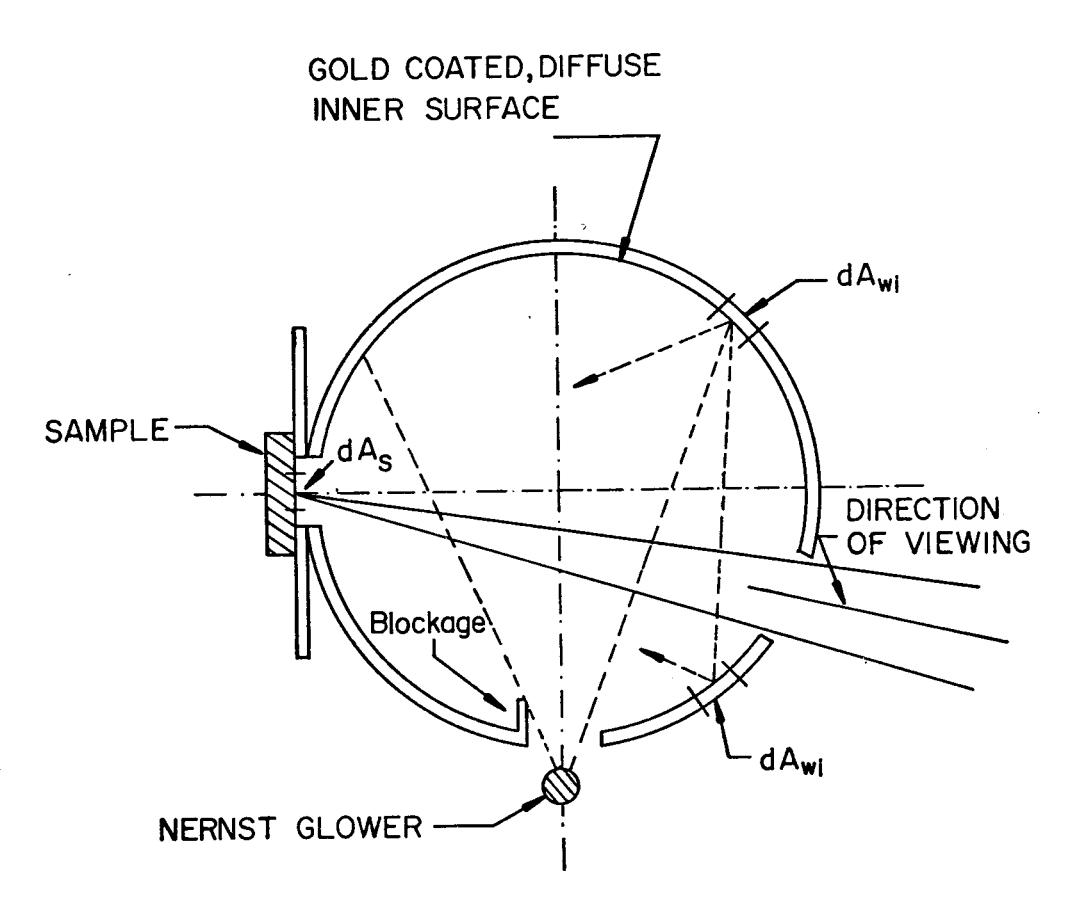
Figure 3: Energy transfer mode of integrating sphere.
Figure 4: Experimental set-up used with Beckmann's theory.
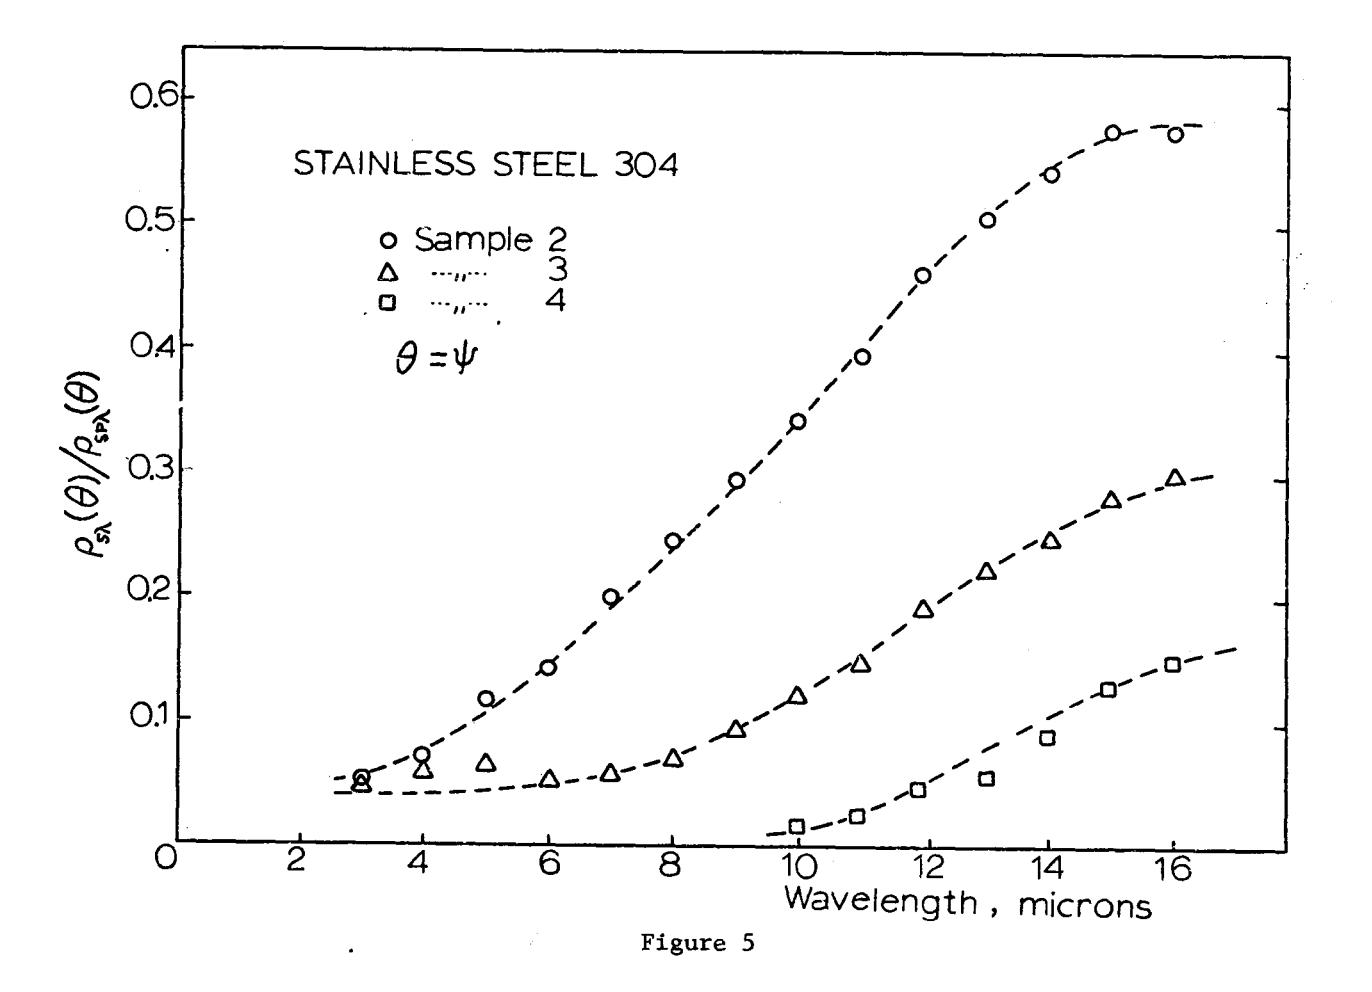
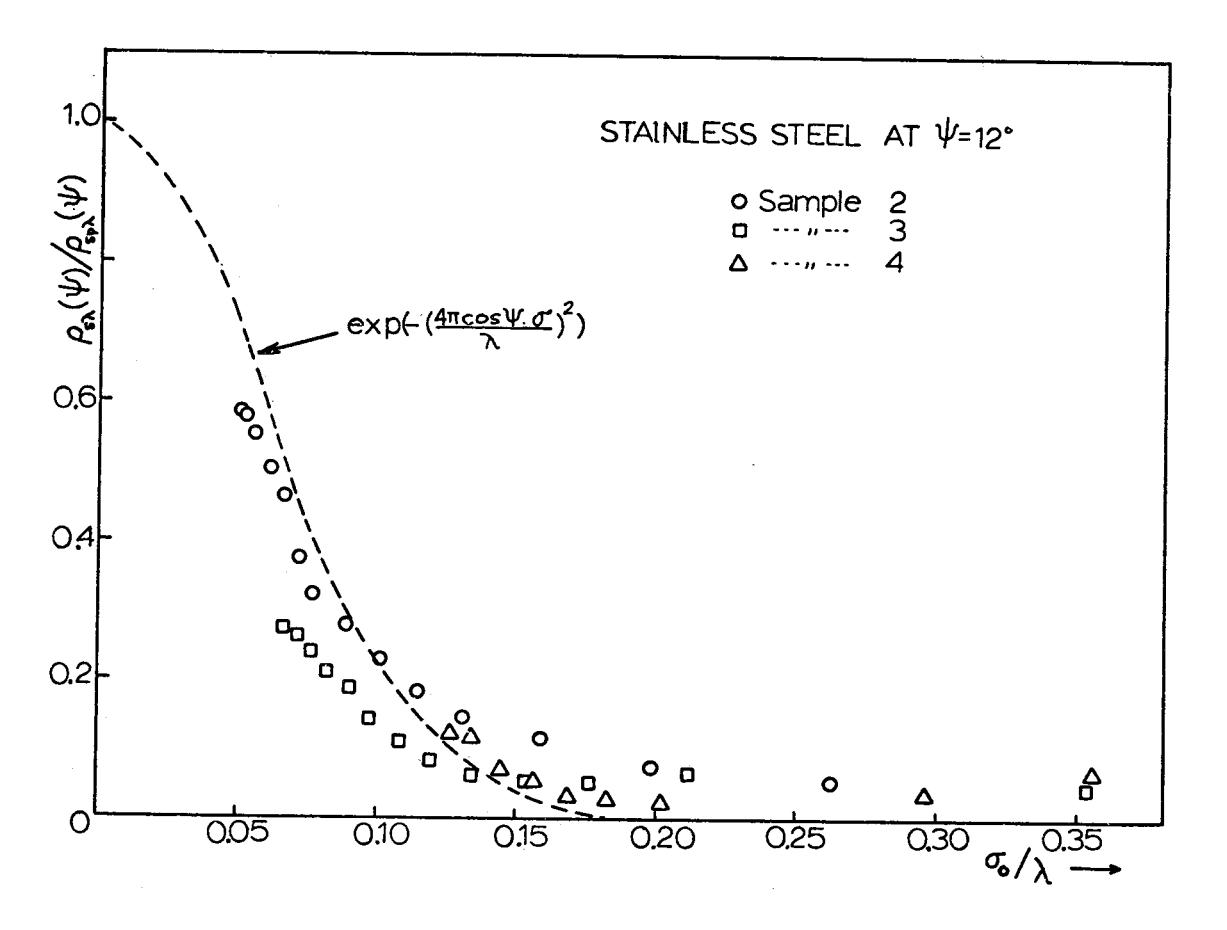
Figure 6
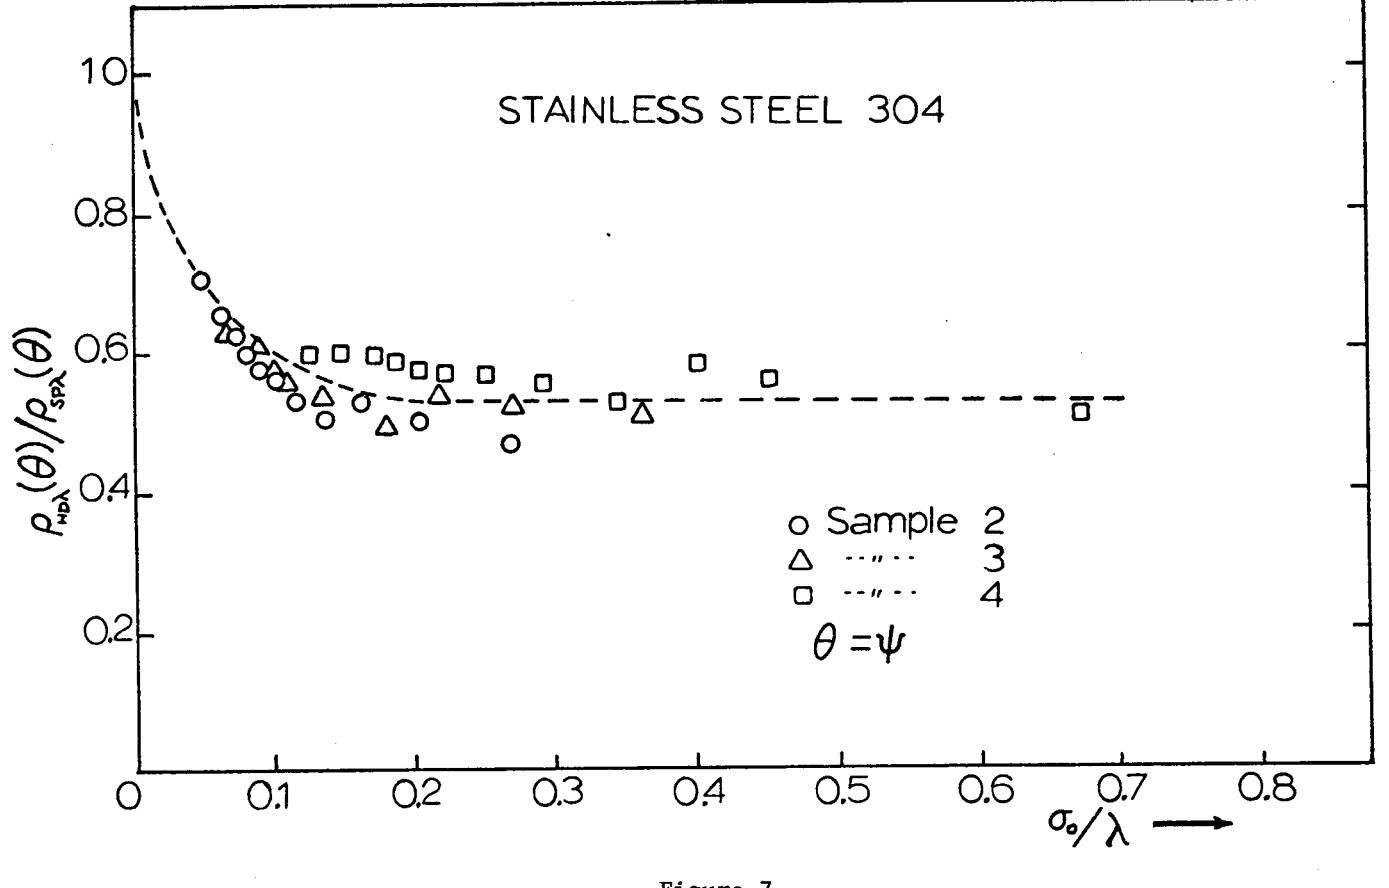
Figure 7