

INTRODUCTION
Recently gel electrophoresis of soluble proteins extracted from various fungal components has received considerable attention as a possible aid in resolving some of the problems inherent in fungal taxonomy.
Chang et al. (1962) found that different protein patterns obtained from Neurospora sitophila, N. intermedia, N. crassa,
*)Department of Biology, Institute of Technology Bandung.
and a mutant strain of N. crassa, each had a distinctive protein complement and that interspecific differences were greater than intraspecific differences. Subsequently, Durbin (1966), working with species of Septoria, and Clare and Zentmeyer (1966) and Gill and Powell (1968), who studied species of the genus Phytophthora, all suggested that results obtained by using this technique would be useful as a taxonomic criterion. The electrophoretic patterns of the major proteins are characteristic of a species but no pattern characteristic of a genus has been recognized by Clare et al. (1968).
cr
(p.
dy
al.
qua
whi
dra
RES
pat
nia
Macko \(et\ al.\) (1967) working with wheat stem rust, suggested that disc electrophoresis might be useful in characterizing subspecific taxa, i.e. formae specialis or physiologic races of wheat stem rust.
Whitney et al. (1968) working with Verticillium alboatrum, V. dahliae and Fusarium oxysporum, found a large interspecific difference between V. alboatrum and V. dahliae than the intergeneric difference between V. dahliae and Fusarium oxysporum. The same techniques had also been done by several authors (Shipton and Fleischmann, 1969; Glynn and Reid, 1969; Kulik and Brooks, 1970; and Milton et al., 1971).
To elaborate this, changes in the electrophoretic patterns of proteins in the three species of Solerotinia were undertaken in the present study.
MATERIALS AND METHODS
Isolates of Sclerotinia sclerotiorum, S. trifoliorum and S. minor used in this study were obtained from the culture collection of school of Botany, University of New South Wales, Australia. All the isolates were grown on Oxoids modified Czapek Dox Agar supplemented with 0.2% L-asparagine and 2 mg/l thiamine hydrochloride in Petri dish cultures. The cultures were incubated at 20°C under fluorescent light of about 15 lumens/sq.ft.
Sclerotia were collected when they had just become pigmented, usually between 2 and 3 weeks after inoculation. The sclerotia were extracted in a mortar containing a small amount of acid washed sand and a pestle, at \(0^{\circ}-4^{\circ}\mathrm{C}\). Three ml. of 0.05 M tris-glycine buffer (pH 8.7) were added to each gram of material. After thoroughly grinding, the mixture was centrifuged at 20.000 g for 1 hr. at \(0^{\circ}-4^{\circ}\mathrm{C}\). The resulting supernatant was decanted and dialyzed against distilled-deionized water for 24 hrs., then centrifuged for 90 min. at 20.000 g. The extracts were frozen rapidly using dry-ice and freezedried. The amount of protein in the resulting dry mass was determined by Folin-Ciocalteau method (Lowry et al., 1951).
Gels were prepared by a modification of the method described by Cheung and Marshall (1969).
Horizontal electrophoresis in 0.2 M tris-glycine buffer (pH 8.7) was performed at \(4^{\circ}\)C, with 32 mA d.c. until a tracker dye (bromophenol blue) had migrated 6 - 7 cm and this was usually after about 3 - 4 hours.
Each gel was sliced horizontally into four pieces of equal thickness and stained with Coomassie blue.
The protein bands were photographed against a diffuse white back ground illuminated from below. Also interpretative drawings were made from selected gels.
RESULTS
ıd :e
ьd
/1
ès
ghe
ınt of of rierzed
g.
zewas
1).
les-
Considerable variation was found in the type of protein pattern obtained in extracts of the three species of Sclerotinia (Figure 1 and 2).
Figure 1
Electrophoretic spectrum on polyacrylamide gel of soluble proteins from Sclerotinia sclerotiorum.
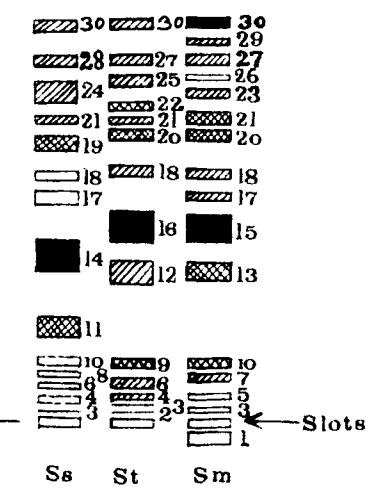
Figure 2
Diagrammatic representation of the electrophoretic spectra of the soluble proteins of Sclerotinia sclerotiorum, S. trifoliorum and S. minor. The intensities of the bands are represented by: black, very intense; cross-hatched, intense; single hatched, fairly intense; open, weak, stippled, resolution not in bands.
Ss, Scleratinia saleratiorum St, Scleratinia trifoliorum Sm, Scleratinia minor.
The electrophoretic protein patterns of all species observed here were similar, irrespective of their origin. Although those species produced essentially the same pattern, there were small variations within the different species in the number and position of electrophoretic bands.
Mean Ef values of bands from the three species of Scienotinia are given in Table 1.
The staining intensities can be seen also in Figure 2. The extract of S. sclerotiorum and S. trifoliorum which very intense band is at number 7 and S. minor is sember 6 from the slots, respectively.
Table 1 Mean Ef values of Solerovinia soler tionum, S. trifolionum and S. miror
| errendus um Mannas Bulantag um 1900 m. 1 m. 1. a. 1600 agage, gragen ser 100 French spannag sycho | a gamentar of the Contracting and the Contraction of the Contraction of the Contraction of the Contraction of the Contraction of the Contraction of the Contraction of the Contraction of the Contraction of the Contraction of the Contraction of the Contraction of the Contraction of the Contraction of the Contraction of the Contraction of the Contraction of the Contraction of the Contraction of the Contraction of the Contraction of the Contraction of the Contraction of the Contraction of the Contraction of the Contraction of the Contraction of the Contraction of the Contraction of the Contraction of the Contraction of the Contraction of the Contraction of the Contraction of the Contraction of the Contraction of the Contraction of the Contraction of the Contraction of the Contraction of the Contraction of the Contraction of the Contraction of the Contraction of the Contraction of the Contraction of the Contraction of the Contraction of the Contraction of the Contraction of the Contraction of the Contraction of the Contraction of the Contraction of the Contraction of the Contraction of the Contraction of the Contraction of the Contraction of the Contraction of the Contraction of the Contraction of the Contraction of the Contraction of the Contraction of the Contraction of the Contraction of the Contraction of the Contraction of the Contraction of the Contraction of the Contraction of the Contraction of the Contraction of the Contraction of the Contraction of the Contraction of the Contraction of the Contraction of the Contraction of the Contraction of the Contraction of the Contraction of the Contraction of the Contraction of the Contraction of the Contraction of the Contraction of the Contraction of the Contraction of the Contraction of the Contraction of the Contraction of the Contraction of the Contraction of the Contraction of the Contraction of the Contraction of the Contraction of the Contraction of the Contraction of the Contraction of the Contraction of the Contraction of the Contraction of the Contraction o | |||
|---|---|---|---|---|
| No. of | Mean Ef values | |||
| bands | \(S.\ solerotionum\) | S. trifetiorum | S. minor | |
| 1 | 02 | |||
| 2 | .01 | |||
| 3 | .02 | .02 | .02 | |
| 4 | .04 | . 94 | ||
| 5 | .05 | |||
| 6 | . 97 | .07 | ||
| 7 | .09 | |||
| 8 | . 10 | |||
| 9 | .11 | |||
| 10 | . 1.2 | , 12 | ||
| 11 | .20 | |||
| 12 | .31 | |||
| 13 | .32 | |||
| 14 | .36 | |||
| 15 | ,41 | |||
| 16 | ,42 | |||
| 1.7 | .48 | , 4성 | ||
| No. of | Mean Ef values | |||
|---|---|---|---|---|
| bands | S. sclerotiorum | S. trifoliorum | S. minor | |
| 18 | .53 | .53 | .53 | |
| 19 | .60 | |||
| 20 | .62 | .62 | ||
| 21 | .65 | .65 | .65 | |
| 22 | .67 | |||
| 23 | .70 | |||
| 24 | .71 | |||
| 25 | .73 | |||
| 26 | .74 | |||
| 27 | .77 | .77 | ||
| 28 | .78 | |||
| 29 | .82 | |||
| 30 | .85 | .85 | .85 | |
DISCUSSION
This investigation demonstrates that the electrophoretic patterns of proteins change both qualitatively and quantitatively in Sclerotinia sclerotiorum, S. trifoliorum and S. minor.
As stated in the introduction, the value of a new taxonowic method can only be assessed in relation to informations available from other disciplines.
The present results also indicate a larger interspecific difference between S. sclerotiorum, S. trifoliorum and S. minor.
As Clare, Flentje and Atkinson (1968) suggested, the patterns of buffer-soluble protein on gels following electrophoresis can be used to delimit fungal species.
The extent of variation shown in the electrophoretic patterns of proteins from cultures of S. sclerotiorum, S. trifoliorum and S. minor, might, however, be a peculiarity of the species of the genus Sclerotinia, which have capacity to change their morphological appearance and physiological behaviour is well known, in which case the protein patterns would reflect this diversity.
Polyacrylamide gel electrophoresis of the soluble proteins from each of the 3 species of Sclerotinia revealed a maximum of 14 protein fractions from S. sclerotiorum, 14 from S. trifoliorum and 16 from S. minor (Figure 2).
Investigators, who have studied proteins of other fungi with polyacrylamide gel electropgoresis reported fewer protein fractions. Chang et al. (1962) resolved 25 bands of Neurospora spp., Durbin (1966) reported 13 bands from 3 Septoria spp., Gill and Powell (1968) obtained from 10 to 13 "components" from 3 species of Phytophthora.
Closeness of relationship between 2 taxa may be directly related to the number of homologous protein fractions that they posses in common. The number of homologous protein fractions among all possible paired combinations of the 3 species of Scleortinia used in this investigation are shown in Figure 2 and Table 1. "Homologous protein fractions" is meant as proteins from different taxa that migrate at the same distance from the origin. In making this comparison of each of the 3 species of Sclerotinia for homologous protein fractions, the data on the fractions obtained from each of the three species of Sclerotinia, were pooled to form a composite picture or spectrum of each species.
All taxa have common protein fractions with mean Ef values of .02, .53, .65 and .85. Two bands of S. sclerotiorum were common with S. trifoliorum (with mean Ef values of .04 and .07), another two bands of S. sclerotiorum were common with S. minor (with mean Ef values of .12 and .48). S. trifoliorum has two common bands with S. minor (with mean Ef values of .62 and .77). Each of them has independent bands, S. sclerotiorum has 6, S. trifoliorum has 6 and S. minor has 8 different protein fractions (Figure 2 and Table 1).
The results of the present investigation are based on the protein changes over the whole culture period and would seem to support the established taxonomy.
ACKNOWLEDGEMENTS
The author wishes to express his gratitude to Dr. H.J. Willetts, as his supervisor, for his interest in the work; to Dr. D.S.M. Cheung for helpful suggestions; to authorities of the University of New South Wales for providing facilities for his work, and to Mr. A.L. Wong and Mr. Hans Cook for technical assistance.
This work was supported by a grant from the Department of Education and Science, Sydney, to whom thanks are due.