

INTRODUCTION
Like other chemical industries, the Letjes Paper Mill produces approximately 800 cubic meters of waste effluents per hour, which is directly discharged into the immediate surroundings without any treatment beforehand. Since the founding of this mill (1940's), their waste effluents have been discharged into the surrounding rice fields of Letjes, and since that time the farming community of this area believes that irrigation of their rice fields by the effluent water of the Letjes Paper Mill increases the fertility of their farming land, in comparison to land not irrigated by this effluent water. This results in competition by the farmers to obtain waste effluents for their rice fields.
The Letjes Paper Mill follows the course generally used by other Indonesian paper mills by mixing all their waste effluents together before discharging it, resulting in reduction of negative effects which may apprear.
In other countries, particularly in Europe and the United States of America, major problems emerging from paper mills waste effluents are the presence of chemical residues used as slimecide. These chemical residues usually contain Hg, resulting in that paper mills are required to conduct waste effluent treatment before discharging it to reduce negative effects which may appear.
Industrial waste effluents, particularly chemical industries causes pollution. In this age where the society are very "pollution minded", whatever the nature or form, the pollutants are classified as dangerous. Even though in reality pollutants are divided into two major groups consisting of dangerous and undangerous.
This dangerous and undangerous classification depends on the substances which make up the pollutants. As the definition given by W.H.O. in 1966, water pollution is caused by physical, chemical, physiological and biological factors, as shown at Table 1.
The major problems caused by paper mills waste effluents are chemical substances (soda, colour substances), physical substances (colour, suspended matter) and physiological effects (taste and odour). Suspended matter can form sedimentation at the bottom of habitats receiving them or form films on surface the water. If other natural processes do not participate negative factors will appear, among others reduction in the number and form of organisms in a certain habitat. The presence of slime-forming microorganisms are caused by the increase of organic pollutants piling up on habitat bottoms, particularly in rivers, lakes, ponds, etc. if the presence of decomposing bacteria are not accepted found.
Iı
hy (E de di wa ci
it
SV
re wa ri ti
1.
2.
5.
| Chemical | Physical | Physiological | Biological |
|---|---|---|---|
| Organic (carbon | Colour | Taste | Bacteria (pathogenic) |
| compounds) Turbidity | Odour | Viruses | |
| Inorganic (mineral compounds) | Temperature | Animals | |
| , | Suspended matter | Plants | |
| Foam | |||
| Radioactivity |
Table 1. Types of pollution in sewage and trade wastes
In water habitats, organic pollutants particularly carbohydrate substances, require a great deal of dissolve oxygen (DO), this results in active stimulation of the growth and development of slime-forming microorganisms. All of this will cause distrubances in the biological balance of the habitat.
An advantage obtained by paper mills using the sodasystem like the Letjes Paper Mill, is the production of sodium-lignat in the effluent water. In nature, particularly in water habitats, this substance is unstable, because many species of microorganisms found in nature is capable of degrading it.
The purpose of this study is to examine the effects and results of continuous dischargal of the Letjes Paper Mill waste effluents on microorganisms present in rice fields and rice plants. Because of the width of the area studied attention is directed to:
- 1. Inhibitory value by bioassay of the waste effluents againts Bacillus megaterium (ATCC 14581).
- Total count of microorganisms per gram or per ml raw material at habitats receiving waste effluents.
- Type of microorganisms in habitats receiving and not receiving waste effluents.
- Population density of Nitrogen-fixing microorganisms at habitats receiving and not receiving waste effluents.
- 5. Comparison of the population of cellulose and cellulose derivatives decomposing bacteria at rice fields receiving and not receiving waste effluents.
Influence of the addition of waste effluents on rice plants.
MATERIAL AND METHODS
Materials used in this study:
- Waste effluents beginning from pulp plant to rice fields.
- b. Mud, soil and other substances from habitats receiving waste effluents, beginning from mill area to rice fields.
All samples were collected from areas around the mill and outside the mill, consisting of:
- 1. Pulp plant,
- 2. Paper plant,
- Ditch stream near warehouse I (old mill).
- 4. Ditch stream entering housing complex.
- 5. Ditch stream leaving housing complex around Sempol-river,
- 6. Ditch stream entering rice fields,
- Rice fields receiving waste effluents, located near village,
- 8. Rice fields receiving waste effluents, located 1-3 Km from village,
- 9. Control 1 (rice fields untouch by waste effluents).
- 10. Control 2 (stream or ditches untouch by waste effluents).
In accordance with the nature of this study, all samples were collected randomly (Board & lovelock 1974; Gibbs & Skinner, 1966; Harrigan & McCance, 1966; Kavanagh, 1963; and Rosswall, 1973). The samples were examined minimally with 3 times repetition.
Inhibitory values of samples were tried out against Bacillus megaterium, a bacteria species generally used for bioassay because of its sensitive towards metabolite toxics in waste effluents.
Average count of microorganisms in one habitat per gram or per ml sample were particularly directed towards molds, bacteria and actinomycetes using dilution method. Classification of microorganisms found were determined until the genera level. Except determination of average density of nitrogen-fixing microorganisms such as bacteria and blue-green algae were carried out until species.
Comparison of cellulose and cellulose derivatives decomposing bacteria was carried out particularly towards types of bacteria active in utilizing cellulose as a Carbon (energy) source in a selective medium.
Study for influences on the addition of waste effluents towards rice plants, is in accordance with attach work schema (Figure 1). This study was conducted in the greenhouse at the Biology Department, Institute of Technology Bandung. These experiments were conducted with 5 types of treatments, each consisting of 5 rice plants plots planted in plastic basins. Each basin was filled with artificial soil containing a Nitrogen source following the U.C. - Soil Mix. consisting of sand and organic source.
The addition of municipal waste effluents is directed towards studying the influence of microorganisms from ditch water containing a great amount of enteric bacteria, towards intoxification of metabolite toxics in waste effluents through deterioration (Treatment no. II). The addition of soil microflora culture solution isolated from samples, is directed towards studying the effect of specific soil microorganisms in soil continously receiving waste effluents through a period of many years towards metabolite toxic intoxification processes obtain in waste effluents.
RESULTS AND DISCUSSION
Inhibitory Value of Waste Effluents
Toxicity value of metabolite toxics present in waste effluents, can be measured through bioassay methods by inhibitory value. For industrial waste effluents not containing high concentration of toxic as substances (particularly Hg) such as the paper mills using the soda system, the use of sensitive bacterial cultures such as Bacillus megaterium ATCC 14581 whose resistency can be measured by biounits, is suggested by W.H.O.
Table 2 shows that newly discharged pulp-plant waste effluents with the lowest dilution factor (1:0 and 1:1) has an inhibitory value more than 2 biounits (++++) while further diluted effluent (1:2) has an inhibitory value of less than 2 biounits (+++). Waste effluents leaving paper plant gives the same result with newly discharged for a dilution of 1:10 (lowest) which is between 1-2 biounits (+++). At other areas because of direct or indirect natural dilutions of certain places, the inhibitory zone decreases. For instance the waste effluent ditch after passing Warehouse I begins to receive indirect dilution by other sources (mill ditch coming from straw or paddy washing place, etc.).
Waste effluents entering housing area shows an inhibitory value of less than 1 biounit (+) for the lowest dilution (1: 10). Waste effluents leaving this housing area where further supplementary effluents were added from other sources (gene-
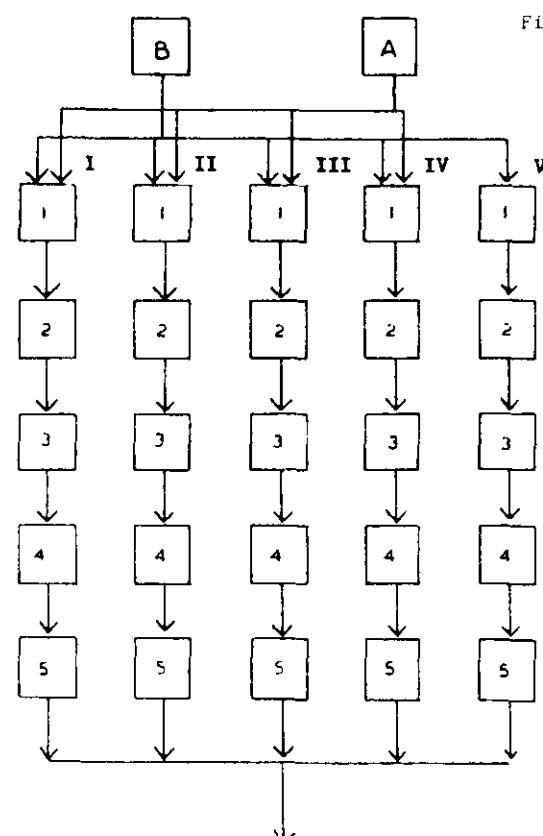
Fig. 1. EXPERIMENTAL SCHEME OF TREATMENTS ON EFFECTS OF LETJES PAPER MILL WASTE EFFLUENTS TOWARD RICE FIELDS AND RICE PLANTS MICROFLORA
A : Waste effluent
B : Tap water
I: Row of experimental basins containing tap water and waste effluents (1:1) with the addition of N-P-K fertilizer
II: idem, containing tap water, waste effluents and municipal ditch water (5:5:1) with the addition of N-P-K fertilizer
III: idem, containing tap water and waste effluents plus isolated soil microflora culture solution (20:20:1) with the addition of N-P-K fertilizer
IV : idem, containing tap water and waste effluents without addition of fertilizer
V : idem, containing tap water and N-P-K fertilizer
1, 2, etc : Number of experimental basins
rally in the form of domestic sewages), showed an inhibitory value of non-significant value (-).
Microbiological analysis conducted towards the waste effluents showed that a number of decomposing bacteria were antively found (Histogram 1).
Because of the presence of decomposing bacteria, deterioration and degradation of chemical subctances in waste effluents occurs resulting in that waste effluents leaving housing area have non-significant inhibitory value. It is therefore not surprising why waste effluents coming in contact with rice fields do not influence soil microflora, soil microfauna and other soil fauna (snails, worms, etc.).
Table 2. Inhibitory value of waste effluents towards Bacillus megaterium in biounits.
| No. | Origin of material | Dilution | Inhibitory value |
|---|---|---|---|
| 1. | Pulp-plant | 1 : 0 1 : 1 1 : 2 | ++++ ++++ +++ |
| 1:4 | + | ||
| 2. | Paper-plant | 1 : 0 1 : 1 1 : 2 | ++ + |
| 1:4 | |||
| 3. | Ditch near warehouse I (old mill) | 1:0 | ++ |
| 1 : 2 1 : 4 | + - | ||
| 4. | Ditch entering housing | 1:0 | + |
| complex | \(\text{[rumus tidak dapat ditampilkan dengan baik — lihat PDF asli]}\) | - - - | |
| 5. | Ditch leaving housing | 1:0 | - |
| complex (Sempol river) | \(\begin{array}{c} 1 : 1 \\ 1 : 2 \end{array}\) | ||
| 1:4 | - | ||
| 6. | Ditch entering rice-field | 1:0 | - |
| area | \(\begin{array}{c} 1 : 1 \\ 1 : 2 \end{array}\) | ||
| 1:4 | _ |
| No. | Origin of material | Dilution | Inhibitory value |
|---|---|---|---|
| 7, | Rice-field are near village | 1 : 0 1 : 1 1 : 2 1 : 4 | - - - - |
| 8. | Rice field area between 1-3 Km from village | 1 : 0 1 : 1 1 : 2 1 : 4 | - - - |
| 9. | Control I | 1 : 0 1 : 1 1 : 2 1 : 4 | - - - |
| 10. | Control 2 | 1 : 0 1 : 1 1 : 2 1 : 4 | - - - |
Explanation
I biounit is a 20 mm inhibitory zone surrounding paper disk saturated with waste effluent solution.
- : No inhibition (negative result)
+ : Inhibitory zone less than 1 biounit
++: Inhibitory zone 1 biounit
++++ : Inhibitory zone between 1 - 2 biounit ++++ : Inhibitory zone more than 2 biounit
Total Count of Microorganisms
As with the inhibitory values obtained, total count of microorganisms gave same results. Table 3 shows that total count obtained through dilution methods gives increasing counts from waste effluents obtained directly from pulp plant until surrounding area of warehouse I.
At pulp plant area, lowest average count (1-5 for liquids and 5-22 for sediments or solid matter) came from high temperature tolerant microorganisms (thermophilic microorganisms): bacteria, actinomycetes and blue-green algae. For instance the highest temperature recorded compared to other areas were at places where waste effluents leave the pulp plant. Here at side of the ditches a great number of thermophilic blue-green algae colonies were found.
At the paper plant where supplementary water from other sources begins, the average total count showed an increase of 10-45 for liquids and 10-100 for sediments or solid matter. While for other areas after passing warehouse I, the count increases again (10-100 for liquids and 100-1000 for sediments or solid matter). And after passing housing complex the count resembles regular domestic waste effluents not discharge from chemical industries.
Results from rice fields located 1-3 Km from villages, showed a very high count. Since the establishment of this paper mill, these rice fields continously use the waste effluents in their irrigation system.
Average total count obtained in this area was very high in compared to the same type of rice field uncontaminated by waste effluents. If this condition is associated to Waksman's theory (Mitchel, 1972) areas coming into contact with foreign metabolites first show a reduction or decrease in variety count and generally afterwards in population. But if the supplement routinely continues and the foreign metabolites added are not of a toxic nature, sooner or later adaptation will take place. Tolerance in surviving resistant individuals will appear and later on develop normally as before.
Since the operational establishment of this mill (1940's), rice fields around Letjes continously receives and utilize the waste effluents in their irrigation system. Because Letjes Paper Mill waste effluents relatively does not contain dangerous metabolite toxic, such as excessive Hg residue from pulp, tolerance and adaptation capability will appear in individuals, particularly in microfloras.
Letjes Paper Mill waste effluents contain residues from cellulose derivatives in the form of sodium-lignat. By the decomposing groups particularly the cellulose and cellulose derivatives decomposing bacteria, the lignin will be broken down to carbon (energy source). The Na liberated from the lignin will be discharged together with other waste effluents and reach soil habitats. Since Na is classified as a microelement required by plants and phytoplankton, excessive accumulation of Na in the soil seems to be taken place. Also because the rice harvests occur twice a year alternated by secondary crops.
If we associate this problem with Oden's theory on top soil (Teuscher & Adler, 1960), cellulose and cellulose derivatives caused by waste effluents will slowly accumulate in the soil. There is a possibility that the residual matter will not be completely degraded by soil microorganisms, resulting in that part of the remaining organic matter will become a source of top soil formation. \(\,\)
Table 3. Total count of microorganisms per gram or per ml material examined.
| No. | Sampling site Form of mate- | Average count per ml/per gr | Explanation | |||||
|---|---|---|---|---|---|---|---|---|
| 1. | Pulp-plant | Liquid Solid matter, sedimentation | 1 5 | 5 | Mostly slime and capsulated bacteria, and blue-green algae (BGA), actinomycetes | |||
| 2. | Paper-plant | Liquid Solid matter, sedimentation | 10 10 | 45 102 | idem. | |||
| 3. | Ditch near Warehouse I | Liquid Solid matter, sedimentation | 10 102 | 102 | idem. | |||
| 4. | Ditch in housing complex | Liquid Solid matter, sedimentation | 10 | 103 | idem., and fungi were also obtain idem. | |||
| 5. | Ditch enter- ing housing complex near Sempol river | Liquid Solid matter, Sedimentation | 10 10 | - | 104 | idem. | ||
| 6. | Ditch enter- ing field are | Liquid Solid matter, Sedimentation | 103 | - | 106 | Begining to be completed ob- tain | ||
| 7. | Rice field near village | Liquid Solid matter, sedimentation | 106 | - - | 1011 | Completely obtain | ||
| 8. | Rice field area 1-3 Km from village | Liquid Solid matter, sedimentation | 1010 | 1018 | Completely obtain | |||
| No. | Sampling site | Form of mate- rial | Average count per ml/per gr | Explanation |
|---|---|---|---|---|
| 9. | Control 1 | Liquid | 104 - 1018 | Completety ob- |
| Solid matter, sedimentation | ||||
| 10. | Control 2 | Liquid | \(10^4 - 10^8\) | idem |
| Solid matter, sedimentation | 102 - 1010 |
Types of Microorganisms
Fifty two genera of microorganisms were isolated from samples taken at the site of the study, consisting of 25 genera of bacteria, 4 genera of actinomycetes, 7 genera of fungi and 16 genera of blue-green algae (Table 4). From the microorganisms isolated, those recorder as metabolites decomposing soil bacteria particularly againts organic substances, are Achromobacter, Bacillus, Corynebacterium, Clostridium, Cellulomonas, Chromobacter, Cronothrix, Chlamydomonas, Flavobacterium, Microococcus, Proteus, Pseudomonas and Cellvibrio. While Clostridium, Pseudomonas, Xanthomonas, Azotobacter, Anabaena, Anabaenopsis, Aulosira, Calothrix, Cylindrospermum, Mastigoeladus, Nostoc, Scytonema and Tolypothrix are classified nitrogen-fixing microorganisms for rice fields area (Stewart, 1968).
The presence of microorganisms based on habitats examined showed that area 8 (rice field contaminated by waste effluents located 1-3 Km from the village), was the richest area with all microorganisms isolated present (100%). Whereas, only 38 genera (73.07%) of microorganisms were isolated from neighboring rice fields uncontaminated by waste effluents.
Table 4. Types of microorganisms isolated from habitats contaminated by waste effluents and control.
| P | 1 a | се | i | s o . | l a | t e | d | ||||
|---|---|---|---|---|---|---|---|---|---|---|---|
| Туре | of microorganisms | 1 | 2 | 3 | 4 | 5 | 6 | 7 | 8_ | 9 | 10 |
| BACT | ERIA | ||||||||||
| 1. | Achromobacter | _ | - | + | + | + | + | + | + | + | + |
| 2. | Aerobacter | _ | - | _ | _ | - | - | + | + | + | + |
| 3. | Agrobacterium | - | - | _ | _ | - | + | + | + | - | - |
| 4. | Alcaligenes | - | - | - | _ | - | - | - | + | - | _ |
| 5. | Arthrobacter | - | + | + | + | + | - | + | + | _ | + |
| 6. | Bacillus | - | - | + | + | + | - | + | + | + | + |
| 7. | Corynebacterium | - | + | + | + | + | + | + | + | + | _ |
| 8. | Clostridium*) | - | + | + | + | + | + | + | + | + | + |
| 9. | Cellulomonas | _ | + | + | + | + | - | + | + | + | _ |
| 10. | Crenothrix | + | + | - | _ | _ | - | - | + | + | + |
| 11. | Chromobacter | - | + | + | + | + | - | + | + | + | _ |
| 12. | Clonothrix | + | + | + | + | + | - | + | + | _ | - |
| 13. | Chlamydomonas | + | + | + | + | + | + | + | + | - | - |
| 14. | Erwinia | _ | + | + | + | + | - | + | + | + | _ |
| 15. | Escherichia | _ | - | - | - | _ | _ | + | + | + | _ |
| 16. | Flavobacterium | _ | - | - | - | - | - | - | + | + | + |
| 17. | Gallionella | - | + | + | + | + | - | + | + | _ | _ |
| 18. | Klebsiella | - | - | _ | + | + | + | + | + | + | _ |
| 19. | Micrococcus | _ | + | + | + | + | + | + | + | + | _ |
| 20. | Proteus | - | - | + | + | + | _ | + | + | + | + |
| 21. | Pseudomonas*) | - | + | + | + | + | _ | - | + | + | _ |
| 22. | Serratia | _ | _ | _ | _ | _ | - | + | + | + | + |
| 23. | Xanthomonas*) | - | _ | - | _ | _ | _ | + | - | _ | |
| 24. | Azotobacter*) | _ | _ | _ | _ | _ | + | + | + | + | + |
| 25. | Cellvibrio | _ | _ | - | + | + | + | + | + | + | _ |
| т | of microorganisms | P | 1 a | се | i | s o | l a | t e | d | ||
|---|---|---|---|---|---|---|---|---|---|---|---|
| or microorganisms | 1 | 2 | 3 | 4 | 5 | 6 | 7 | 8 | 9 | 10 | |
| ACT I | NOMYCETES | ||||||||||
| 1. | Actinomyces | _ | + | + | + | + | + | + | + | + | + |
| 2. | Micromonospora | + | + | + | + | + | + | + | + | + | + |
| 3. | Nocardia | - | + | + | + | + | + | + | + | + | + |
| 4. | Streptomyces | + | + | + | + | + | + | + | + | + | + |
| FUNG: | I | ||||||||||
| 1. | Alternaria | - | _ | _ | - | _ | _ | + | + | + | + |
| 2. | Aspergillus | - | _ | - | _ | + | + | + | + | + | + |
| 3. | Fusarium | - | _ | _ | _ | + | - | + | + | + | + |
| 4. | Penicillium | - | _ | _ | _ | + | + | + | + | + | + |
| 5. | Saccharomyces | - | _ | _ | _ | _ | _ | - | + | + | + |
| 6. | Trichoderma | _ | _ | _ | _ | _ | _ | + | ÷ | + | + |
| 7. | Chaetomium | - | - | - | - | + | - | + | + | + | + |
| عانياذ | -GREEN ALGAE | ||||||||||
| 1. | Anabaena*) | - | + | + | + | + | _ | _ | + | + | + |
| 2. | Anabaenopsis*) | _ | - | + | + | + | + | + | + | _ | _ |
| 3. | Anacystis | _ | - | _ | _ | _ | - | + | + | - | + |
| 4. | Aphanocapsa | _ | - | _ | _ | _ | _ | - | + | + | _ |
| 5. | Aulosira*) | - | - | - | - | _ | - | _ | + | + | + |
| 6. | Calothrix*) | + | + | + | + | + | + | + | + | _ | + |
| 7. | Chroococcus | _ | + | + | + | - | _ | + | + | _ | + |
| 8. | Cylindrospermum*) | _ | _ | + | + | _ | _ | + | + | _ | _ |
| 9. | Lyngbya | + | + | + | + | _ | + | + | + | + | + |
| 0. | Mastigocladus*) | _ | _ | _ | _ | + | _ | + | + | + | _ |
| Type of microorganisms | P | 1 a | c e | is | s o . | la: | t e | d | |||
|---|---|---|---|---|---|---|---|---|---|---|---|
| 1 | 2 | 3 | 4 | 5 | 6 | 7 | 8 | 9 | 10 | ||
| 11. | Microcystis | _ | _ | _ | _ | _ | _ | _ | + | _ | _ |
| 12. | Nostoc*) | + | + | + | + | - | + | + | + | + | + |
| 13. | Oscillatoria | + | + | + | + | + | + | + | + | + | - |
| 14. | Phormidium | - | - | - | + | - | - | + | - ' | - | |
| 15. | Scytonema*) | _ | _ | - | _ | - | _ | - | + | _ | - |
| 16. | Tolypothrix*) | + | + | + | + | + | _ | + | + | + | + |
Explanation
- + : Isolated/obtained
- : Not obtained
- *) : Classified as Nitrogen-fixing microorganisms
- 1 (pulp plant), 2 (paper plant), 3 (ditch near warehouse),
- 4 (ditch in housing complex), 5 (ditch leaving housing complex/Sempol river), 6 (ditch entering rice field area), 7 (rice field area near village), 8 (rice field area
- 1 3 Km from village), 9 (control 1), 10 (control 2).
Nitrogen-fixing Microorganisms
Nitrogen-fixing microorganisms living in soil or water habitats can be used as pollution parameters. The higher the concentration of pollutants contaminating a certain habitat, the lower the number of microorganisms found in it. As discussed by Riviere & Hamdy (1974) and Mitchell (1972), nitrogen-fixing activity is proportional to the occurence of the acetylene reduction process. This process is inhibited by the presence of metabolite toxics so that the microorganisms are unabled to carry out nitrogen-fixation necessary for their existence.
13 genera of nitrogen-fixing microorganisms were isolated from the samples, consisting of 4 genera of bacteria, and 9 genera of blue-green algae (Table 5).
Bacteria classified as active nitrogen-fixing bacteria for agricultural lands are: Azotobacter chroococcum, Clostridium pasteurianum and Pseudomonas fluorescens.
For the blue-green algae isolated consist of Anabaena cylindrica, A. flos-aquae, Calothrix brevissima, C. parietima, Nostoc commune, N. muscorum and Tolypothrix tenuis.
Table 5. Density estimation of nitrogen-fixing microorganisms in habitats contaminated by waste effluents and control.
| Type | of microorganisms | H a | Ьi | t a | t | 0 | b t | ain | l | |||
|---|---|---|---|---|---|---|---|---|---|---|---|---|
| 1 | 2 | 3 | 4 | 5 | 6 | 7 | 8 | 9 | 10 | |||
| BACTI | ERIA | |||||||||||
| 1. | Azotobacter | a) | _ | - | - | - | - | _ | +++ | +++ | ++ | + |
| 2. | Clostridium | b) | - | + | ++ | + | ++ | ++ | +++ | +++ | ++ | + |
| 3. | Pseudomonas | c) | - | + | + | + | + | - | ++ | +++ | ++ | + |
| 4. | Xanthomonas | - | - | _ | - | _ | _ | _ | ++ | - | _ | |
| 1. | Anabaena | d) | - | + | + | + | + | - | +++ | +++ | ++ | ++ |
| 1. | Anabaena | d) | _ | + | + | + | + | _ | +++ | +++ | ++ | ++ |
| 2. | Anabaenopsis | - | - | + | + | + | + | ++ | +++ | - | - | |
| 3. | Aulosira | - | - | - | - | - | - | - | ++ | ++ | + | |
| 4. | Calothrix | e) | + | + | + | + | + | + | ++ | +++ | ++ | + |
| 5. | Cylindrospermu | m | - | - | + | + | + | - | ++ | ++ | - | ++ |
| 6. | Mastigocladus | - | - | - | - | - | - | + | ++ | - | - | |
| 7. | Nostoc | f) | + | + | + | + | + | _ | +++ | +++ | ++ | ++ |
| 8. | Scytonema | - | - | - | - | - | - | - | ++ | - | _ | |
| 9. | Tolypothrix | g) | + | + | + | + | + | - | +++ | +++ | +++ | ++ |
Explanation
- a) species isolated : Azotobacter chroceccum
- b) species isolated : Clostridium pasteurianum
- c) species isolated: Pseudomonas fluorescens
- d) species isolated : Anabaena azollae, A. cylindrica, A.
flos-aquae, A. circularis, A. fertillissima
- e) species isolated : Calothrix brevissima, C. parietima,
- C. sphaerica, C. licheniforme
- f) species isolated : Nostoc commune, N. muscorum, N.
punctiforme
g) species isolated : Tolypothrix tenuis
- : not obtain
+: 1 - 25 % isolated
++ : 26 - 50 % isolated
+++ : 50 - 75 % isolated
++++ : more than 75 % isolated.
Cellulose degradating bacteria
Special measurements of cellulose and cellulose derivatives degradating bacteria were conducted on rice fields contaminated by waste effluents (area 8) and rice fields uncontaminated by waste effluents (area 9). Types of bacteria used as parameters were: Achromobacter, Bacillus, Clostridium, Celluibrio, Ervinia, Flavobacterium and Pseudomonas (Walters & Elphick, 1968).
Results obtained (Histogram 1) showed that a difference in bacterial population occured in contaminated and uncontaminated rice fields.
Measurements of difference in contaminated and uncontaminated rice fields show that the highest in difference was reached by Cellvibric (3.04 times), Clostridium (2.44 times), Pseudomonas (2.25 times), with the rest under 1.5 times.
Table 6. The effect of waste efficients on rice plants in greenhouse condition
| n | Result from each experimental group | |||||||||
|---|---|---|---|---|---|---|---|---|---|---|
| Basin Number and specification | I | 11 | 111 | I۷ | V | |||||
| i.a. Number of stalks on each rice plant | 10, 12, 11, 11, 13 | 14, 16, 12, 10, 11 | 14, 14, 15, 13, 14 | 5,4,3,6,4, | 13, 14, 12, | |||||
| b. Stalk height (Cm)*) | 114,118,121, 122,119 | 122, 99,104, 102,115 | 98,130,122, 119,120 | 88, 98,114, 121, 86 | 92,105,116, 94, 89 | |||||
c. Product/dry weight of each
string (Gr)*) | 12,11,13,9, 14 | 14,14,13,11, | 22,9,11,16, 17 | 6,8,7,6,11 | 14,11,9,8,8 | |||||
| 2.a. | 11,13,11,10, 14 | 13,11,12,13, 14 | 16,18,19,21, 18 | 6,4,6,3,5 | 11,12,11,11, 10 | |||||
| b. | 110,121,112, 114,120 | 89,99,124, 121,130 | 130,89,98. 114,132 | 80,82,92, 105,112 | 89,120,88, 72,81 | |||||
| с. | 16,14,15,17, 12 | 15, 16, 15, 14, 12 | 14,18,18, 19,21 | 14,11,12, 9,8 | 12,9,7,8,6, | |||||
| 3.a. | 12,11,14,15, 14 | 14,16,16, 18,19 | 18,19,23, 24,21 | 8,2,4,6, 10 | 12,14,12,18, 11 | |||||
| b. | 98,98,114, 124,112 | 112,105,113, 106,122 | 114,120, 99, 111,119 | 113,105, 98, 78,89 | 79,105,112, 120,90 | |||||
| с. | 16,11,10, 9,14 | 18,18,11, 9,11 | 14,16,11,9, 20 | 9,6,11,14, 12 | 16,6,7,18, 7 | |||||
| 4.a. | 12, 11, 15, 15, 13 | 15,16,16, 12,13 | 19,12,18, 21,24 | 4,6,8,2,3, | 13,12,11,14, 16 | |||||
| b. | 99,100,108, 122,120 | 98,99,104, 105,116 | 99,100,120, 124,130 | 89,89,72, 101,120 | 88,79,99, 105,102 | |||||
| c. | 12,15,16,12. 9 | 14,12,12, 18,19 | 11,12,13, 16,19 | 16,11,12, 6,7 | 14,11,16,11 14 | |||||
| 5.a. | 14,12,11, 15,12 | 15,16,18, 21,20 | 18,12,13, 11,19 | 3,6,4,4,5 | 11,12,11,10, 9,10 | |||||
| b. | 89,104,112, 105,111 | 89,114,130, 121,120 | 101,98,122, 130,121 | 88,78,105, 121,108 | 80,72,111, 102,112 | |||||
| с. | 14,8,16, 15,14 | 14,9,8,9, 11 | 21,20,19, 18,17 | 16,11,12, 11,9 | 14,15,11,11. 9 | |||||
| verage product | ||||||||||
| 12.3 | 14.8 | 17.3 | 4.8 | 12.5 | |||||
| o. Stalk height (Cm) | 113.4 | 115.9 | 119.2 | 97.2 | 93.2 | |||||
| . Product/dry weight of each string | 12.9 | 13.0 | 16.4 | 10.2 | 10.8 | |||||
*) Average value from each plant.
Cellvibrio and Clostridium are classified as the most active cellulose and cellulose derivatives degradating bacteria for soil habitats.
Influence of Waste Effluents on Rice Plants
The reason of applying this method is to study the presence of waste effluents on agricultural land area, and their effects on rice plants in relation to the above mentioned data (Tables 2, 3, 4, 5, and Histogram 1).
Artificial sterile soil consisting of sand and straw following the U.C.-Soil Mix. (Baker, 1957) was used to ascertain waste effluents effects.
Measurements were first conducted towards counting the number of rice stalks on each plant, and the length of the stalks. Secondly, measurements were conducted before blooming phase of the rice plants. Further measurements were performed to count production from each rice plant after harvesting. The calculations conducted were based upon dry weights, to avoid additional weight caused by different weight of wet rice-straws.
Results from total count showed that experimental basins inoculated with waste effluents gave better results compared to uninoculated experimental basins (control). This was particularly visible in the second and third experimental rows, consisting of waste effluents supplemented with domestic effluents (ditch) and soil microflora-culture solution isolated from sample treatments. The result compared to control 1 (IV), control 2 (V) was widely different:
Table 7. The effect of waste effluents on rice plants
| Result obtained from treatment | ||||||||||
|---|---|---|---|---|---|---|---|---|---|---|
| I | II | III | IV | V | ||||||
| Number of stalks | 12.3 | 14.8 | 17.3 | 4.8 | 12.5 | |||||
| Stalk length (cm) | 113.4 | 115.9 | ыіу.2 | 97.2 | 93.2 | |||||
| Weight of each paddy stem (gr) | 12.9 | 13.0 | 16.4 | 10.2 | 10.8 | |||||
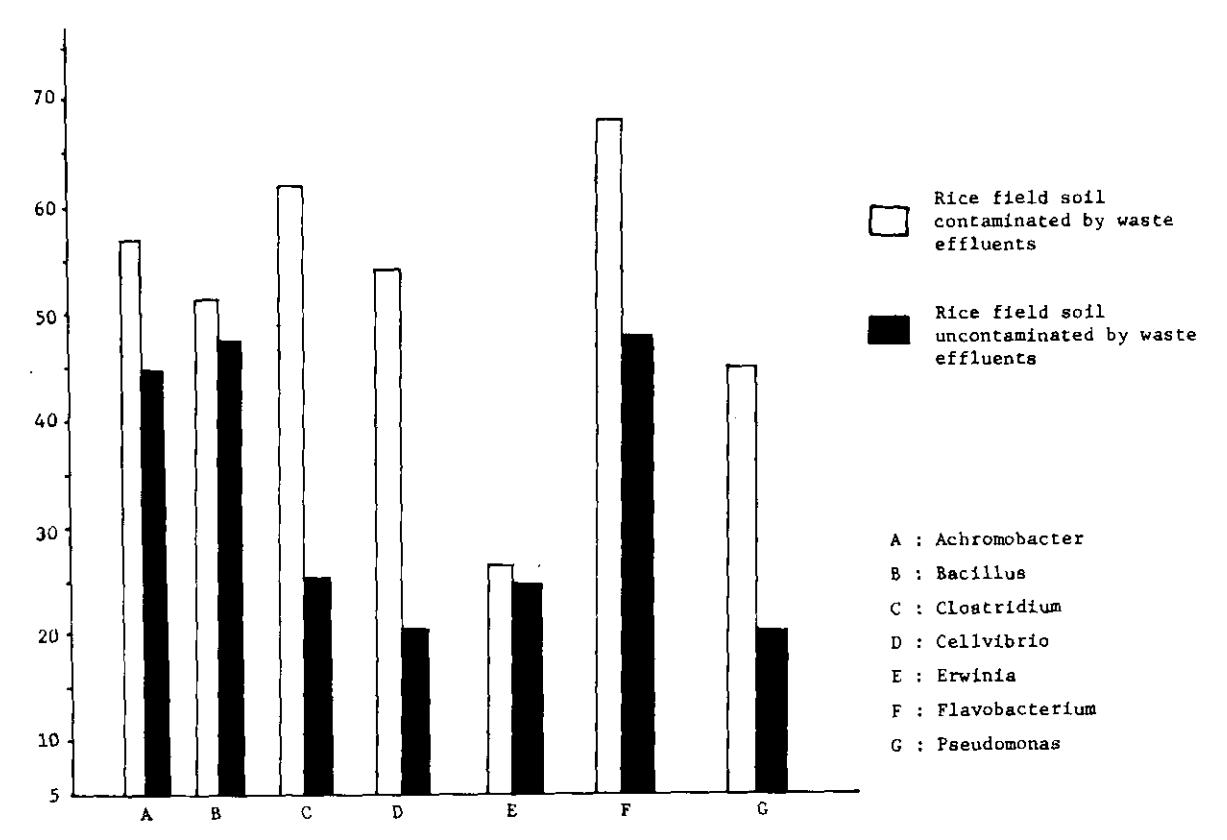
Histogram 1: Comparison of cellulose and cellulose-derivatives degradating bacteria in rice field soil contaminated and uncontaminated by waste effluents.
Addition of domestic effluents containing active decomposing microorganisms (particularly bacteria) resulted in that the mill waste effluents were not of a toxic substance towards rice plants. This was further induced if to the above mentioned waste effluents a certain amount of decomposing bacterial culture was inoculated (such as those isolated from Letjes paddy fields) resulting in that negative effects from the waste effluents were completely unobious but on the contrary beneficial. Results obtain from other treatments utilizing only waste effluents without other supplements showed a distinct difference. Mill waste effluents without the addition of fertilizers also give low results (Table 6).
The results of this study agree with the opinions of the Letjes agricultural community with whom repeated discussions have been conducted, on the influence of the mill waste effluents towards their crops. The presence of waste effluents increase their agricultural productions and also economize the application of fertilizers. Whereas if they usually have to use 100 kgs per hectare, with the presence of waste effluents they only have to use 60 - 80 kgs per hectare.
The addition of organic substances into the soil greatly influenced the chemical and physical condition of the soil, particularly physical properties are directly effected. This results in that solubility of elements added into the soil (in the form of fertilizer) increases. Furthermore absorption and utilization of elements by roots is increased, and in addition to that the agricultural lands of Letjes are vulcanic, so that the soil organic content greatly benefits for agriculture.