

SARI
Telah dilakukan satu seri percobaan pengolahan air buangan kota dengan menggunakan proses kontak-stabilisasi pada berbagai variasi harga umur sludge, sludge recycling rate, waktu retensi di dalam reaktor kontak dan reaktor stabilisasi, pada temperatur konstan. Berdasarkan nilai yang diperhitungkan dari hasil percobaan, telah dicoba untuk mengembangkan sebuah model kinetik tentang kecepatan pertumbuhan bakteri nitrifikasi (nitrifier)
bangkan sebuah model kinetik tentang kecepatan pertumbuhan bakteri nitrifikasi (nitrifier) di dalam reaktor kontak sebagai fungsi dari umur sludge dan fraksi biomas di dalam kontak reaktor.
Selanjutnya, dalam percobaan ini juga diamati pengaruh parameter-parameter tersebut terhadap efisiensi nitrifikasi. Dan dari hasil percobaan juga telah dihitung kecepatan penghilangan ammonia sebagai fungsi dari Volatile Suspended Solids yang terbentuk dan pemakaian nitrogenammonia oleh mikroorganisme.
Dept. of Sanitary Engineering, Institute of Technology Bandung, Jl. Ganesha no. 10, Bandung – Indonesia
** Dept. of Sanitary Engineering - Faculty of Engineering Chulalongkord University, Bangkok - Thailand
*** Laboratoroire de Chimie et Genic de l'Environnement INSA Toulouse, Avenue de Rangueil, 31077 Toulouse France
INTRODUCTION
It has been shown that the degree of nitrification in a contact-stabilization process is influenced by sludge recycling rate, R and the fractional biomass in contact reactor \(\alpha\), (Gujer and Jenkins, 1975 a, and Zoltex and Lefebvre, 1976) in addition to sludge age, \(\tau_{\rm b}\), for the conventional activated sludge process (Downing et al, 1964).
This study will demonstrate experimentally the influence of those parameters on the nitrifiers growth rates in a contact reactor \((k_{NC})\) and on their nitrification efficiency \((\eta_{nit})\).
The values of \(\alpha\) were not chosen but, by varying contact and stabilization reactors volumes (\(V_c\) and \(V_s\)), and \(\tau_b\) and R values, then the \(\alpha\) values will also automatically vary. Consequently, the actual hydraulic retention time in contact and stabilization reactor (\(t_{AC}\) and \(t_{S}\)) will also vary.
THEORITICAL BACK GROUND
The oxidation of ammonia (nitrification) is mediated by two distinct genera of autotrophic aerobic bacteria.
The organisms Nitrosomonas are responsible for the conversion of \(NH_4^+\) to nitrite (nitritation) and Nitrobacter subsequently converts nitrite to nitrate (nitratation).
In general, the reaction can be expressed as:
\[NH_4^+ + O_2 \xrightarrow{Nitrifying bacteria} NO_3^- + H_2O + 2H^+\] (1)
The overall nitrifier growth rates in the contact-stabilization process \((k_{N\,T})\) is given by the growth balance within the contact and stabilization reactors, i.e.
\[k_{NT} = \frac{1}{\tau_b} = \alpha k_{NC} + \beta k_{NS} - k_{2N} (\alpha + \beta)\] (2)
where: \(k_{2N}\) = nitrifiers decay rate (day<sup>-1</sup>)
\(K_{NS}\) = nitrifiers growth rate in the stabilization reactor (day<sup>-1</sup>)
\(\beta\) = fraction of biomass in the stabilization reactor
\[\alpha = \frac{M_C}{M_T}\] and \(\beta = \frac{M_S}{M_T}\) (3)
Where \(M_T\), \(M_C\) and \(M_S\) represents the total biomass present in the system, contact and stabilization reactors respectively.
Assuming that the fraction of biomass in the settling tank is negligible, therefore \(\alpha + \beta = 1\), equation (2) can be reduced to:
\[k_{NS} = \frac{k_{NT} - \alpha \cdot k_{NC} + k_{2N}}{\beta}\] (4)
Gujer and Jenkins (1975 a) defined a dimensionless group A:
\[A = \frac{\alpha k_{NC}}{\beta k_{NS}} + 1 \tag{5}\]
Introducing equation (5) into (4), after arrangement yields:
\[k_{NC} = \frac{(A-1)(k_{NT} + k_{2N})}{\alpha \cdot A}\] (6)
In any case, the ammonia nitrogen concentration in the stabilization reactor is much lower than the oxidized nitrogen concentration \((N_{OS})\), and assumed to be negligible.
The nitrification efficiency \((\eta_{nit})\) can then be written as:
\[\eta_{\text{nit}} = \frac{N_{\text{OC}}}{N_{\text{OS}}} \tag{7}\] where \(N_{OC}\) = oxidized nitrogen concentration in the contact reactor (mg/1) and according to Gujer and Jenkins (1975 a):
\[\eta_{\text{nit}} = \frac{1}{1 + \frac{1}{AR}} \tag{8}\]
If equation (8) is used to eliminate A from equation (6), \(k_{NC}\) becomes:
\[k_{NC} = \frac{k_{NT} + k_{2N}}{\alpha} \left[1 + R - \frac{R}{\eta_{nit}}\right]\] (9)
Using the value of \(k_{2N}\) given in the literature, \(k_{NC}\) can then be determined by the experimental values of \(k_{NT}\), R and \(\eta_{nit}\).
MATERIALS AND METHOD
The experiments were carried out in two small pilot contact-stabilization process plants, which were operated in parallel. Figure 1 represent its process flowsheet. The contact and stabilization reactors were made from double envelope plexiglass to maintain thermoregulation, and the settling tanks were cone pyrex glasses of 3.5 and 2.5 1.
Clarified raw sewage from Toulouse city conserved at 4°C were fed into the contact reactor at a constant rate of 1.25 l/h or 36 l/day by means of a small
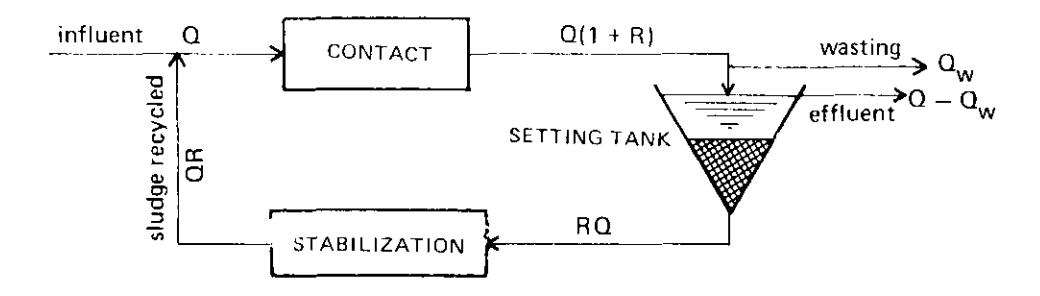
Figure 1. Flowsheet of the Contact-Stabillization Process.
peristaltic pump. The average charateristics of raw sewage are given in table 1.
The temperature of the experiments were maintained constant at \(21^{\circ}C\) (\(\pm 2^{\circ}C\)) and the volumes of the contact and stabilization reactors varied according to the operational \(t_{AC}\) and \(t_{S}\). Various \(\tau_{b}\), R, \(t_{AC}\) and \(t_{S}\) were performed during the experiments. Data were taken only after steady state condition was achieved which was identified by monitoring the ammonia and nitrate concentration in the effluent and waiting until these became relatively constant. The average value of three samples for a specific condition was used as the representative data.
Ammonia concentration was determined by Nessler's method according to Norme NFT 90-015 August, 1975, and nitrate by the phenol disulphonic method according to Norme NFT 90-012 February, 1952.
| Table 1. The Average Characteristic of | the Raw Sewage Untilized for Feeding the |
|---|---|
| Pilot Plan. |
| τb (Days) | Dissolved COD (mg/1) | N-NH4 (mg/1) | N-NO2 | N-NO3 | Soluble Organic N (mg/1) | S S (mg/1) | рΗ |
|---|---|---|---|---|---|---|---|
| 2 | 169 | 24,9 | 0,6 | 1,1 | 6,0 | 123 | 7,98 |
| 5 | 177 | 28,5 | 0,4 | 0,5 | 12,6 | 126 | 7,77 |
| 10 | 182 | 31,3 | 0,4 | 0,7 | 6.1 | 158 | 7,94 |
| 15 | 176 | 34,3 | 0,1 | 0,3 | 4,7 | 220 | 7,97 |
| 30 | 209 | 32,6 | 0,2 | 0,3 | 7,2 | 149 | 7,74 |
RESULTS AND DISCUSSIONS
Nitrifiers growth rate in the contact reactor \((k_{NC})\)
Downing, Painter and Knowles (1964) showed that the nitrification rate is directly dependent upon the nitrifiers growth rate. As there were not any nitrite accumulation in the reactors, the nitrification process was thus controlled by the nitritation rate.
Nitrosomonas growth rate in the contact reactor can be determined by the equation (9).
\[k_{NC} = \frac{k_{NT} + k_{2N}}{\alpha} \left(1 + R - \frac{R}{\eta_{nit}}\right)\]
A study conducted by Prince Agbodjan (1977) on the same raw sewage, demonstrated a \(k_{2N}\) value of = 0.05 day<sup>-1</sup>. By using this value, \(k_{NC}\) can be calculated based on the experimental values, with the exception of \(\tau_b = 2\) days as the \(\eta_{nit}\) obtained were to feeble. A model of \(k_{NC}\) as a function of \(\alpha\) and \(\tau_{\rm b}\) was developed from the calculated values of \(k_{\rm NC}\). Figure 2 shows the calculated k<sub>NC</sub> values from the experiment results for differents values of \(\tau_{\rm b}\) (5, 10, 15 and 30 days), as a function of \(\alpha\). A general correlation of \(k_{\rm NC}\)can be drawn from these figures, namely:
\[(k_{NC})_n = a_n (\alpha)^{-b_n}\]
\(n = 1, 2, 3, ...\) (10)
for \[\tau_b\] = 5 days \(k_{NC}\) = 0.474 (\(\alpha\))-0,273 day-1 \(\tau_b\) = 10 days \(k_{NC}\) = 0.310 (\(\alpha\))-0,286 day-1 \(t_b\) = 15 days \(k_{NC}\) = 0.206 (\(\alpha\))-0,397 day-1 \(t_b\) = 30 days \(t_{NC}\) = 0.133 (\(\alpha\))-0,581 day-1
In order to express \(k_{NC}\) as a function of \(\tau_b\), it should follow the evolution of \(a_n\) and \(b_n\) as a function of \(\tau_b\), as shown in fig. 3. The relations can be describe as follows:
\[a_n = 1.544 (\tau_b)_n^{-0.724}\] with \(r^2 = 0.992\) (11)
\(b_n = 0.228 e^{0.32(\tau_b)}n\) with \(r^2 = 0.959\) (12)
\[b_n = 0.228 e^{0.32(\tau_b)} n\] with \(r^2 = 0.959\) (12)
Introducing the equations (11) and (12) into (10), yields:
\[k_{NC} = 1.544(\tau_b)^{-0.724} (\alpha)^{-0.228} e^{0.032(\tau_b)}\] (13)
Expression (13) shows the dependency of the nitrifiers growth rates in the contact reactor on sludge age and fraction of biomass \(\alpha\). For low values of sludge age, the variation in k<sub>NC</sub> is not as important as high values (Fig. 4). As the quantity of nitrifiers vary directly to sludge age, k NC can be limited by substrate concentration while \(\alpha\) is increased. This limit is easier achieved by high values of sludge age. When \(\alpha\) is small, \(k_{NC}\) achieves the maximum
values of \(k_{oN}\), and isn't dependent anymore on the ammonia nitrogen concentration. Prince Agbodjan (1977) found a value of kon in the order of 1.2 day<sup>-1</sup> which is more or less related to the value given by Knowless et al (1965), i.e. 1.5 day<sup>-1</sup>.
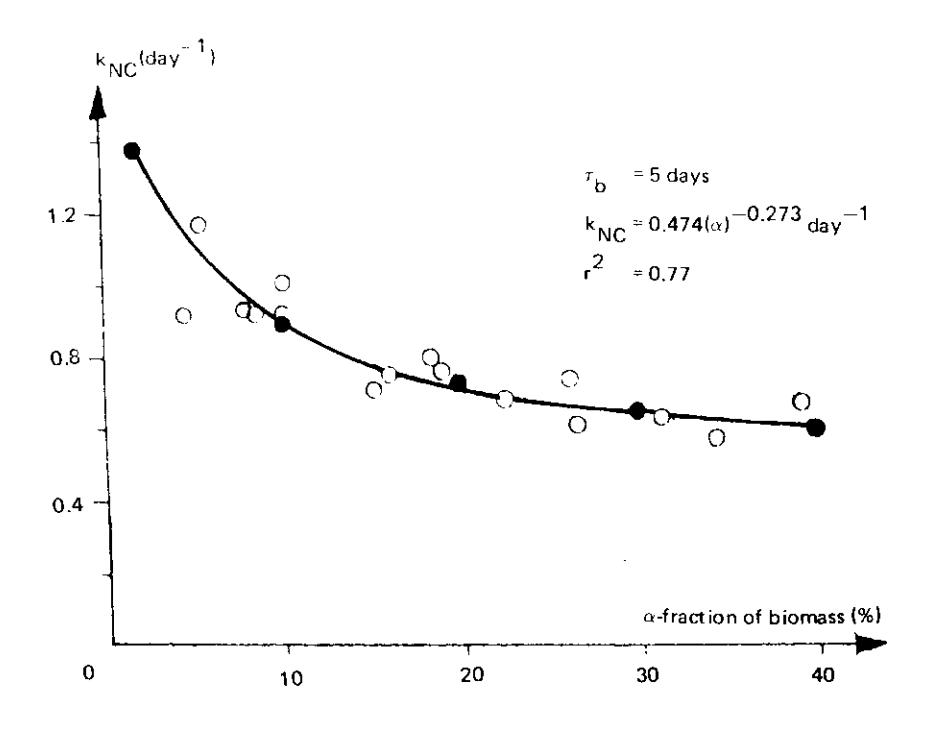
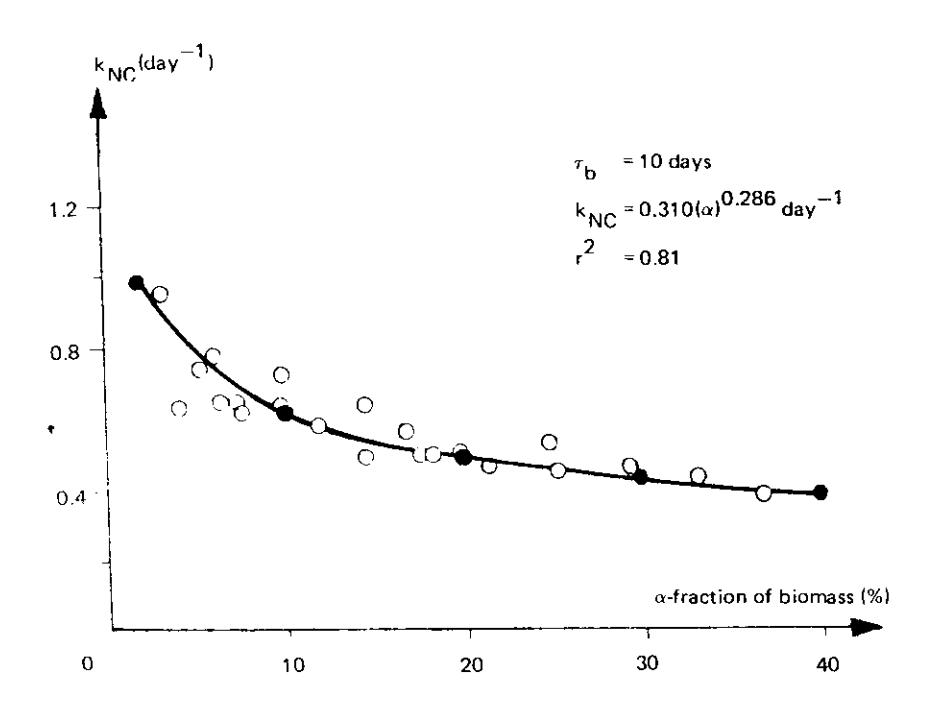
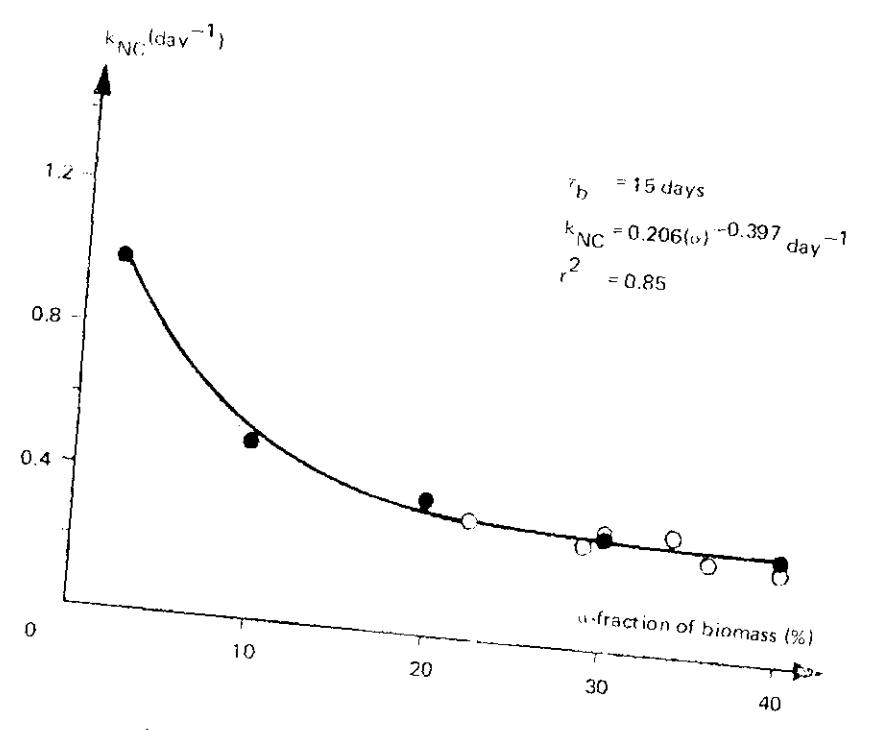
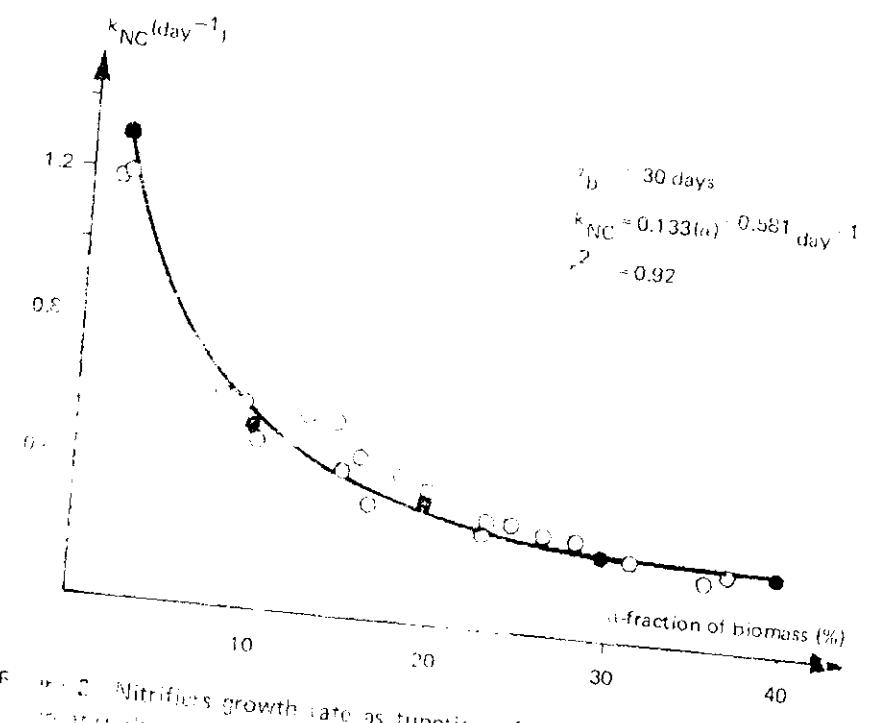
Fig. 2. Mitrifiers growth rate as function of fraction of biomass in contact reactor for it studge age.
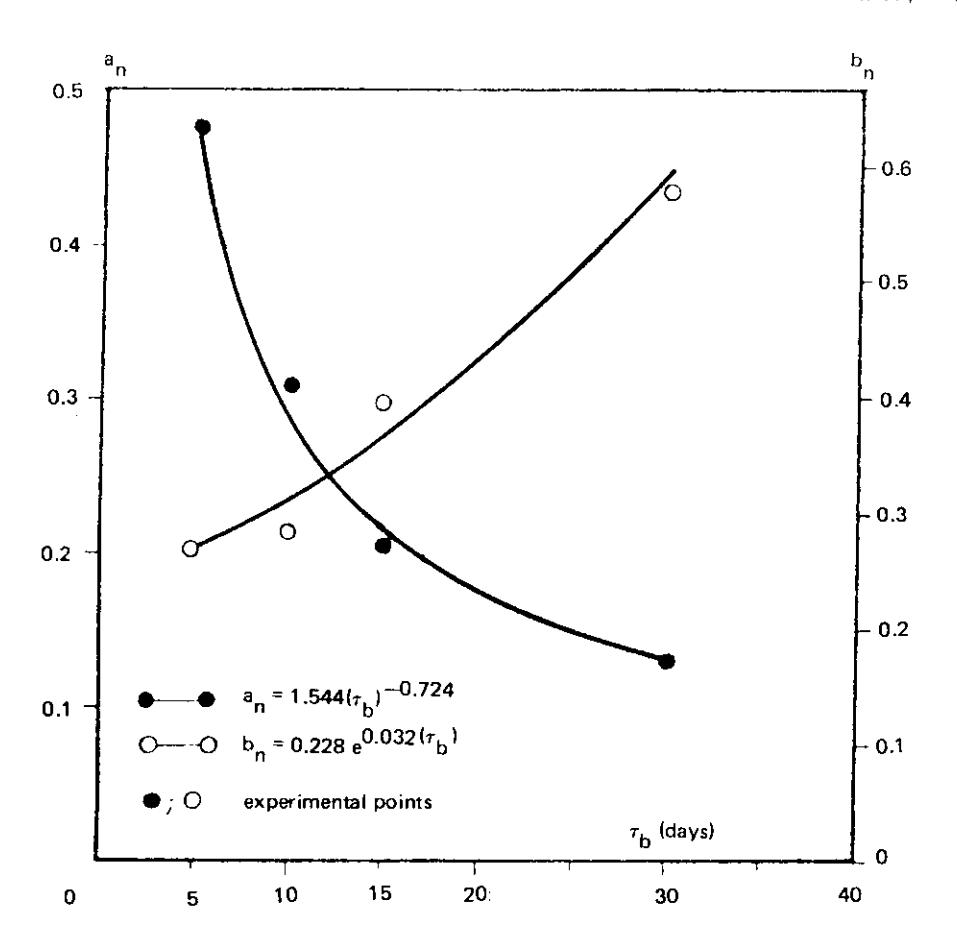
Figur 3. Evolution of \(a_n\) and \(b_n\) as function of sludge age.
Nitrification efficiency
Nitrification efficiency can be defined as the ration of oxidized nitrogen concentration and total nitrogen concentration in the contact reactor.
\[\eta_{\text{nit}} = \frac{N_{\text{OC}}}{N_{\text{OC}} + (N_{\text{NH}_4} +)_C}\] (14)
Where \((N_{NII_4}^+)_C\) = ammonia nitrogen concentration in the contact reactor (mg/1).
As the nitrifiers growth artes are slower than the heterotrophs a high degree of nitrification would be attained at a relatively high sludge age \(\tau_b\).
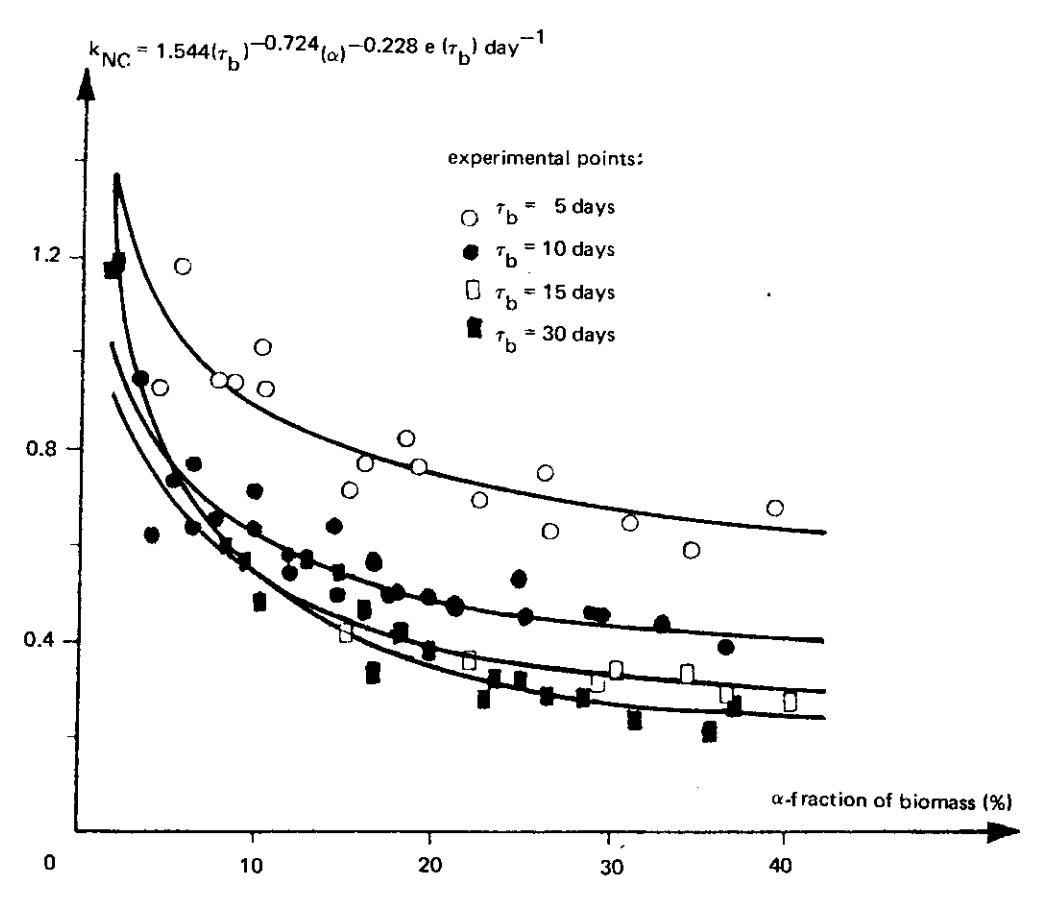
Figure 4. Calculated nitrifiers growth rate according to equation (13) as function of fraction of biomass in the contact reactor (a).
The experimental results show that significant nitrification were obtained at a \(\tau_b\) equal to or higher than 5 days, and it achieve a value near to 100% for \(\tau_b \ge 10\) days (figure 5, the relations between \(V_C, V_S\) and R with \(t_{AC}\) and \(t_S\) is shown in table 2).
With regard to the parameter R, a low value of R results in only a small fraction of the influent ammonia being recycled into the stabilization reactor, and consequently this results in a low process nitrification efficiency. In contrast a high value of R gives a relatively smaller difference between the concentration of biomass in the contact and stabilization reactors which will give approximately the same effect as a conventional activated sludge process. Figure 6 shows the influence of R on nitrification efficiency for a given condition (\(\tau_b = 10\) days, and \(V_3 = 3.75\) 1). At this condition, R = 200% gave considerable result in nitrification efficiency.
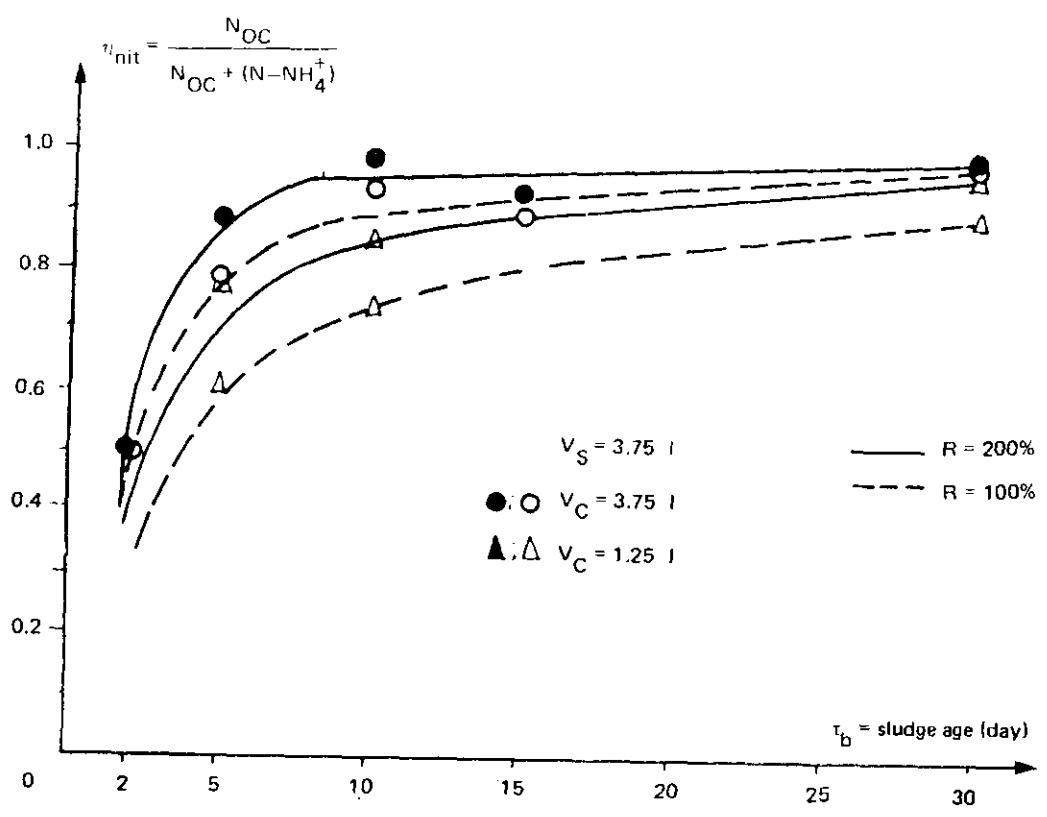
Figure 5. Nitrification efficiency as a function of sludge age for different volumes of contact reactors and recycling rates.
On the other hand, for \(\tau_b \ge 5\) days, the ammonia nitrogen concentration in the stabilization reactor gave low values (< 1.0 mg/l) compared to the oxidized nitrogen concentration in the same reactor (Nos), this value can be neglected. However, Nos in concidered as the maximum concentration that can be oxidized. Furthermore, the nitrification efficiency \(\eta_{\rm nit}\) can be expressed by the equation (1)
\[\eta_{nit} = \frac{N_{OC}}{N_{OS}}\]
Figure 7 represents the evolutions of nitrification efficiency calculated by the equation (7) as a function of \(\alpha\), for \(\tau_b\) equal to 5, 10, 15 and 30 days respectively. The curves described are given due to equation (8).
\(\eta_{nit}\) attains maximum (nearly 100%) value when \(\alpha\) and R are significants. In contrast, if these two parameters were to decrease, \(\eta_{nit}\) also decreases. As the overall efficiency depends at the same time on the partial efficiency in the
Table 2 Relations between volumes of contact reactor \((V_c)\) stabilization reactor \((V_S)\) and sludge recycle rate (R) with the actual hydraulic retention times in contact \((t_{CR})\) and stabilization \((t_S)\) \((t_C\) =nominal hydraulic retention time in contact reactor = \(V_C/\Omega\)).
| CONTACT REACTOR | R | STABILIZATI | ON REACTOR | ||
|---|---|---|---|---|---|
| VC (L) | tC (MN) | tAC (MN) | (%) | Vs (L) | ts (MN) |
| 3.75 | 180 | 60 | 200 | 3.75 | 90 |
| 3.75 | 180 | 72 | 150 | 3.75 | 120 |
| 3.75 | 180 | 90 | 100 | 3.75 | 180 |
| 2.50 | 120 | 40 | 200 | 7.50 | 180 |
| 2.50 | 120 | 48 | 150 | 7.50 | 240 |
| 2 50 | 120 | 60 | 100 | 7.50 | 360 |
| 2.50 | 120 | 72 | 67 | 7.50 | 540 |
| 1.25 | 60 | 20 | 200 | ||
| 1.25 | 60 | 24 | 150 | ||
| 1.25 | 60 | 30 | 100 | ||
| 1.25 | 60 | 36 | 67 | ||
two reactors, then if \(\alpha\) tended to become zero, the nitrification efficiency in the contact reactor would also tend to become zero. Moreover, the overall efficiency arose from the stabilization reactor efficiency alone.
If \(\tau_b\) is high enough to maintain autotroph growth then the nitrification kinetic is quite independent from the kinetics of the hydrocarbon matter. It was observed that, even if the substrate utilisation rate in the contact reactor attained a high value, i.e. 17.3 g COD/g. VSS day or equal to 1.7 g COD/g VSS. day for the overall system, the nitrification process was established.
On the other hand, a very high \(\tau_b\) (i.e. 30 days), caused the microorganisms to go into the respiration endogenous phase, especially in the stabilization reactor. The resulting cellslyse caused the release of their nitrogen matter in to the reactor. This will result in a calculated \(\eta_{nit}\) that is lower than expected.
Ammonia removal rate as a function of VSS
It is difficult to determine the nitrifiers concentration in a mixed culture. In this experiment it was not measured. Several authors expressed the ammonia removal rate as a function of VSS (Erickson, 1975, Adams & Eckenfelder, 1977, Zoltex & Lefebvre, 1976 and Wild et al., 1970).
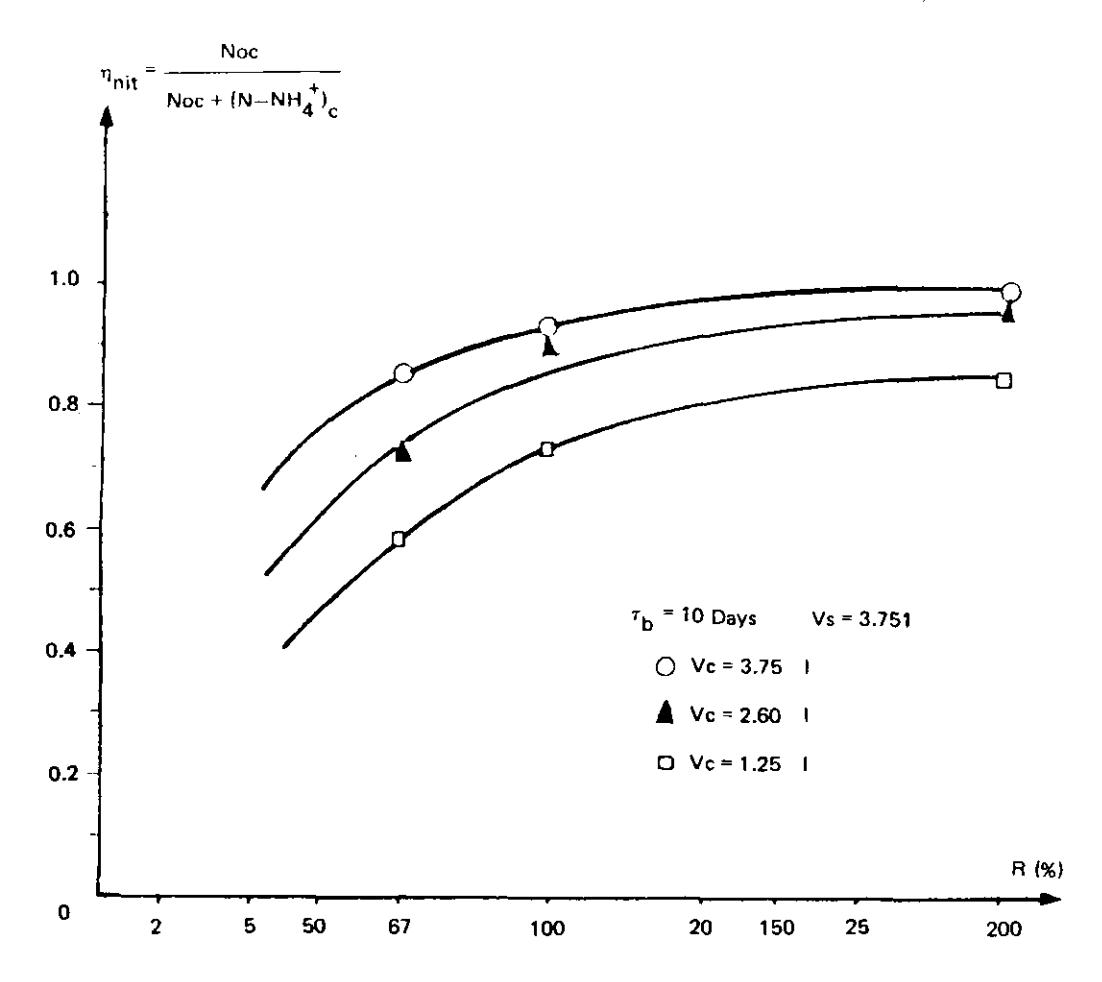
Figure 6. Influence of recycling rate on nitrification efficiency.
\[U_{N-NH_4}^{+} = \frac{1}{M} \frac{d(N-NH_4^{+})}{dt} = \frac{mg N-NH_4^{+} removal}{mg VSS day}\] (15)
where M = Total biomass in the reactor (mg)
But as the nitrifiers fraction in VSS in reality is not constant, this relation (15) is applicable only for well determined operation conditions.
In observing the evolution of the ammonia removal rate (function of total VSS total in the contact reactor) as a function of the hydraulic retention time in the contact reactor, not any good correlation could be drawn out during the experiments. But in any case, the ammonia removal rate varied between 0.04-0.2 g N-NH<sub>4</sub><sup>+</sup>/g VSS day, which is comparable to the values given by other authors (table 3.)
| UN-NH4+ | Operational Conditions | Authors |
|---|---|---|
| 0.18 | pH = 8.5 domestic sewage | Wild et al. 1970 |
| 0.072 0.053 | 18°C domestic sewage 12°C domestic sewage | Erickson, 1975 |
| 0.011 | Batch system, domestic sewage | Zoltek & Lefebvre 1976 |
| 0.04 0.2 | 21°, Municipal Wastewater | This study |
Table 3. Ammonia Removal Rate given by several authors.
.1mmonia nitrogen consumption by the microorganisms
The quantity of ammonia nitrogen consumed by the microorganisms depend on its growth and physiological conditions. In municipal wastewater treatment, the mixed culture consists of heterotrophs which oxidize the organic matter, and autotrophs which transform the major fraction of ammonia nitrogen to nitrates. The remaining fraction of ammonia nitrogen is consumed for cells synthesis. As the concentration of the autotrophs and their conversion coefficient are relatively feeble compared to the heterotrophs it is then assumed that ammonia nitrogen are exclusively consumed by the heterotrophs. Several authors proposed an emphirical formula for the microorganisms, as follows: C<sub>5</sub>H<sub>7</sub>O<sub>2</sub>N (Hoover & Porgres, 1952, and Christensen & Mc.Carty, 1975), and others as: C<sub>5</sub>H<sub>7</sub>O<sub>2</sub>NP<sub>0,2</sub> (WPCF, ASCE, 1977). According to the above formula, 11.8-12.4\% of the microbial mass consists of nitrogen matter. Observing the total wasted sludge per day for a given sludge age \((\tau_b)\) and the quantity of nitrogen losses (between influent and effluent) during the experiments, the percentage of nitrogen consumed for microorganism synthesis can be calculated. The experimental results (tabel 4) show that this percentage is relatively constant (\(\pm 14\%\) in average) for any value of \(\tau_b\). Variations in the order of 5% was probably caused by experimental error (denitrification process and in determination).
Table 4. Percentage of N in the VSS.
| b (days) | Nitrogen Comsumed by the VSS Produced (%) |
|---|---|
| 2 | 13.74 |
| 5 | 15.86 |
| 10 | 12,17 |
| 15 | 11,95 |
| 30 | 16.50 |
| Average | 14.04 |
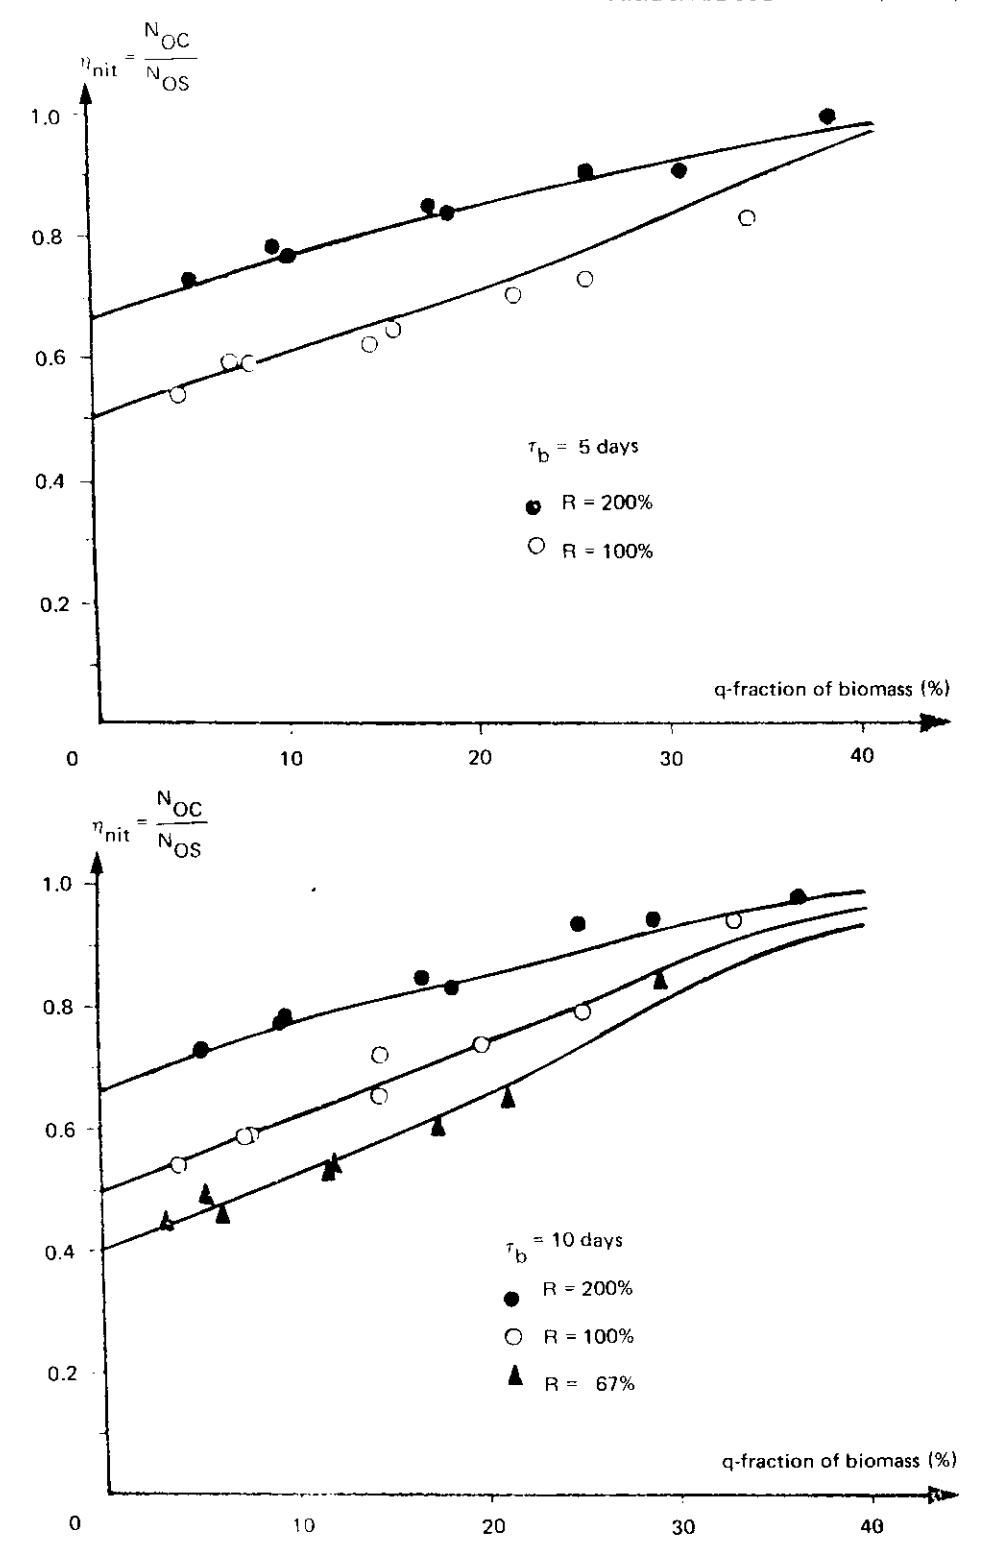
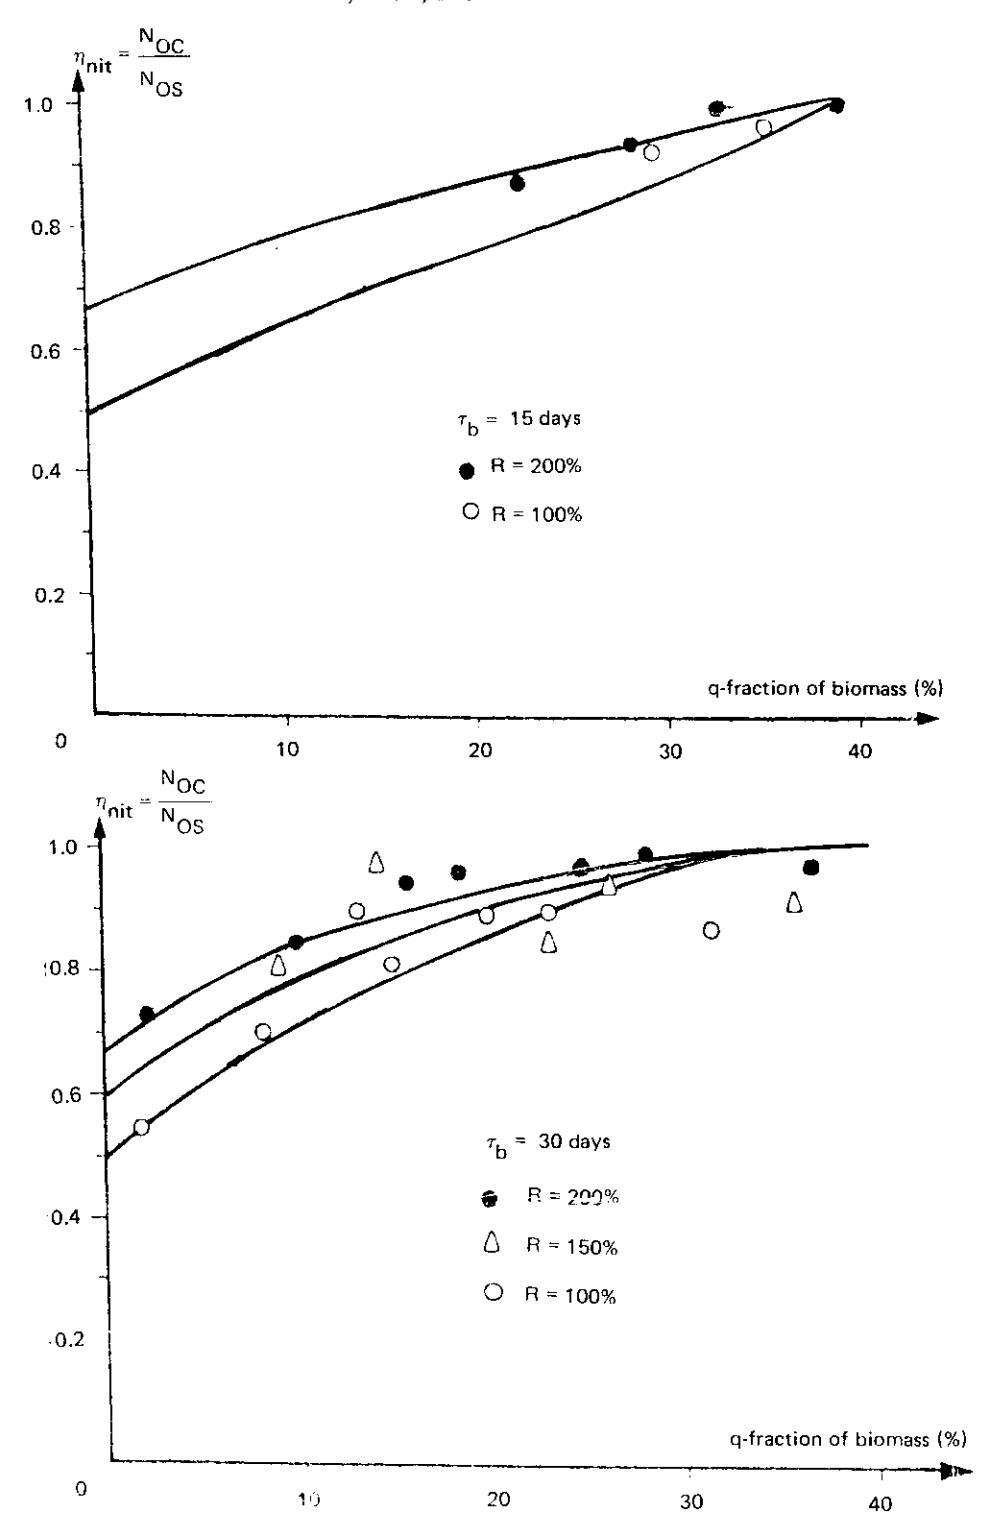
Figure 7. Evolution of nitrification efficiency calculated by equation (7) in function of \(\alpha\), for different studge and
CONCLUSION
At a constant temperature, the growth rate of nitrifiers in the contact reactor \((k_{NC})\) was influenced by the sludge age and fractional biomass in the contact reactor \(\alpha\). If \(\alpha\) is small, then \(k_{NC}\) achieve a maximum value of \(k_{ON}\). The minimum sludge age required in a contact-stabilization process to obtain a significant nitrification efficiency was 5 days. At a constant temperature, this efficiency is influenced by \(\tau_b\), R, \(t_{AC}\) and \(t_s\). For \(\tau_b = 10\) days, complet nitrification (100%) can be achieved by performing R = 200%, \(t_{AC}\) = 60 minutes and \(t_s = 90\) minutes.
REFFERENCES
- Adams, C.E., and Eckenfelder, W.W., 1977, Nitrification Design Approach for High Strength Ammonia Westewaters, J.W.P.C.P., 49, 413-421.
- Christensen, D.R., and McCarty, P.L., 1975, Multi-process Biological Treatment Model, J.W.P.C.F., 47, 262-263.
- Downing, A.L., Painter, H.A., and Knowles, G., 1964, Nitrification in the Activated Sludge Process, J.Inst. Sewage Purification, 130-157.
- Erickson, B., 1975, Nitrogen Removal in a Pilot Plant, J.W.P.C.F., 47, 727-740.
- Gujer, W., and Jenkins, D., 1975a, The Contact Stabilization Activated Sludge Process-Oxygen Utilisation, Sludge Production and Efficiency, Water Research, 9, 553-560.
- Gujer, W., and Jenkins, D., 1975b, A Nitrification Model for the Contact Stabilization Activated Studge Process, Water Research, 9, 561-566.
- Knowles, G., Downing, A.L., and Barrett, M.J., 1965., Determination of Kinetic Constans for Nitrifying Bacteria in Mixed Culture, with the aid of an Electric Computer, J. Gen. Microbiology, 30, 263-278.
- Prince Agbodjan, W., 1977, Contribution a l'étudé theorique et experimentale des phenoménes de nitrification dans les processus de traitement biologique des eaux usées, Doctor's thesis, University of Paul Sabatier Toulouse-France, no. 159.
- Saipanich, S., 1978, Contribution a l'étude theorique et experimentale de la phase hydrocarbonée et de la phase nitrification dans le procédé Contact Stabilisation. Doctor's thesis, INSA Toulouse-France, no. 15.
- Wild, H.E., Sawyer, C.N., and McMahon, T.C., 1970, Factors Affecting nitrification Kinetics, J.W.C.P.F., 43, 1895.
- Water Pollution Control Federation, ASCE, 1977, Wastewater Treatment Plant Design, Lancaster Press Inc.
- Zoltex, J., and Lefebvre, L., 1976, Nitrification in High Sludge Age Contact Stabization, J.W.P.C.F., 48, 2183-2189.
- Wisjnuprapto, 1981, Mise au Point d'un procédé biologique compact de depollution, Doctor's thesis, INSA Toulouse-Frace, no. 54.