

Introducti<ln
Cu-Zn-Al is one of the ntore extensjvcly studir.d copper-basc allol,s rvith such unusual properties as shape nreJrory ellcct, super or pscudoelasticity and high danrping capacity (1) . For inaterial to exhibit such pnrptrtie's, it should be in its final shape and structural conditjon, lrence either cornpletr.ly p or colnpletely n)arteusitio. Up to now, however, it was not possible to have thjs nlaterial in wire lbrnr which is the desired shapc lbr nrany applications; therelbre a special effort has been made to improve the cold drawability.
A study of the cold defbnnation of Cu-Zn-Al alloy was rnadc b1' ntcans of
'). thir tvork was cairied out at the Departrrncnl l{etadkundc. Katholjrkr Univ{rsilrit LLU!cr), I}clgium.
r'). Jurusan Mesin, lrakultas Teknologi Indus!ri, tn\titut Tcknologi Banrlung. Jl. (ian.ir 10 Banttung lndoneda, drawing extruded rods into fine wires. This was made possible by transforming single phase \(\beta\) structure into two-phase \(\alpha + \beta\) structure in which the harder \(\beta\)-phase is surrounded by a contiguous soft \(\alpha\)-phase.
The deformation behavior of two-phase \(\alpha + \beta\) structure was investigated by tests on undeformed and wire drawn specimens to determine the structural changes and mechanical property variation.
Stresses as well as strains are subject to repartitioning during the deformation of a two-phase structure (2,3). This allows to maintain compatibility during deformation. The stress repartitioning can be described in terms of load transfer from the soft phase to the harder phase (2,4). While the strain repartitioning reflects—the amount of strain taken by the softer phase during deformation. It can be demonstrated by developing a correlation between the degree of deformation and the mechanical property changes (5,6).
In the present work an effort was made to assess the strains suffered by each of the constituents after the material being cold drawn with different strains. Under favorable circumstances, this could be done by geometrical measurements on the microstructure and by microhardness measurements which reflect the local flow stress and thus the strain to which a region of a given constituent has been subjected. The results of our investigations show that differences in deformation between the two phases are dependent on various factors such as the hardness difference between the two phases, the drawing strain and the shape indices of the constituents.
A model is proposed that quantitatively describes the influence of the different parameters mentioned on the flow stress of the two-phase structure.
EXPERIMENTAL PROCEDURES
A Cu-Zn-Al alloy with chemical composition given in Table 1 was used in this study. An appropriate annealing treatment has been developed \(^{(7)}\) to produce better deformable \(\alpha + \beta\) structure, able to undergo large deformations during wire drawing. This appropriate annealing treatment includes five different intermediate anneals, i.e. 1st annealing treatment includes five different intermediate anneals, i.e. 1st annealing treatment includes five different intermediate anneals, i.e. 1st annealing treatment includes five different intermediate leaving the die. The extruded rod was then reheated to a temperature of 400°C for 15 min., and was then quenched in water. The quenched specimen was up-quenched to 550°C for 2 hours, cooled slowly in the furnace to a temperature of 450°C, and finally air cooled. The subsequent intermediate annealing treatments (2nd to 5th); were treatments of 2 hours at 500°C, followed by furnace cooling until the temperature in the furnace had reached 450°C. Afterwards, the wires were quickly cooled in the air. Examples of the microstructures which were taken from longitudinal sections after different annealing stages are shown in Fig. 1.
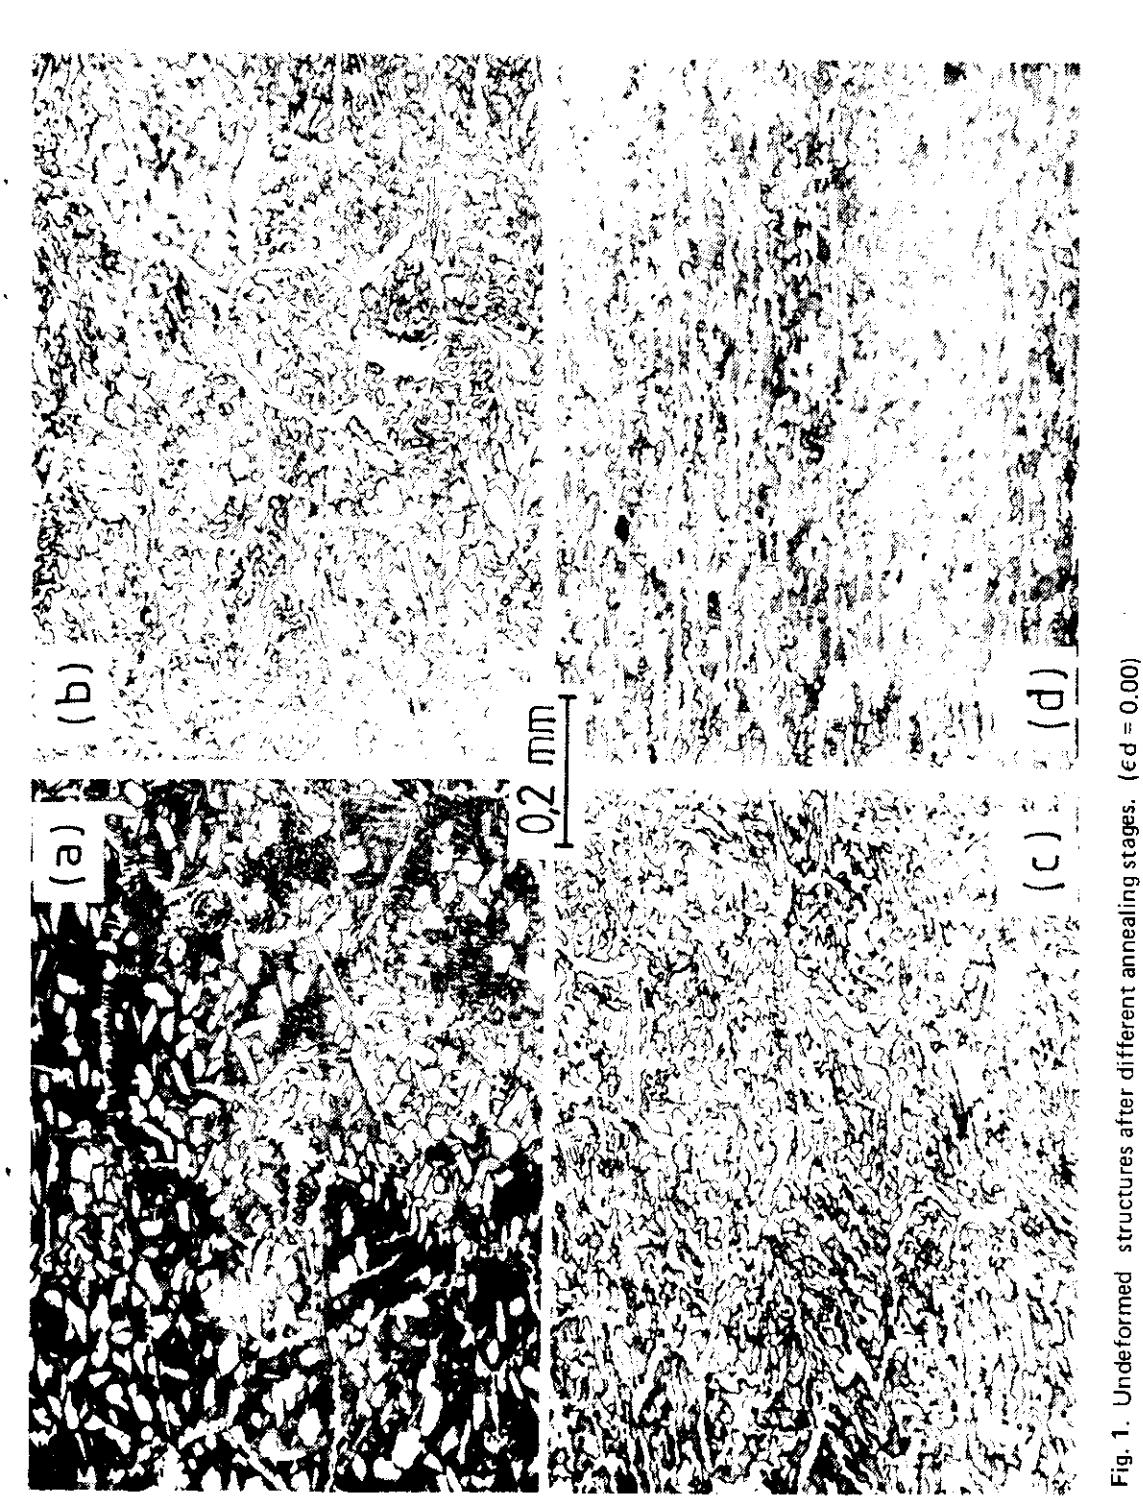
(a) 1st annealing treatment; (b) 2nd annealing treatment; (c) 3rd annealing treatment; (d) 5th annealing treatment.
| Table | 1 | : Chemical | composition of the specimens |
|---|---|---|---|
| Cu (wt. – %) | Zn (wt %) | Al (wt. – %) |
|---|---|---|
| 69.49 | 26.42 | 4.09 |
To characterize the grain deformation, quantitative metallographic examinations were performed on undeformed and drawn specimens. This done in order to determine the extent of relative deformation between the phases, i.e. by measuring the average values of mean phase intercept and/or mean free path of the phases in the longitudinal and transverse directions within the sample.
Microhardness measurements were made on the individual phases \(\alpha\) and \(\beta\) with a load of 10 gf using a Zwick apparatus with Knoop indentor.
RESULTS AND DISCUSSION
Mean free path and mean phase intercept.
A series of specimens was successively cold drawn to more than 50% reduction. Photomicrographs taken from transverse and longitudinal sections were analyzed for the changes in the grain shape. As the drawing reduction increases, the grains of the \(\alpha\)-phase becomes quite elongated in the drawing direction. On the other hand, the width of the \(\alpha\)-phase is reduced as drawing reduction increases. At the same time the width of \(\beta\)-phase is also reduced. The changes in grain dimensions during wire drawing have been evaluated in \(\alpha\) and \(\beta\)-phases using the formula (8).
\[\lambda_g^{\alpha} = \frac{4V^{\alpha}}{S_V^{\alpha\beta} + 2S_V^{\alpha\alpha}}\] 1)
\[\lambda_{g}^{\alpha} = \frac{4V^{\alpha}}{S_{v}^{\alpha\beta} + 2S_{v}^{\alpha\alpha}}\] and \[\lambda^{\beta} = \frac{4V^{\beta}}{S_{v}^{\alpha\beta}}\] 2)
where:
= The mean phase intercept of the \(\alpha\)-particles (or the \(\alpha\) grain size).
λß = the mean free path of the \(\beta\)-phase.
\(V^{\alpha}\) and \(V^{\beta}\): the volume fractions of the \(\alpha\) and \(\beta\) constituents, respectively.
S<sub>v</sub>: the surface area per unit volume of boundary shared by a phase.
The evaluation of the changes of the mean phase intercept of \(\alpha\)-phase in transverse and longitudinal wire directions as a function of the true strain due to drawing is seen in Fig. 2. Subsequent to the first annealing cycle, wire drawing only produced slight deformation in the \(\alpha\)-phase and this is illustrated in the curves of Fig.2 in which the \(\alpha\)-phase changes slightly in either direction. (This first annealing treatment only allowed a reduction of 22.35%, after which the material failed.).
The results of the \(\alpha\) grain measurements in the longitudinal direction, Fig. 2, may be useful to describe the relationship between the macroscopic and microscopic deformation. This is depicted in Fig. 3 with the drawing strain of test pieces as the abscissa and the true strain of the \(\alpha\) particles as the ordinate. The true strains of the \(\alpha\) particles were calculated using the relation.
\[\epsilon_{\rm d}^{\alpha} = \ln \left[ \frac{2(\epsilon_{\rm d})}{\lambda_{\rm o}} \right]^{\alpha} \|\] 3)
where \(\lambda_0^\alpha\|\) and \(\lambda\left(\varepsilon_d\right)^\alpha\|\) are the initial and final mean phase intercepts of the \(\alpha\)-phase in the longitudinal direction of the wire,
A line drawn at \(45^{\circ}\) divides the diagram into two parts; the line describing the deformation of the \(\alpha\)-particles lies above that line, whereas curves below it would describe the behavior of a phase harder than the matrix.
The \(45^{\circ}\) line itself represents the homogeneous deformation case. It is clearly seen in Fig. 3 that strains in the \(\alpha\)-phase are always higher than those in the test specimen. It also shows that all curves have a tendency to approach the homogeneous line with increasing strain. This indicates that the deformation gradients in the two phases are dependent on the strain, \(\epsilon_{\rm d}\).
b. Inhomogeneity of the plastic deformation of \(\alpha\) and \(\beta\)-phases
The nominal strain in the \(\alpha\)-phase is given by
\[\epsilon^{\alpha} = \exp((\epsilon_{\mathbf{d}}^{\alpha}) - 1\]
The strain in the \(\beta\)-phase is then calculated using the rule of mixtures,
\[\bar{\epsilon} = (1 - V^{\beta}). \ \epsilon^{\alpha} + V^{\beta}. \ \epsilon^{\beta}\] 5)
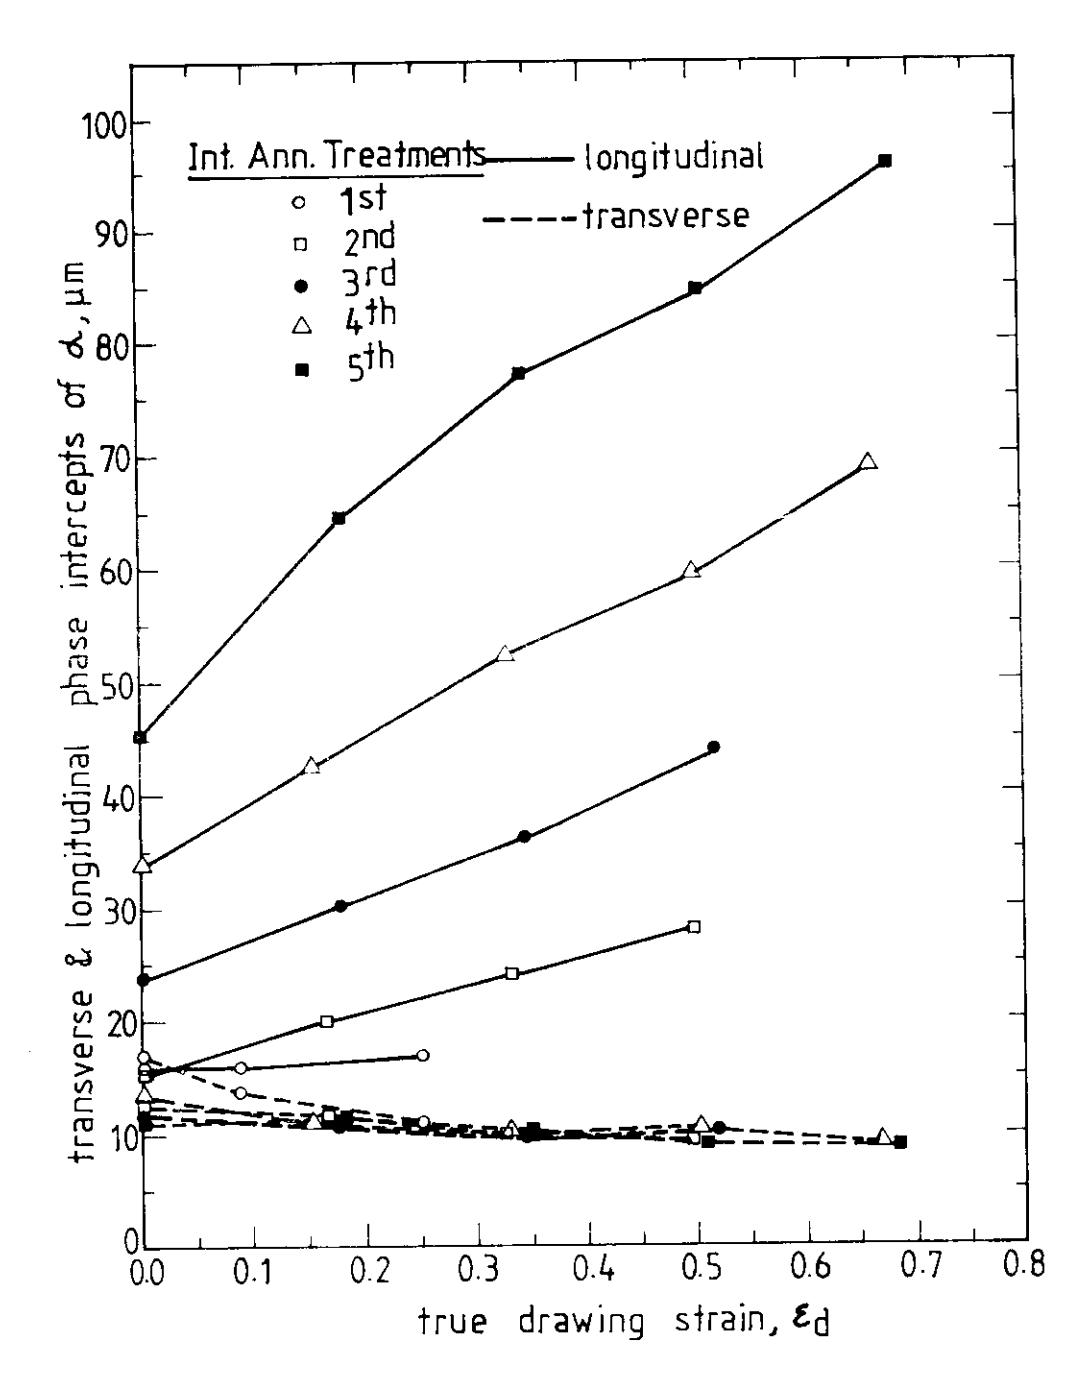
Fig. 2 Transverse and longitudinal phase intercepts of alpha particles as a function of log, drawing strain.
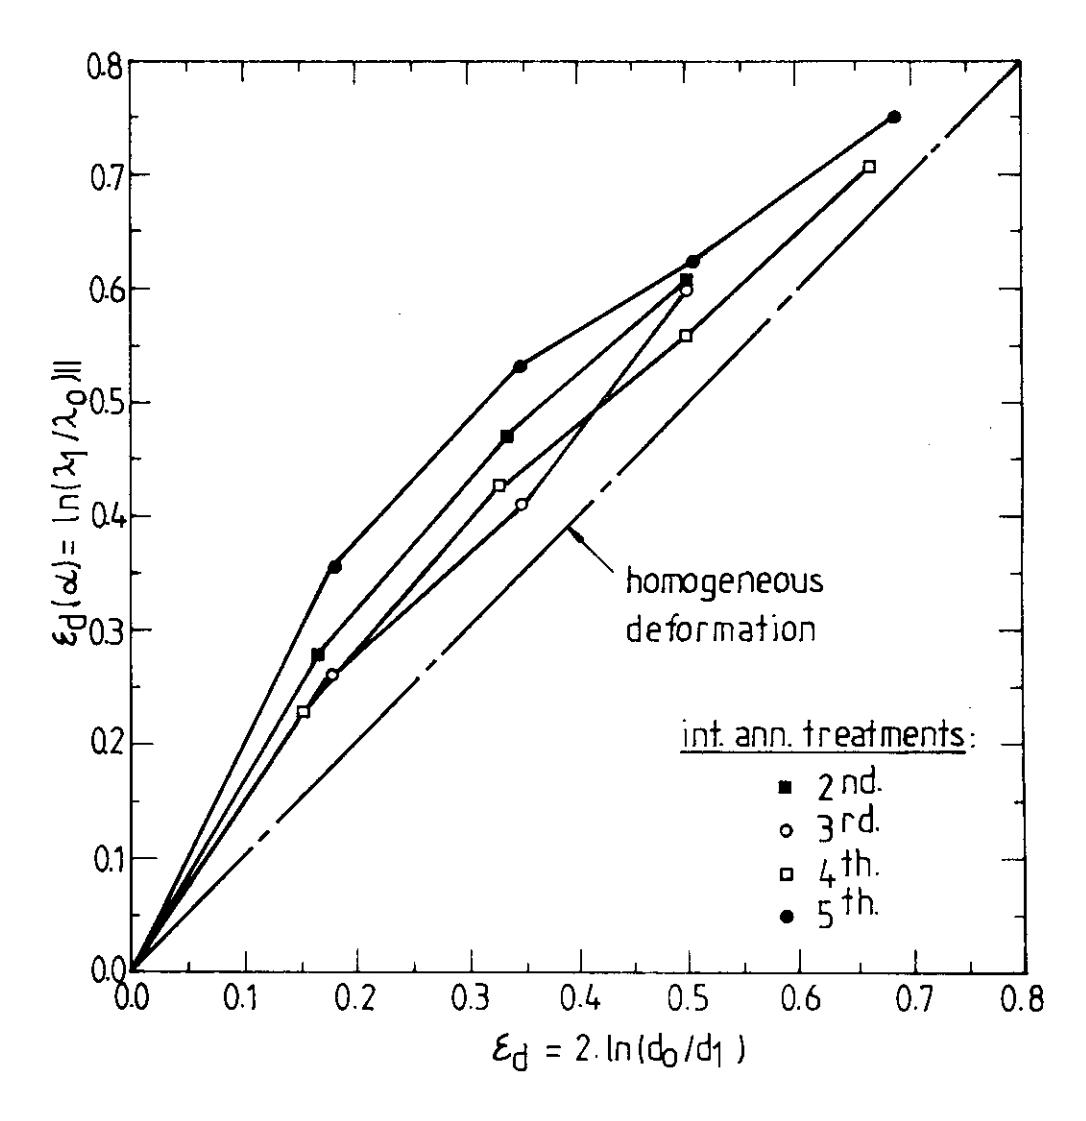
Fig. 3. True drawing strain of individual alpha—phase function of log. drawing strain of drawn wire.
where \(\bar{\epsilon}\), \(\epsilon^{\alpha}\) and \(\epsilon^{\beta}\) are the nominal strains in the \(\alpha + \beta\) aggregate, in \(\alpha\) and in \(\beta\), respectively.
From equation (5), the nominal strain in the \(\beta\)-phase is given by
\[\epsilon^{\beta} = \frac{\left[\exp\left(\epsilon_{d}\right) - 1\right] - \left(1 - V^{\beta}\right)\left[\exp\left(\epsilon_{d}^{\alpha}\right) - 1\right]}{V^{\beta}}\] 6)
where \(V^{\beta} \neq 0\)
The true drawing strain in the \(\beta\)-phase is thus given by
\[\epsilon_{\mathbf{d}}^{\beta} = \ln (1 + \epsilon^{\beta})\] 7)
The calculated true drawing strain in the \(\alpha\)-phase as a function of that in the \(\beta\)-phase is shown in Fig. 4. It shows that the inhomogeneity in deformation between the two phases is pronounced at small strains while it becomes less significant at higher strain levels. At higher drawing strains, the deformations in both phases are more or less equal. This is also represented in Fig. 5 in which the microhardness ratio of both phases approaches unity after large deformations.
The deformation of \(\alpha+\beta\) Cu-Zn-Al structure is characterized by a high degree of deformation of soft \(\alpha\)-phase \(^{(7)}\). This means that the soft \(\alpha\)-phase strainhardens relatively more than the harder \(\beta\)-phase, so that the difference in flow stress becomes less in the course of the deformation. This is also represented in Fig. 5 in which the microhardness ratio of both phases H * decreases as drawing strain increases. The softer \(\alpha\)-phase deforms more in the two-phase alloy with large H * value. Namely, \(\epsilon_{\rm d}{}^{\beta}\) is nearly equal to \(\epsilon_{\rm d}{}^{\alpha}\) when H * is small. But, \(\epsilon_{\rm d}{}^{\alpha}\) becomes larger compared with \(\epsilon_{\rm d}{}^{\beta}\) when H * becomes large. The dependence of the strain-in-equality, m, (i.e. m = \(\epsilon_{\rm d}{}^{\beta}\) /\(\epsilon_{\rm d}{}^{\beta}\)) on the H
value is given in Fig. 6. It shows that m decreases as H * increases. The m-value approaches unity when H * becomes lower than 1.20. The same effect was also observed in pearlite-ferrite material (steel) in which the strain field is very inhomogeneous and the inhomogeneity increases substantially with increasing yield stress ratio (9).
c. Effect of drawing strain on the mean shape factors of the \(\alpha\) particles
The strain inequality in both constituents is also supposed to be dependent on the shape change of the microstructure during deformation. The simple shape change index \(Q^{\alpha} = (\lambda \parallel / \lambda \perp)^{\alpha}\) has been evaluated and plotted versus the drawing strain, Fig. 7. The results of measurements shown in Fig. 7 approach the calculated values with increasing drawing strains.
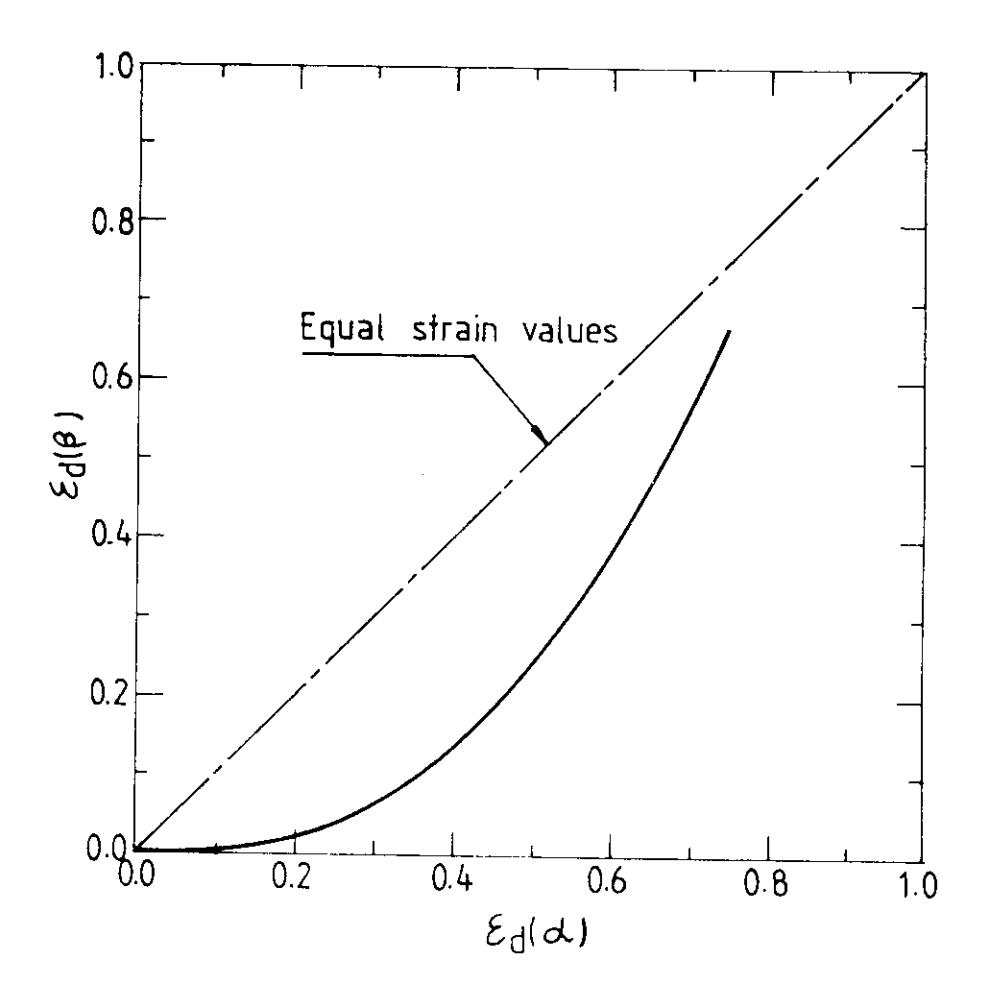
Fig. 4 Calculated cumulative true drawing strain in the soft alpha phase vs that in the harder beta-phase.
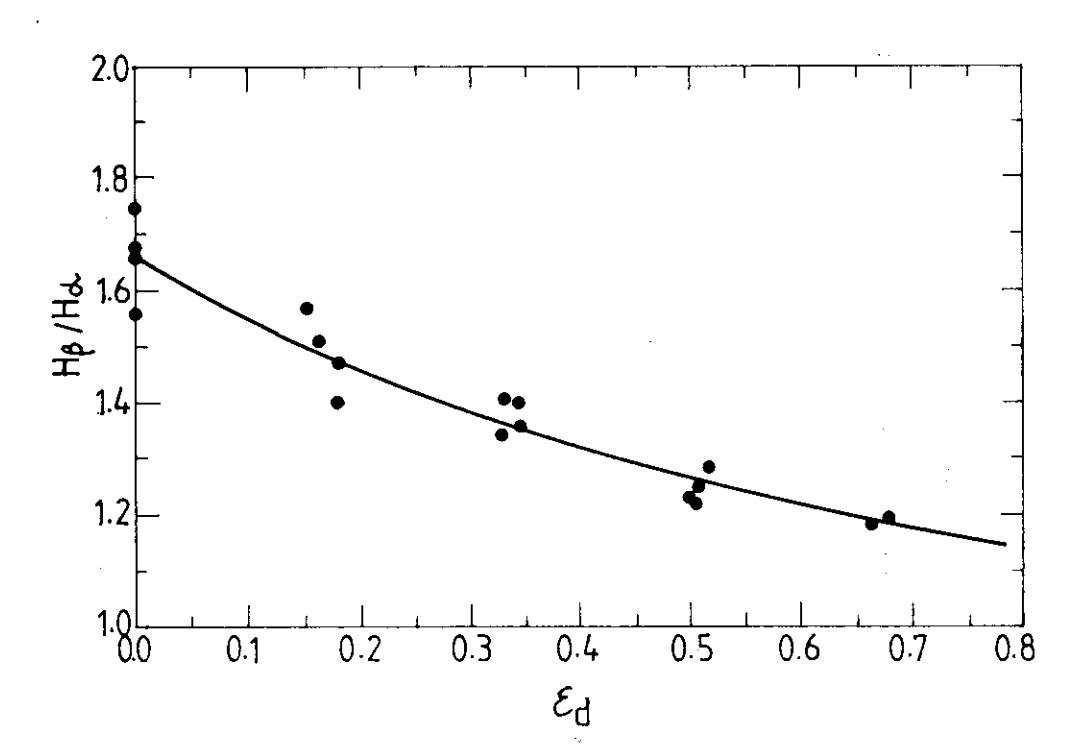
Fig.5. Hardness ratio of the two phases vs. log. drawing strain.
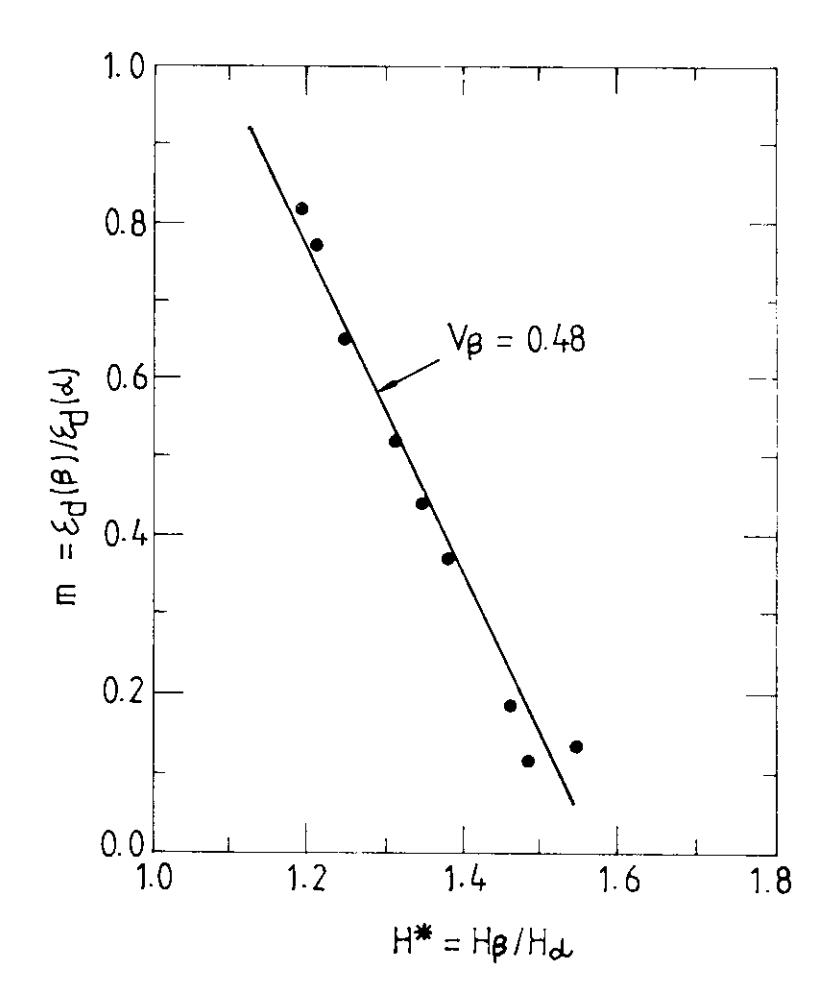
Fig. 6. m-values vs hardness ratio of the two phases.
The calculated values of Q describe the homogeneous deformation during wire drawing which is given by
\[Q = \frac{\lambda \parallel (\epsilon_d)}{\lambda \perp (\epsilon_d)} = (\frac{\lambda \parallel}{\lambda \perp})_0 \exp(\frac{3.\epsilon_d}{2})\] where \(\lambda \parallel (\epsilon_d)\) and \(\lambda \perp (\epsilon_d)\) are the mean effective grain size of the two-phase structure in longitudinal and transverse directions, respectively. When Q in equation (8) is plotted against the drawing strain starting from the initial ratio of \((\frac{\lambda \parallel}{\lambda \perp})_0\) for the $\alpha$-phase only, it is seen in Fig. 7 that the measured values of \(Q^{\alpha}\) are different from the calculated Q-values. The difference reflects the deformation gradient between the phases developed during deformation. But it is also evident from Fig. 7 that the difference becomes smaller with increasing drawing strain. Figure 7 also shows increasing values of \(Q_0^{\alpha}\) after successive annealing treatments.
When equation (8) is given in the form
\[Q/Q_0 = \exp\left(\frac{3.\epsilon_0}{2}\right)\]
there should be one curve only that correlates the ratio \(Q/Q_0\) and the drawing strain \(\epsilon_d\), as seen in Fig. 8. This parameter \(Q/Q_0\) is not more dependent on the initial grain structure due to different annealing treatments. Again, the measured values tend to approach the homogeneous deformation situation exp. \((3.\epsilon_d/2)\) at larger drawing strains.
So far, the value of strain-inequality m is shown to be a function of total drawing strain \(\epsilon_d\), the hardness ratio H and the shape index of the constituents. In alloy with differing harder second phase contents, it was found that the strain difference in a two-phase alloy with a small volume fraction of harder phase is larger than that in an alloy with higher volume fraction of that phase (10).
CONCLUSIONS
The differences in deformation between the two phases of a Cu-Zn-Al alloy during wire drawing are dependent on various factors such as the hardness difference between the two phases, the drawing strain and the shape indices of the constituents.
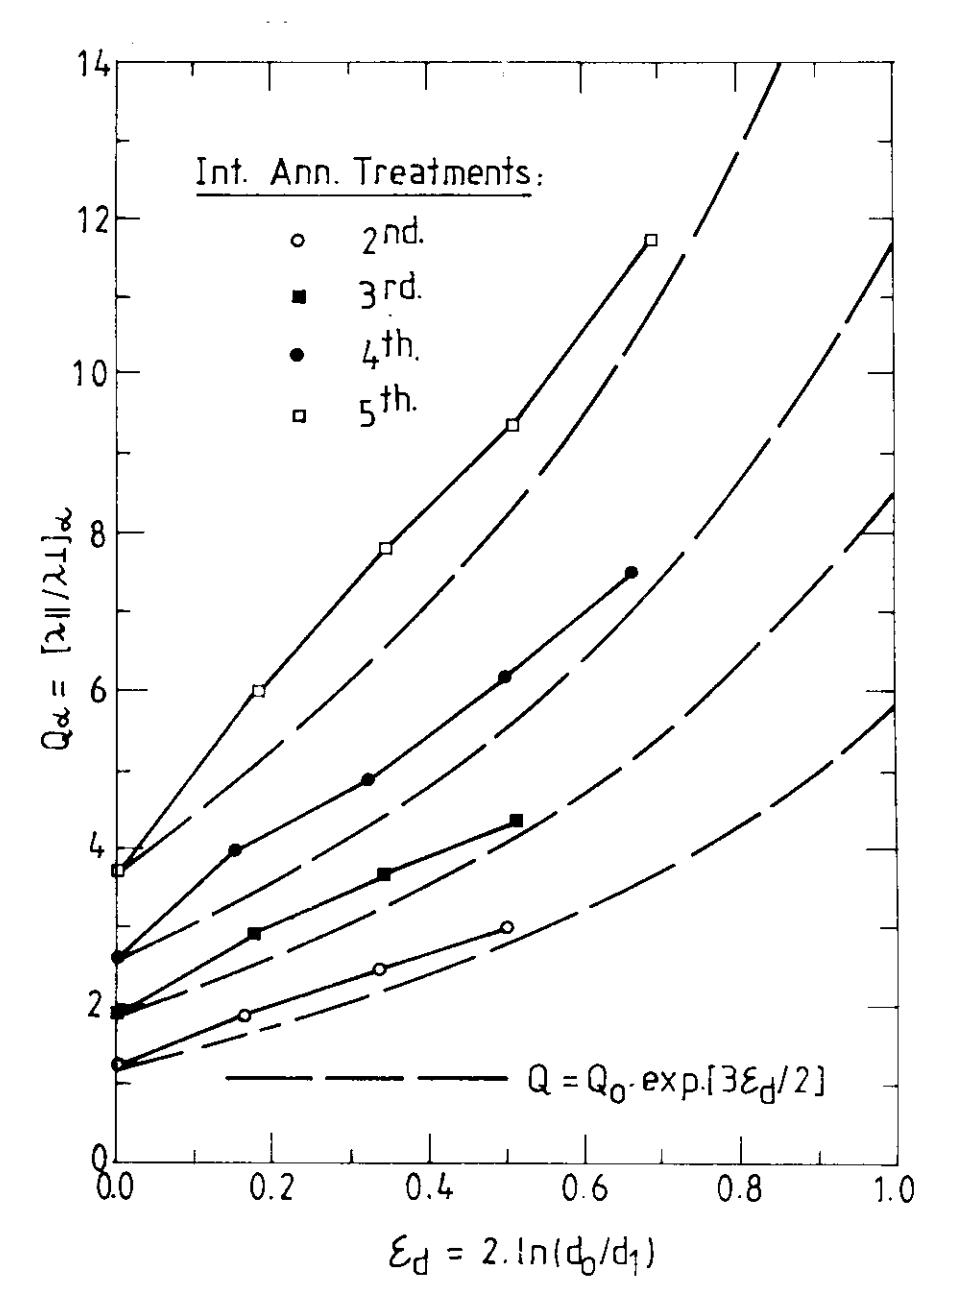
Fig. 7. Mariation of shape index Q as a function of true strain due to drawing.
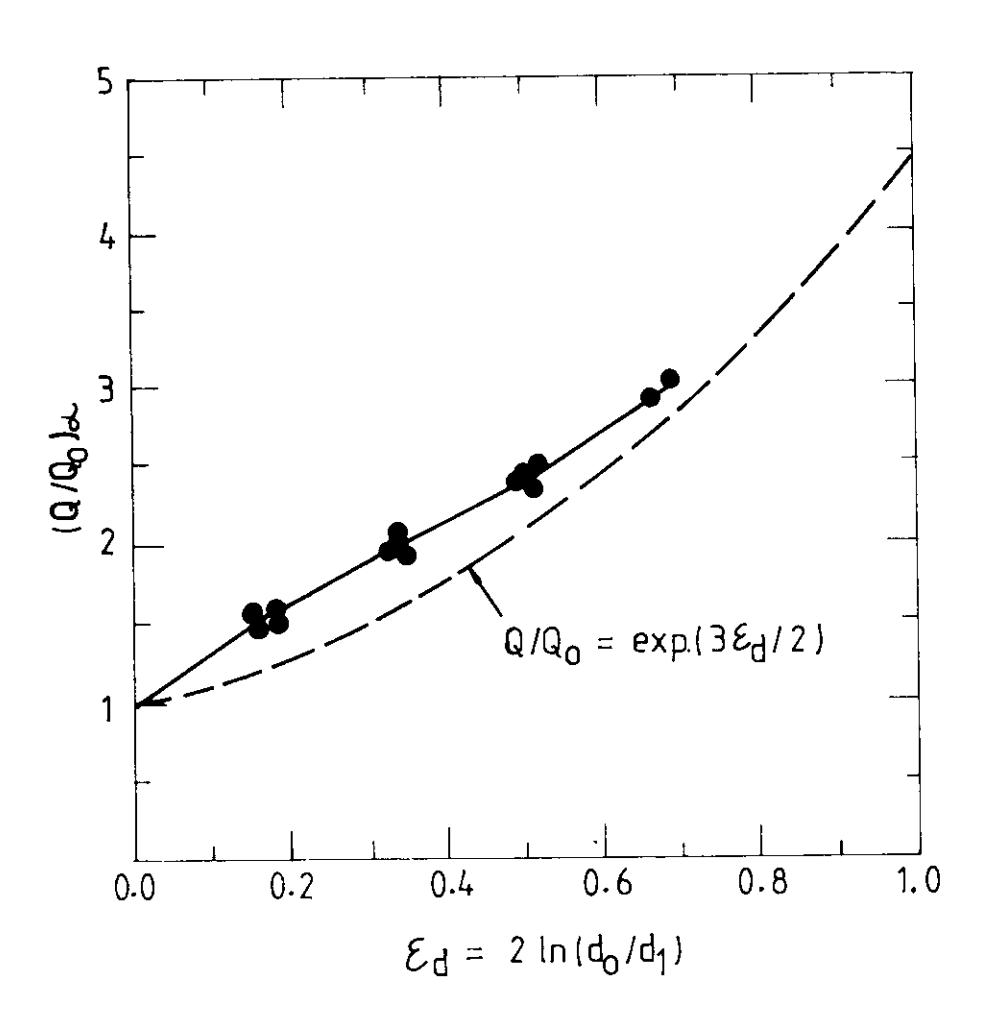
Fig. 8. Shape index ratio of alpha—phase vs true drawing strain. (The dashed line curve is the relation \(Q/Q_0=\exp\). (3\(\epsilon\)d/2). The experimental results are plotted as points.
ACKNOWLEDGEMENTS
The author wishes to thank Prof. Dr. E. Aernoudt for valuable discussions in this work. He is also grateful to the Ministerie van Buitenlandse Zaken, Buitenlandse Handel en Ontwikkelingssamenwerking of the Belgian Government for the award of a scholarship.