

1 Introduction
The Indonesian archipelago, which is situated approximately between 7°N and 10°S, can be considered "free from tropical storm track". However, the effect of the tropical storms can influence the weather condition in some parts of the Indonesian region.
A tropical depression is the initial disturbance in the tropical region before it develops into a tropical cyclone. In the tropical depession, wind velocity generally is about \(10 \text{ ms}^{-1}\). When the wind velocity reaches to about \(15 \text{ ms}^{-1}\), the depression becames a tropical storm, and then it develops into a tropical cyclone when its velocity increases up to \(30 \text{ ms}^{-1}\) or more.
Palmen (1948) stated that a tropical storm emerges in the region in which the sea temperature is greater than 26°C. Thus, the high ocean thermal energy and the humid air in the lower layer are among the several conditions for the formation of a tropical storm.
2 Equation governing the cyclonic air flow
In the case of a cyclone, the combination of coriolis and centrifugal forces is balanced by pressure gradient force and the wind blows counter clockwise in the northern hemisphere. Figure I shows the balance of forces acting on air parcel of one unit mass in the cyclonic air flow.
Figure 1 The balance of force in the cyclonic air flow.
Cyclonic air flow, could be expressed as follow:
\[fV + \frac{V^2}{r} = -\frac{1}{\rho} \frac{\partial p}{\partial r}\] or \[fV + \frac{V^2}{r} + \frac{1}{\rho} \frac{\partial p}{\partial r} = 0 \qquad (1)\] where:
f: parameter of coriolis
V: wind velocity
r: radius of the air parcel path
p: air densityp: air pressureL: low pressure
Solution of the equation (1) in V is:
\[V_{gr} = -\frac{fr}{2} \pm \sqrt{\frac{f^2 r^2}{4} - \frac{r}{\rho} \frac{\partial p}{\partial r}}\] (2)
where Vs is tlie velocity of gradient wind.
By substituting numerical value of positive pressure gradient and the boundary condition, the gradient wind velocity should be equal to zero, if the pressure gradient is equal zero. Thus the required solution for cyclonic air flows is:
\[V_{gr} = -\frac{fr}{2} + \sqrt{\frac{f^2 r^2}{4} + \frac{r}{\rho} \frac{\partial p}{\partial r}}\] (3)
in the root sign is always boundary for the gadicnt It is shown from the equation (3) that the tcrnr positive, which means that thcoretically there is no wind velocity.
The pressure gradicnt forcc is not influenced by the friction force because it is independent on the air flow. On the contrary thc coriolis force is influenced by the friction force and it becomes small due to the decrease of wind velocity. That is why in the cyclonic air flow, the friction lbrce causes the air flow crosses the isobars toward the low pressure, so that the wind system becomes convergent. Its circulation is countcr clockwise in the northern hcmisphere or clockwise in the southren henrisphere (see figure 2).
Figure 2 Cyclonjc air flow in the northern hemisphere emphasizing the friction effect.
3 Data analysis
Data of the sea surface temperature was obtained from thc Monthly Report of Meteorological Satellite Center published by the Meteorological Satellite Center, Tokyo, Japan, for the period ol January 1982. The report contains the results of GMS observations and consists of sea surface tempetature, etc. From the sea surface temperature data, the isolines ofsea surface temperature called "the sea surface isotherm" could be drawn, then from the isotherm pattern the position of the thermal ridge i. e. the line connecting hot cells on
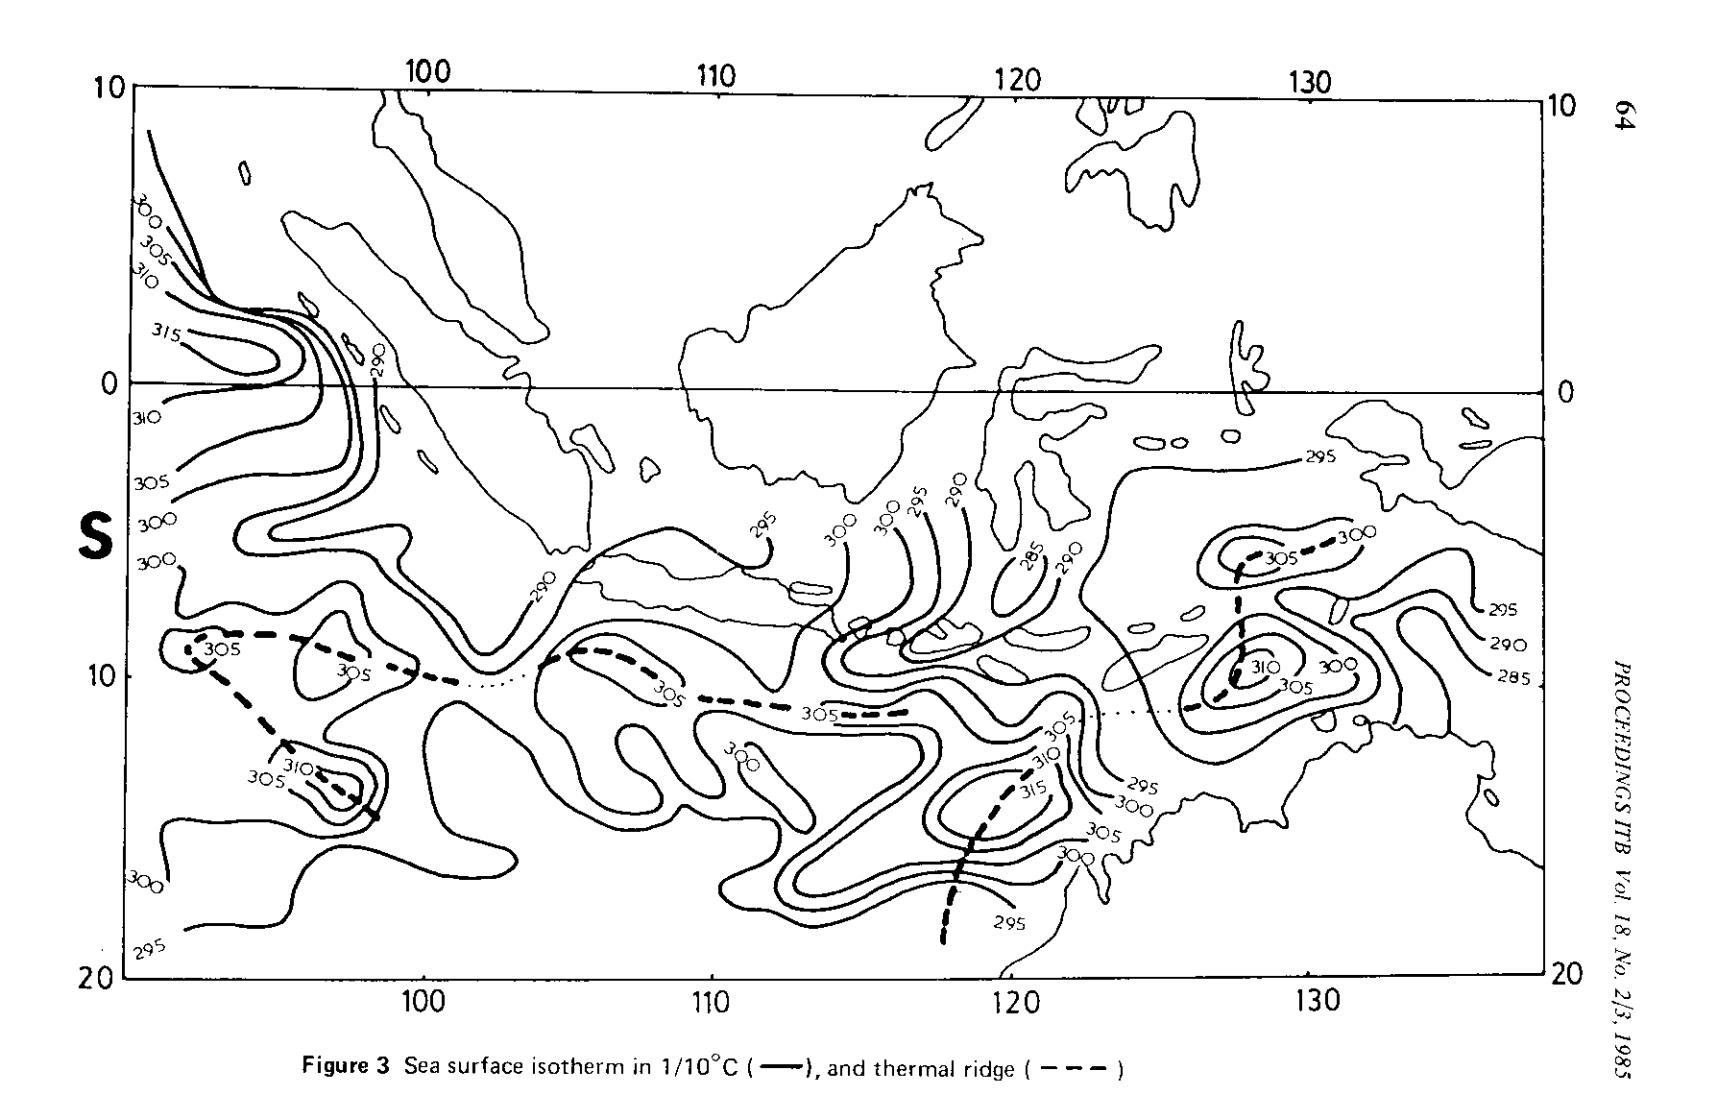
the sea surface was determined. In northern Australia, it was found that the sea surface temperature was hot enough, about 30.0 to 31.5°C, then hot cells developed to the western direction and reached to 95°E. The hot cells were situated in the position between 8° and 13°S. (Fig. 3).
Synoptic data and synoptic map were abtained from observations in the month of January 1982 executed by the Meteorological and Geophysics Agency, Jakarta. Isobaric pattern was taken for every six hours and based on this pattern the surface stream lines was drawn as shown in figure 4.
3.1 Sequence of the tropical storms
Sequence of the tropical storm was started by the emergence of tropical storm called ERROL on January 13, 1982 at 12.5°S and 112.2°E. On the 18<sup>th</sup> of January 1982 at 0.00 GMT, the storm increased its intensity and became tropical cyclone ERROL in the position of 12.5°S and 99.8°E, and at 12.00 GMT the cyclone weakened. On January the 19<sup>th</sup> at 0.00 GMT, the cyclone decreased in intensity and became tropical storm ERROL again in the position of latitude 12.8°C and longitude 105.3°E. Ultimately on the 20<sup>th</sup> of January at 0.00 GMT the intensity of the storm decreased more and more and was located at 14.5°S and 106.5°E, then dissipated southward.
In northern Australia, tropical depression emerged on the 15<sup>th</sup> of January 1982 in the position of latitude 14°S and longitude 140°E. Then on the 18<sup>th</sup> of January at 0.00 GMT the depression increased in intensity and it became tropical storm BRUNO in the position of latitude 15°S and on the 19<sup>th</sup> of January at 0.00 GMT the storm increased to toprical cyclone BRUNO in the position of latitude 19.5°S and longitude 117.9°E. On the 20<sup>th</sup> of January at 6.00 GMT the cyclone weakened again and it became tropical storm BRUNO in the position of latitude 25°S and longitude 111°E on which disipated southward (Fig. 5).
3.2 Tropical storm effects with respect to rainfall, wind, and wave
Based on the report on Climate, Weather, and Earthquake, No. 3, published by the Meteorological and Geophysics Agency, Jakarta, some informations regarding the weather conditions in the second decade of January 1982, a period from 11<sup>th</sup> to 20<sup>th</sup> concerning to the emergence of tropical storms ERROL and BRUNO in the southern hemisphere waters was obtained.
Some of the rainfall stations were affected indirectly by the water conditions of the Indonesian ocean in which tropical storms emerge in the second decade of January 1982 (Table 1). Table 1 shows, that in the second decade of January 1982, the considered rainfall stations accept rainfall about 123% to 355% of the one third of the monthly normal rainfall.
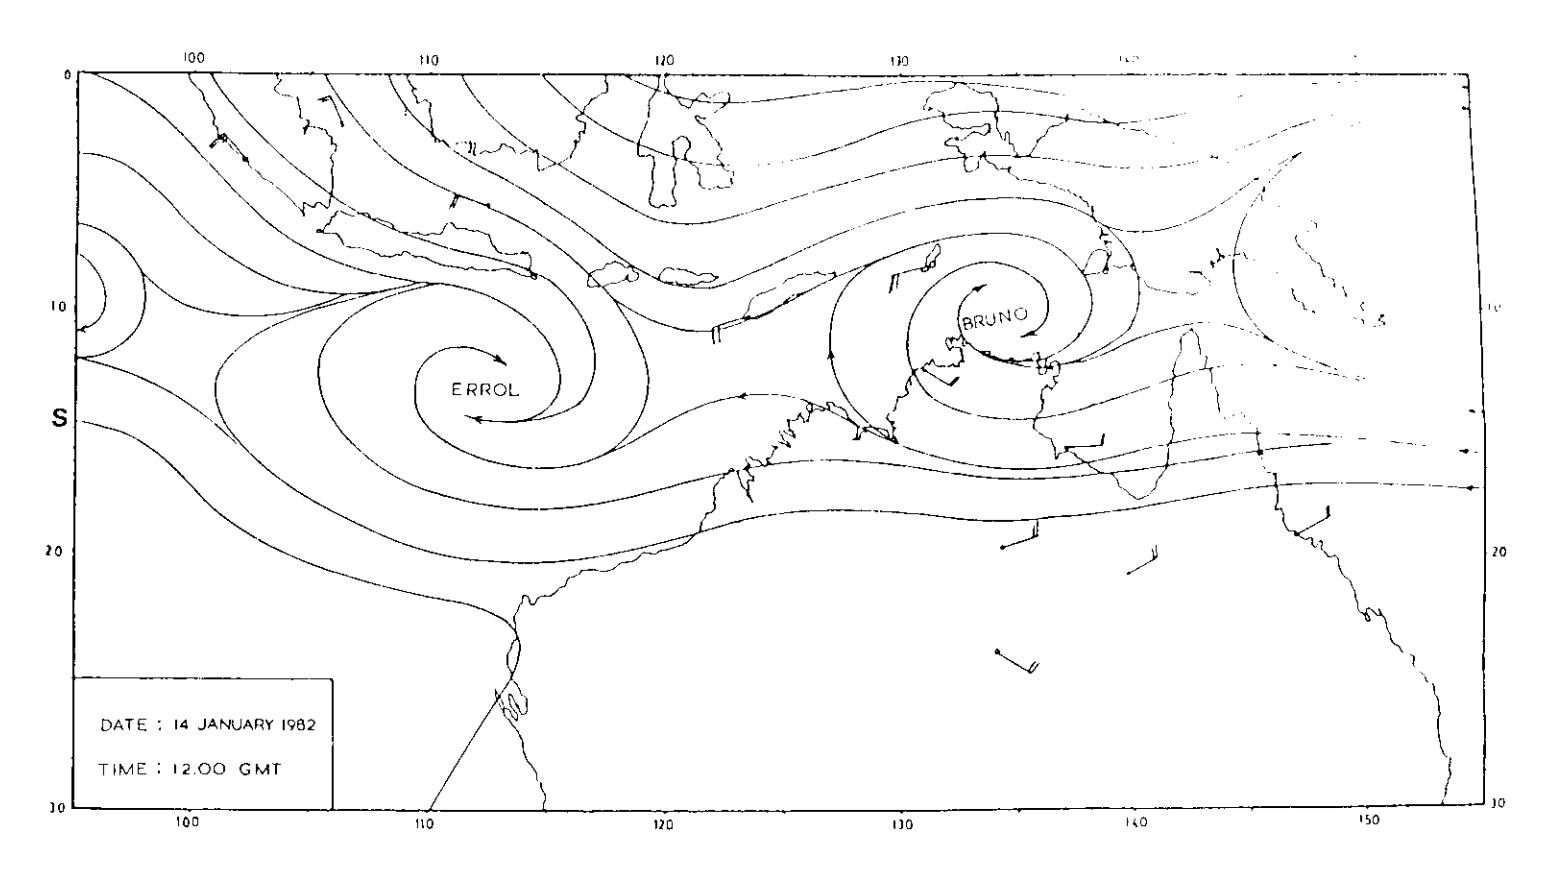
Figure 4a Surface stream lines at 12.00 GMT, January 14, 1982.
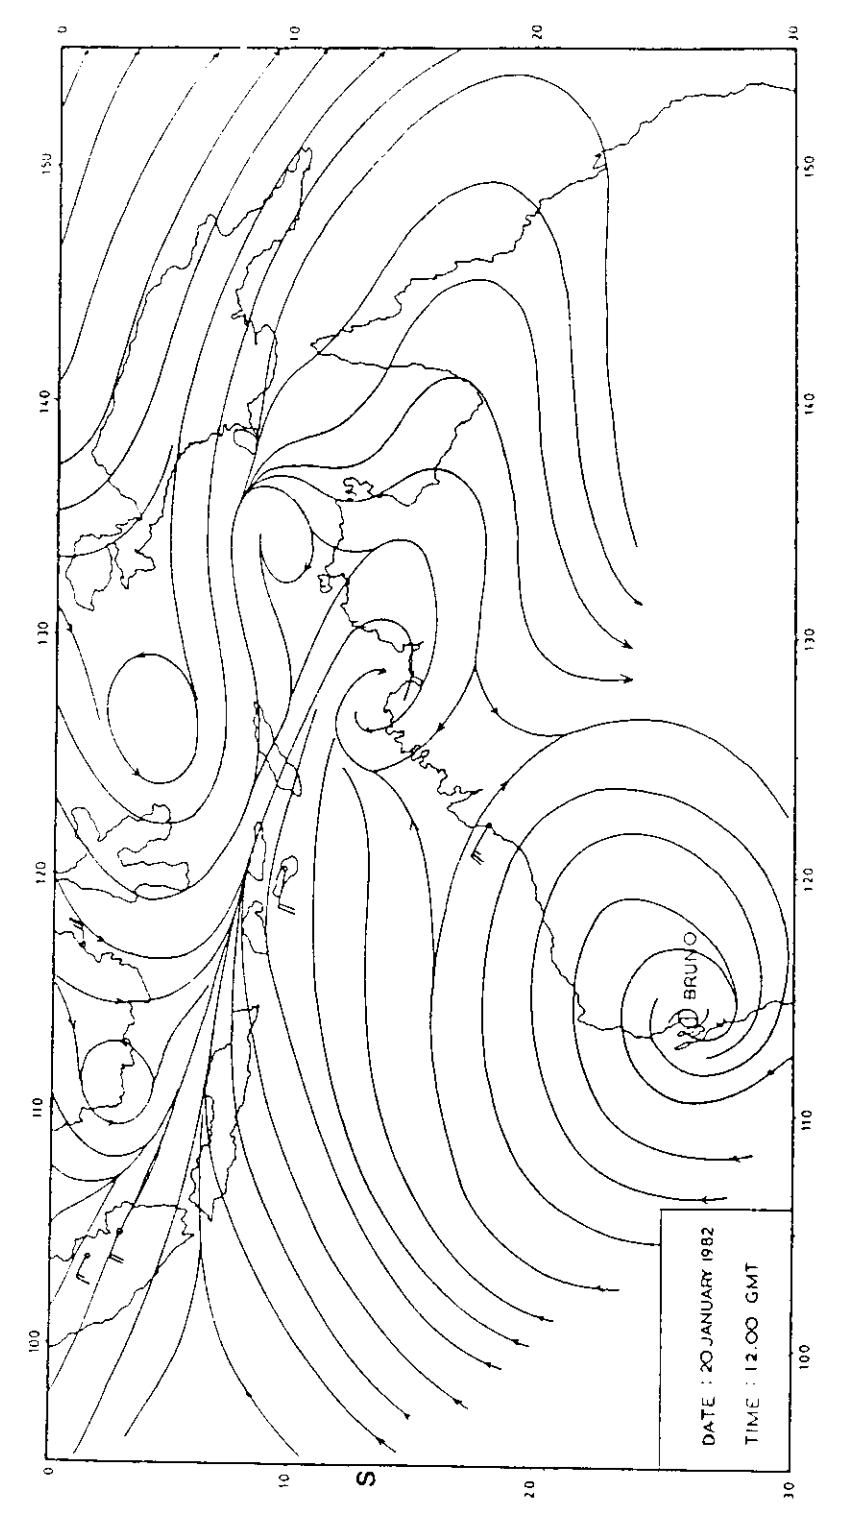
Figure 4b Surface stream lines at 12.00 GMT, January 20, 1982.
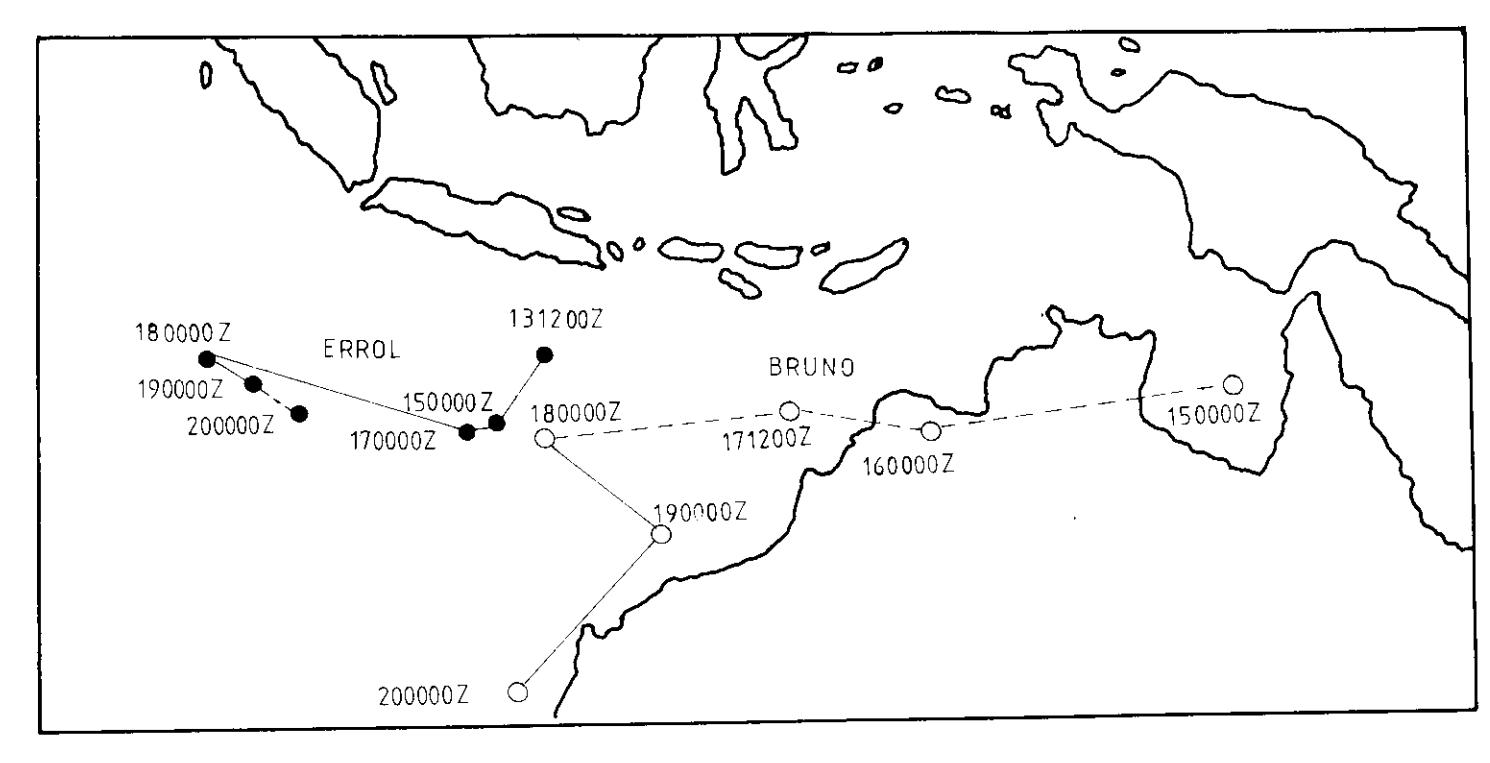
Figure 5 Track of the tropical disturbance in January 1982.
: track of the tropical storm/cyclone
131200Z: track of the tropical depression 131200Z: January 13, 1982, at 12.00 GMT. 150000Z: January 15, 1982, at 00.00 GMT.
Table 1 Rainfall (mm) for some of the rainfall stations (Fig. 6) in the second decade of January 1982.
| No. | Name of Station | Rainfall in se- cond decade | Monthly normal rainfall | Percentage against the one third of normal rainfall |
|---|---|---|---|---|
| 1 | Padang | 199 | 355 | 168% |
| 2 | Bengkulu | 125 | 306 | 123% |
| 3 | Tg. Karang | 138 | 268 | 155% |
| 4 | Banyuwangi | 128 | 179 | 215% |
| 5 | Sumbawa Besar | 303 | 320 | 284% |
| 6 | Ternate | 215 | 208 | 310% |
| 7 | Amahi | 123 | 104 | 355% |
| 8 | Manokwari | 290 | 311 | 280% |
| 9 | Sarmi | 183 | 227 | 242% |
| 10 | Jayapura | 179 | 339 | 174% |
Wind at the south of the equator was generally westerlies (South West – North West) with velocity of about 20 knots. The synoptic map shows that some of the meteorological stations in the southern hemisphhere had recorded wind velocities exceeding 20 knots.
During the second decade of January 1982, waves in the south of the equator occured from the direction of South West—North West with wave height about 2.0 m to 5.0 m. This wave height was heigher than the one at the north of the equator which reached only about 1.2 m to 2.1 m (Table 2).
Table 2 Ocean condition in Indonesian waters, January 1982*
| Date | Time (GMT) | Position | Wind velocity (knots) and direc- tion (degrees) | Wave height (m) and direction (degrees) |
|---|---|---|---|---|
| 12 | 00.00 | 11.42 S – 96 E | 37/120° | 5.0/120° |
| 17 | 00.00 | 09.42 S – 106 E | 24/320° | 4.0/320° |
| 19 | 00.00 | 0 7.24 S – 105 E | 16/250° | 2.0/310° |
Source: Report of Climate, Weather, and Earthquake, No. 3, Meteorological and Geophysics Agency, Jakarta, January 1982.
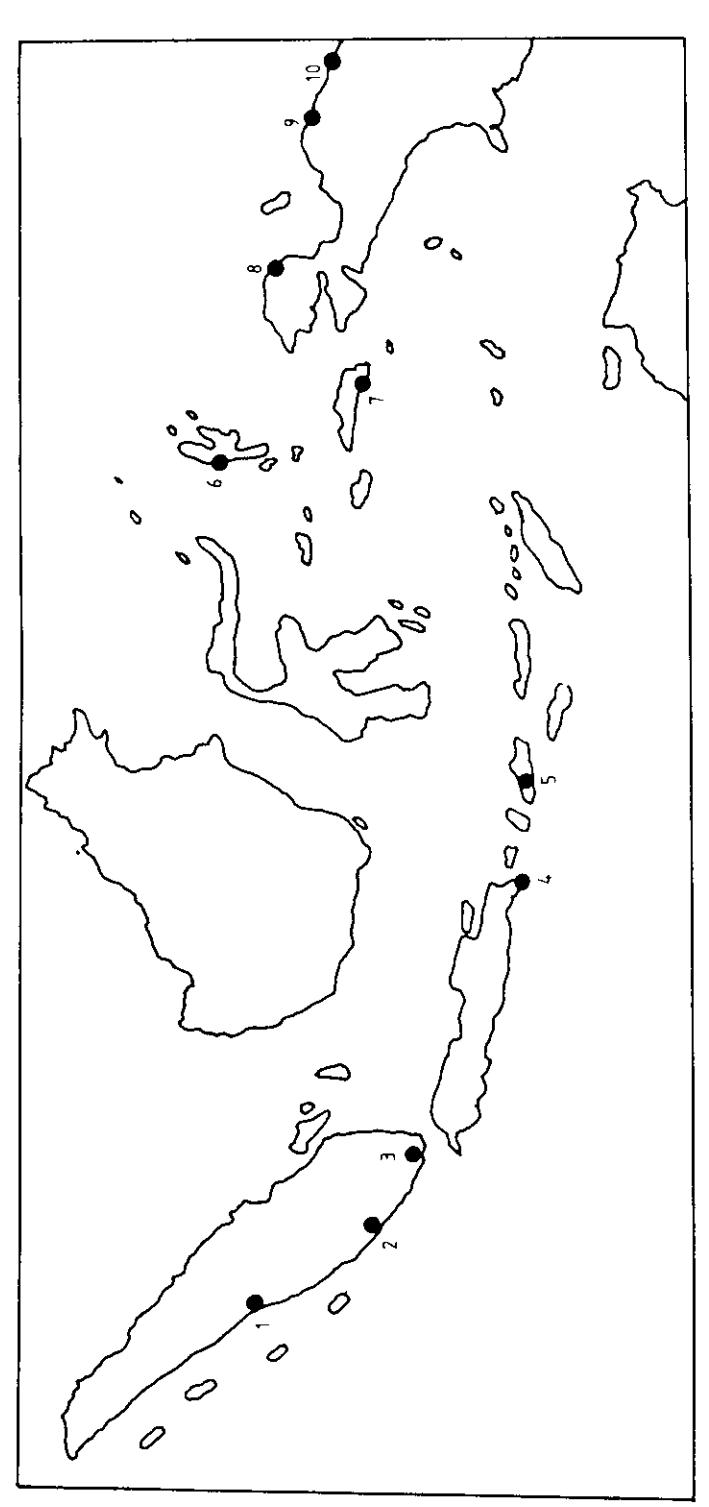
Figure 6 Location of the rainfall stations.
4 Discussion and conclusions
Tropical storms emerge in the regions of hot sea surface temperature of more than 26°C. In this context the region is situated in the north of Australian continent and it extends westward. There is a tendency that the emergence of tropical storm is related also to the thermal ridge. Another important condition of the tropical storm formation is that the Coriolis parameter must be bigger than a certain minimum value, which is the value at the latitude about 7°N or S. If the Coriolis force is weak, then there is no possibility of tropical storm formation. This Coriolis force be expressed as:
\[F_{co} = 2 \Omega \sin \phi. V\] where \(\Omega\) is the angular velocity of the earth rotation, \(\phi\) is the geographical latitude, and V is the wind velocity.
In cases of tropical storm ERROL and BRUNO, they emerge for the first time at latitude 12.5°S and 14.0°S respectively. The life times of these storms are eight days for ERROL ans six days for BRUNO.
Although the Indonesian archipelago is theoretically free from tropical storms (because it is situated between 7°N and 10°S), the weather in some parts of this region which is situated near the tropical storm track can be affected, especially rainfall, wind velocity and sea wave.