

Sari
Kctelitian geonretrik dan optimalisasi tingkat kctajaman citra video
Citra video, yang mempunvai beberapa keuntungan dibandingkan dengan citra satelit dan tbto udara. diperoleh dari hasil pcnertrangan di atas suatu daerah Sctelali citra tersctlrt direstorasi untuk rneningkatkan tingkat kctajan.rannya, dilakukan proses fotogrametri untuk mengevaluasi tingkat ketelitian geornetrikn'a. Restorasi citra dilakukan secara digital dengan enlpat rnacam teknik, vaitu pro;ektil-, interpolasi baris, dupikasi baris, dan korelasi statistrk. Evaluasi ketelitian geonretrik dilakukan dengan mcmbandingkan koordinat sejurnlah titik 1-ang diarnati pada citra video deusan posisi seharusnva di lapangan. Hasil pengujian rnen-eindrkasikatr bahua kautera lideo dapat digunakal pada periiotretan udarzr bagi keperluan pemetaan topografi skala urenengah.
Kata kunci: videografi, pentulihart dan ketelitian geometrik citrut yideo.
I Introduction
The trvo most colnmon sources of digital images used for urapping purposes are satellite scanners and scanned acrial photographs. These irnages provide a u'ide ground coverage and a high rnetric stability. Hon'er,er, the-v have sonle limitations, e.g. the geometric resolution of satellite images is not adequate for large and rnedium scale mapping (Steiner, 1992) Also, the price of the inrages can bc prohibitive for sonte uscrs and the delivery time is slorv. Liker.r'ise, scauned aerial photographs are not always a cost-effective source of irnagery since the purchase of a sophisticated photogrammetric scanner is not alrvays affordable, and scanning senices are expensive and often not readill, available. Further, satellite orbits are pre-programmed to cover a parlicular area onl)' at certain tinres (Jenser.r, 1986) and cloud coverage is ahval's a problem in sorne parts of the rvorld (Torlegard, 1992). Neither of these acquisition techniques is srritable for the lo*'-cost. continuous and real-tirne topographic mapping activin'.
Hence. an altcrnative source of digital topographic irnages is an altractive option. This paper examined the prospects of using a video camera for topographic mapping by evaluating the positional accuracy achieved.
2 Airborne videography
Airborne videographv is cnrerging as a cost-effeclive remote sensing lool for use by resource managers (Repic et al, l99l). Several interesting characteristics of videographv arc menlioned b1, Wright (1993). They are the general availabilitl. portability, sirnplicity and lorv cost aspects of the equipment $'hich pror,ides a grcat arnount of data for processing in real time and in soflcopy fonn. The sy-steln also ltas a. u'ide spect.ral sensitivitv These characteristics have promoted an increase in the use of airborne videography for aerial sun,ei'ing and. over the past ten vears. it has become
wiCel-'"' u-ed i'.r:' image interpretation (fuchardson et al, 1985; Ei'eiirt ei al, l9Sli; Mcek, 1988).
Wher all the variabies involved in the imaging technique arc. considered, video images are found to be less accurate than aeriai photography' of thc sanic scale. One inrage frarri: from a video camera is rnade up cf odd and even fields taken consecutively at rJue-fiffieth of a second interval. In conventional use the consecutive odd and even images are assurned to be taken simultaneousty from the same posltion. This assurnptron caflnot be rnade for airborne platfoniis $'here the movement of the camera introduces a significant shift between the t\r'o fields. The claritl' of terrain features is reduced following image composition of both fields into one full frame.
To replicate the normal coverage of a still camera. and to increase fhe interpretability of the rmages, consecutive odd and even fields of a video frarne must be restored into a composite interpretable frarne. Set'eral tecliniques have been proposed to irnprove the qualitl' of the cornposite image (Sumarto, 1997). They include the use of correlation functions, projective transformation. rolv duplication and row interpolation or averaging.
3 Experirnents
Aerial frames were collected trnd processed via conventional mapping orientation on a digital photogramrnetric workstation. The collected'l'ideo frames were then pre-processed by the four algorithms to improve their interpretability. A number of predefined check points were also coordinated The positional accuracy was checked by comparing the data derived from video with independent reference data collected in large scale aerial imagery and known to be at least ten times more accurate.
3.1 Study area
The campus of Curtin University of Technology rvas selected as a study area. This area is located at Benlley in the City of Canning, Perth, Western Australia. [t encompasses various gpes of terrain reflecting the average conditions of local urban areas, rvhere lorv-rise buildings, road networks, and green belts are characteristic features. Topographic elevations vary from 6 m to 20 m above the Australia geodetic daturn (AGD) and buildings range from one to six levels in height. It was considered an ideal testing area for airborne videography.
Numerous ground control poinls n'hich could be used as control or check points were available rvithin the area. Wide angle aerial photographs at a scale of l:4,000 and flown in l99l were also available. Film oositives of the large scale iiruges u'ere used to density the grourid conrrol and pro,ide the check points necessary for this researcir.
Several ruis-cr$ns were flout at apprcxirnately 500 rn ahnr,e thc lrirlirrnlrl datuni, grviug a ch<iire of tJ\erl*p and sccne illunrinafion. At this hciglrt the irnage scale rvas approxirnately l:65,000 and the ground coverage of a single image rvas approximately 300 m by 400 m.
3.2 Im;rge interprerabilitl
Lndgs rlrterpr'etabllil] rirtitns the degree to .,rhicli objects in the irttage can l:;;lcarl) recognised. Asharp rrrtage provides lnor'e ac:-.iiate inionnation and is easier to interpret. Many i'actors rnfluence the qualiiy- of the irnages. urost significant of rvhich is lens quality. Other factors, suclr as image motion eftecl and the natrrre of the Video iniagrrrg prucesses. also affect the level of inrerprctlbilitl.
\iirjeo iilrirges la1.,e rr liorn ;l lllo\ lng platt-orrn sufl'ei fionr motion distortion rr hich degrades the sharpness of the inrage. The rnost obvious effect of motion is the bhrr that occurs rvlreu the sensor tnoves relative to the target tluring the inraging process, This effect. hou'ever. can be reduced b1 using a liiglr speed sluner (rvhen available). or b1'rtiourrting tlre rideo canlera in rhe ailcraft so tliat the scairning direcrion is parallel but opposite to the flight direction (Pickup et al. 1995).
Other significant distortions that reduce the interpretabilitl' of an airborne video image occur because the present rideo carneras operale in an interlaced mode. The odd and cr'en fields are collected consecutivel), When the video camera is mor,ing, lhe secolrd field is taken frorrr a slightli' different position resulting in a double irnage effect. Figure I clearll' shorvs the effect of interlacing on an airborne video irnage. The objects are defonned in a systematic pattern where every second rorv is lrolizontalll, displaced rclative to the next c(,ittigu(lus rorr. 'flrc' fonvard iiiotion of the ailcrali causes the delorrrtatio'r.
Figure 1 Systematically deformed objects caused by the rnovement in the video imaging system platform
A further problem is the displacement caused by aircraft pitch, 1'aw and roll rvltich can be as great as the fonvard motion effect but not systematic from one frarne to the next. This means that adiacent features are no lonser adjacent in the image.
The determination of field displacenrent or the geometric corrcction of the image is a rather complex task. If lhe aircraft speed, attitude and altitude during irnaging are recorded accurately, field displacement can be calculated. However, this solution is rarell'found to be practical. It is usually necessary to detennine relatir,e shifts in the odd and even field locations using other techniques. These are outlined in the follou'ing section.
4 Refinement of video images
Several algorithms for image refinement have been used in this research. The algorithrns include:
- . statistical auto-correlation function (SCF or ACF).
- o projective trans[orrnation.
- . row duplication and,
- . row interpolation.
4.1 Statistical correlation function
A correlative procedure is another method for determining the relative vertical and horizontal displacement betu'een the fields u'ithin a franre regardless of camera orientation. Computation of these statistical properties of the irnage n'as adopted bi' Pickup et al (1995). The statistical properties of the irnage are used to calculate the relative displacernent bet*'een the odd and even frelds rvithin a frame and this shift is theu used to refine the image. This rnethod is based on statistical correlation theory where the correlation value will be high when there is a strong correlation between both fields, and will decrease as row and coluurn displacement increases.
For an ideal frarne, where there is no lateral nor longitudinal shift between fields, the correlation function between the odd and even fields rvill peak rvhen the lag equals zero (l=0) and gradually decline as the lag increases. The deviatlon from expected values can be used to estimate the amount of displacernent in both the vertical and horizontal directions of a field. Hou,o'er. when the cross-correlation peaks at a horizontal and/or a vertical spatial lag different frour zero, then that lag describes the amount of field displacement and the shift necessary to restore the geometric properties of the image.
This method colnputes the correlation betrveen two fields of a frarne. A single correlation befrveen each column and row in the even and odd fields is cornputed for the rvhole image frame. High correlation u,ill occur
u'hen trvo colurnns or rews arc rdentical or sirnilar The location corresponding to tlic ltrglrest col r (tlrlrur. coefficienthen represcnls thc ncccssarr coirrnrn cr ror\ shift bet\\een both ficlds.
Once the amount of pixel shift had been detennined. the irnage is refined bv applf irrg the ncnrest inlcgcr shifl in the grey-value of everv pixcl on all the evcn rou's (even field). along the ron itsclf. In this uranncr tlrc origirr.rl irnage shorvn in Figurc I can be rcconslnrcted as slrurrr in Figure 2a, uhich exhibits bctter inlcrprctabillr .
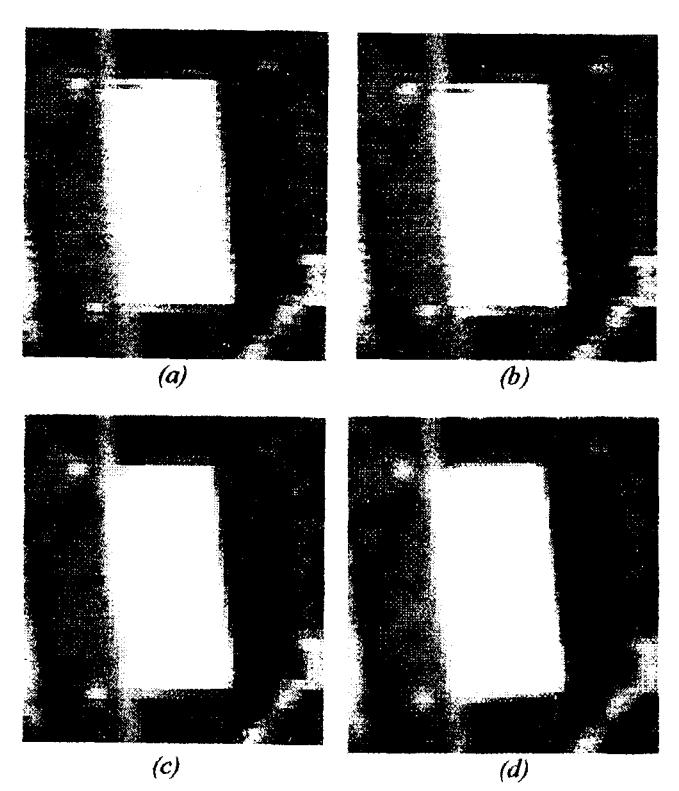
Figure 2 Video images afterefinement using (a) SCF method, (b) Projective, (c)Duplicatron, (d) Averaging
4.2 Projcctir.e transformation
Projective geornetn in photograrnmetry deals uith the gcornelric charactcristics of projectivclv relatcd fr::rtrtres An aerial video imagc is a projcction o1' objccts ou thc ground. so thc) are, at tlle rllonlenl of e.sposure, projectively relatcd. This relationship can, rdealll . be detennined b1' a sp,rce rescclion *'hiclr is a rigorous threc-dirnensiortal prolectivc trausfornratron. Tlie transforrnation paranretcrs dcscribe lhc location and orieutzrtion of the aerial caulera. -fliese valucs can then be used to transfortn photo coordinates to thc ground system or vlce-\'ersa.
The space relationship bet*'ccn lhe even and odd fields in a frame. however. can bc adcquatclv de(crrnined using a two dirnensional pr o.jcctir etrarrsfcrrruation because of the identical surface rnodcl lor czrclr iirragc. The two dirnensional protcctive transtbnnation equalions (Equation l) is uscd in lhe atralllical
computation of the two dimensional image coordinates of points after they have been projected into a plane from another non-parallel plane (Figure 3). The positions of points on a plane can be related to their corresponding projected positions on another plane or, in this case, coordinate positions of points on the even field can be projectively related to their corresponding positions on the odd field. When all the necessary parameters relating to both fields are known, all the information in the one field can be transformed into the other.
\[\begin{bmatrix} x \\ y \end{bmatrix} = \begin{bmatrix} x & 0 & y & 0 & 1 & 0 & \lambda x^{1} & y x^{1} \\ 0 & x & 0 & y & 0 & 1 & x y^{1} & y y^{1} \end{bmatrix} \begin{bmatrix} a_{1} \\ a_{2} \\ b_{1} \\ b_{2} \\ c_{1} \\ c_{2} \\ a_{0} \\ b_{6} \end{bmatrix}\](1)
where x,y = coordinates in system 1, x', y' = coordinates in system 2, ai,bi,ci = transformation parameters.
Figure 3 Projective relationship
4.2.1 Video image refinement
Field displacement in a field image can be eliminated by transforming the plane of the even into that of the odd field using a projective transformation. An indirect transformation was used to restore the image in this study. During the pixel transformation, the relative pixel shift between the two fields is eliminated resulting in a reconstructed image which is theoretically free from relative field displacement. A grey-value for the transformed pixel was then interpolated using the nearest-neighbour method principally to maintain the overall image integrity and not introduce new brightness values or digital numbers (DN). Figure 2b shows an example of an image refined by this method.
4.3 Estimation by neighbouring row duplication
In remote sensing a cosmetic operation is usually applied to reconstruct digital images which contain either partially or entirely missing scan rows caused by a tiaw in the sensor of other components of the scanner. An estimate of what the original values might have been may be made by considering values in the rows adjacent to the missing rows (Mather, 1987).
There are three ways of achieving this neighbour row replacement, adjacent row interpolation or reconstruction using information from two adjacent bands (Bernstein et al. 1984; Fusco and Trevese, 1985). However, the third method was not implemented in this study as video image has only one band.
The first method estimates the missing pixel value from the value of the corresponding pixel in the closest preceding row. For example, if the missing pixel value is denoted by vij (paxel i in row j) then the formula is:
\[v_{ij} = v_{ij+1} \tag{2}\]
For the case when the missing row is the first of an image then the second row can be copied. However, this method will introduce an image defect particularly in linear features. When the feature is nearly parallel to the missing row, a double image will occur. Moreover, copying a row increases pixel resolution in one direction and will affect the aspect ratio of the image. Figure 2c shows an example of image refined using this technique.
4.4 Estimation by adjacent row interpolation
The second method uses DN from adjacent rows; the rows above and below the missing row. The DN for each pixel on the row is computed by averaging corresponding pixel values on the adjacent rows.
\[v_{ij} = \text{Int} \left\{ (v_{ij+1} + v_{ij+1})/2 \right\}\] (3)
This method may produce a new DN in a row which is not typical of those in neighbouring rows. This can happen when the missing row coincides with the border of two distinct features, such as the border between land and water. The interpretability of the image is improved if a feature is nearly vertical.
In the case of a straight diagonal line or one nearly horizontal, the refined image may exhibit a stair pattern or the line may split, thereby degrading image quality (Fusco and Trevese, 1985). Figure 2d shows an image refined using this technique
5 Criteria for assessment of interpretability
Assessment of the resampled images may best be made by visual examination of vertical features as shown in Figures 2a, b, c, d. All images show an improvement in clarity. They look sharper than the original images (Figure 1). However, to evaluate the improvement in interpretability, it is necessary to define quantitative
criteria and develop procedures which will allolv an objective comparison of the various rnethods of irnage refinement. To avoid judgernent based only on a subjective or persoual vierv of the interpretabiliry', a rnethod of statistical assessment has been proposed and described.
The proposed two statistical methods compare the refined image with the expected frame or a control liarne. The statistical properties of the irnages are used to assess similariry. The cross-correlation coefficient (0 between the two images reflects the level of similariry'. Values near to one (l) indicate images that are strongly correlated and contain nearll' the same infonnation (grey-values). Any deviation from one means the image is less correlated and rvhen the coeffrcient is equal to zero there is no correlation. Secondly, the root mean square (RMS) of ratioed image also reflects the level of sirnilarity betrveen the refined and control images. High sirnilarity is found when the value is close to zero.
A scanned aerial photograph covering the same area \r'as used as the control frame (Figure 4). The photograph u'as preferred to a simulated iniage because it was subject to a similar error budget to the video image, except for the hne interlacing effect. Unfortunately the photograph was not taken sirnultaneously with the video ipages, so factors such as 'weather, sun angle, and camera tilt rnay have had sorne small differential effect on the DN of sirnilar features. Consequently a strong correlation between the scanned photograph and refined video irnages was not expected in this test.
Figure tl Scanned aerial photograph
5.1 Numerical assessment by statistical methods
Images that contain sirnilar or identical inforrnation. in statistical terms, are strongly correlated. For example, due to the spectral characteristics of vegetation, rnultispectral images of vegetated areas have a positive correlation amongst the visible bands and a negative correlation (un-correlated) betu'een near-infrared and visible red bands. The presence of a positive correlatioq irnplies that some information contained on the irnages was similar and the correlation coeffrcient reflects the level of similarity or repetition of infbnnation between the images.
In the first strategy applied in this research, correlation coefficients rvere colnpuled for alI ibur' retincd irnages with respect to the true or control irnage. As rvas explained, a scanned aerial photograph (Figure 4) covering the same area. was assurned to be a true image and used as the control image. The cornputed coeffrcients reflect the degree of sinrilanty betu'een each of the refined images and the control image. A higher coefficient indicates a refined irnage which is more comparable with the sharp, clear. control image and lherefore Iikel,v to be rnore inlerpretable.
Image to imagctransforrnations were perforrned in order to minimise origin and orientation differences between refined and control irnages. hnage re-sizing rvas also llecessary to ovcrcome srnall-scalc differelccs 'l'lre forrr refined irnages. SCF, projective, line duplicatron, and averaging interpolation along rvith the unrefined image rvere then compared u'ith the control image.
Two areas occupying nominalll'4000 and 30.000 pixels were extracted frorn each of the rmages. The large nurnber of points in each Area \\as sufticieirt for statistical analysis and dernonstration of the different perfonnance of reconstruction algoritluns on different image patlerns. Correlalion coefficients betu'een the control and the aforementioned fir'e irnages uere then computed. The results are surnrnarised in Table l.
Table 1 Percentage correlation coefficients of area 1 and 2 relative to the control image
| Area Image | A | В | C | D | E |
|---|---|---|---|---|---|
| 1 | 53.42 | 54.47 | 54.64 | 54.49 | 54.98 |
| 2 | 56.59 | 65.86 | 65.86 | 65.66 | 65.53 |
The second strategy for statistical analysis involved the computation of ratioed images. The reference image rvas divided first by the original urrrehned irnage and then each of the four refined images. Theoretically, if both irnages involved in the ratio rvere identical, the new ratioed irnage rvould consist of an arral' of pixel elernents all equal to one. Any deviation from one would indicate difference betrveen images. The root mean square (RMS) difference of pixel values in the ratioed images computed using Equation 4 reflected these differences. Srnaller RMS values indicated closeness of the rehned images to the standard irnage. The results are summarised in Table 2.
\[RMS_{diff} = \sqrt{\frac{1}{n} \sum_{i=1}^{i=n} (E_i - \overline{E})^2}\] (4)
where E = rnean value of pi.xel ratio.
/? = nulnber of pixels,
E, = r,alue of pixel ratio i
table 2 . Foot mean square (RMS) values of ratioed image of window 1 and 2.
| Area , image | 4 | В | С | מ | E |
|---|---|---|---|---|---|
| 1 | 0.833 | 0.820 | 0.820 | 0.823 | 0.803 |
| 2 | 0.810 | 0.794 | 0.794 | 0.796 | 0.743 |
5.2 Results and discussion
Because the analogue based reference image was captured at a different time to the digital video images, minor temporal radiometric and optically caused geometric differences existed. Perfect correlation was not anticipated (Table 1). The results, however, indicate that there was an improvement in the quality of images after reconstruction by particular algorithms. Results obtained by using the different algorithms have been ranked.
All methods produced significant improvement as the correlation coefficients increased and RMS errors decreased. Statistics show that all the refined images show improvement which peaked at 16 percent for correlation coefficients (Table 1) and eight percent for rationing (Table 2). Although marginal, there was clear statistical evidence that the row interpolation algorithm produced superior results.
The results indicate that line replication performed worst. The SCF and projective transformation algorithms were slightly better. More significant improvements were obtained by using the averaging or row interpolation approaches. The statistical data indicate that this method increased the image interpretability by approximately eight percent when compared with other methods.
6 Geometric assessment
It should be stressed that for low-order applications, such as local map updating, aerial triangulation is not a primary concern because accurate ground control can usually be extracted from available large scale maps or aerial photographs. For this research existing 1:4,000 aerial film positives were measured in a precise analytical stereo digitiser.
In total there were more than 80 points measured on a Wild BC-2 analytical stereo digitiser and used for control or check points. The points were large, natural or artificial features which could easily be recognised. They included the corners of buildings, a chimney, a road junction, a street island, a manhole and parking lines.
The RMSE of photogrammetrically derived coordinates taken from the large scale photographs for control and check points was considered very low compared to the errors in the coordinates extracted from the video images. The scale of the video image was much smaller (about 17 times) than the scale of aerial photographs. Therefore in the error propagation chain, the video image error was overwhelming (Ding, 1996).
6.1 Geometric accuracy
The accuracy of measurements from photographs can be classified either as absolute or relative (Warner, 1989; 1990). Absolute accuracy is the exactness in the location of a given point on the image compared with its true position. It is usually given in standard x, y and z coordinates. Relative accuracy refers to the location of different points relative to each other.
Photogrammetrists have always been concerned about the accuracy of their observations and products. GIS managers require absolute accuracy so that new data can be integrated into existing databases without ambiguity. Map overlays, intersections or analyses cannot be performed if the data are inaccurate (Thapa and Bossler, 1992). Relative accuracy, on the other hand, is of interest to map users, such as planners or resource managers, who usually want to measure distances and height differences between points.
Both the relative and absolute accuracies of measurements made in this research were computed. Absolute accuracy is represented by the root mean square (RMS) of the discrepancy in coordinates computed using Equation 5. Relative accuracy is represented by the RMS of discrepancy in distances or heights measured at check points computed using Equation 6.
\[RMS_{disp} = \sqrt{\frac{1}{n} \sum_{i=1}^{n} (x_{obs_i} - x_{gcp_i})^2}\] (5)
\[RMS_{disp} = \sqrt{\frac{1}{n} \sum_{i=1}^{i=n} \left( d_{obs_i} - d_{gap} \right)^2}\] (6)
6.2 Restitution of stereomodels and point measurement
After performing an individual image refinement aimed at optimising interpretability, stereomodels were oriented on an Intergraph ImageStation softcopy photogrammetric workstation using a minimum of twelve points for relative orientation and six points for absolute orientation. Computed lens and camera parameters were included in this process. Image differential scale and lack of orthogonality were compensated during interior orientation. The results of the absolute orientation (AO), in particular the RMS of the ground control coordinate residuals, are presented in Table 3.
With 70 percent forward overlap and 1:65,000 image scale, one stereomodel covers approximately 300 m by 300 m on the ground. This area is less than one percent of the area of a stereo model generated from full format image at the same scale. Base-to-height ratio of the model was 0.3 which is half that for 60 percent overlapping wide angle imagery.
Stereoscopic observations were made on pre-selected check points. An estimation of absolute accuracy, as indicated by the RMS of coordinate discrepancies, was computed and the results are summarised in Table 3.
More than 50 distances and height differences were also measured in each stereomodel. These measurements were then compared with the corresponding ground distances measured on the large format as control images. The RMS of discrepancy of the measurements are presented in Table 4.
6.3 Discussion
Table 3 presents the model configuration for stereo restitution and estimates of the accuracy of absolute orientation based on stereo measurement residuals on ground control and check points. These values collectively indicate the accuracy of point measurement in the stereoscopic video images.
The internal accuracy, resulting from the absolute orientation of the stereomodels, was predictably lower than for equivalent scanned aerial images. The RMS of the coordinate residuals at the control points were respectively 0.866 m and 0.873 m for planimetry and height. External accuracy or RMS of residuals at check points for planimetric and height was about 1.5 m.
The RMS of residuals at check points were Sxy = 1.303 m and Sz = 1.544 m, about 1.6 times larger than the control points. It can be seen that the horizontal accuracy was better than the height accuracy. This was mainly due to the weak base-to-height ratio of the video stereomodels.
Table 3 RMS of discrepancy at control and check points
| Model No. Scala | RMS at control points | RMS at check points | |||||
|---|---|---|---|---|---|---|---|
| Scale | B/H | No. GCP. Check | x y xy(m) | h (m) | x y xy(m) | h (m) | |
| 1 | 1:66323 | 0.29 | 7 18 | 0.748 0.489 0.894 (13.4*) | 0.995 | 0.570 0.840 1.040 (15.7*) | 1.813 |
| 2 | 1:66146 | 0.29 | 8 41 | 0.664 0.337 0.745 (11.3*) | 0.978 | 0.824 0.927 1.240 (18.7*) | 1.278 |
| 3 | 1:63716 | 0.39 | 7 8 | 0.729 0.634 0.960 (15.1*) | 0.645 | 1.136 1.169 1.631 (25.6*) | 1.540 |
| Av | rerage | 0.866 | 0.873 | 1.303 | 1.544 | ||
*at image scale (µm)
Table 4 Relative accuracy of horizontal distances and height differences
| Relative Accuracy | ||||||
|---|---|---|---|---|---|---|
| Model No. | Scale | ВЛН | N | RMS Dist. (m) | RMS AH(m) | |
| 1 | 1:66323 | 0.29 | ≈ 50 | 0.815 (12.3*) | 1.221 | |
| 2 | 1:66146 | 0.29 | ≈ 80 | 1.146 (17.3*) | 1.296 | |
| 3 | 1:63716 | 0.39 | ≈ 50 | 1.277 (20.0*) | 1.333 | |
| Ave | rage | 1.079 | 1.2283 | |||
*at image scale (µm)
Although the check point RMSE equated to 23 (m on the 1.65,000 video image (approximately three pixels), the results were of sufficient quality to meet user specifications for maps at a scale of 1:15,000 or smaller (DOLA, 1994) or for maps at a scale of 1:25,000 (Bakosurtanal, 1992).
Table 4 display the relative accuracy of distances and heights measured on the video image, compared with those measured on the large format control images. The RMS of the discrepancies in distance and height differences were found to be slightly larger than one metre, specifically 1.079 m for horizontal distances and 1.283 m for height differences. With respect to the longest distance used in the stereomodel, some 230 m, this represented a relative accuracy which is about 0.5 percent or 1/200.
7 Conclusions
The intention of this study was to provide evidence that airborne video images could be used for mapping purposes where only moderate accuracy is required. Considering the error chain involved in analogue video imaging, it was understood that standard aerial photographs would be still the primary mapping image with the video image having a minor revision role. This preliminary investigation has demonstrated that it is feasible to employ a video camcorder in aerial mapping for applications which require low order accuracy.
The reconstruction of airborne video images by all four methods produced a better quality image. Qualitative observation of all the refined images showed that they were sharper and more easily interpreted than the original non-refined image. Additional results from a quantitative statistical analysis also indicated that all methods improved the image. The row interpolation method was superior to the others. It can be concluded that, by using this interpolation method, defects in an airborne video image caused by platform motion can be refined so as to produce a reconstructed image of adequate quality for ortho-image production.
The work carried out has indicated the potential of a video camcorder to supply aerial images for application such as local medium scale mapping or map revision programs. The attainable accuracy is around 1.5 m when flying from minimum altitudes and using wide angle lenses. This accuracy will meet user specification for map revision at scales of 1:15,000 or smaller.
8 References
- 1. Bakosurtanal (1992) Spesifikasi Peta Rupabumi Indonesia Skala 1:25,000, National Map Specification, Cibinong, Indonesia.
- Bernstein, R., Lotspiech, J.B., Myers, J.H., Kolsky, H.G., and Lee, R. (1984) Analysis and Processing of LANDSAT-4 Sensor Data Using Advanced Image Processing Techniques and Technologies, Institute of Electrical and Electronic Engineers Transactions on Geoscience and Remote Sensing, Vol. GE-22, No. 3, pp. 192-221.
- Ding, X. (1996) Personal Communication, Department of Land Surveying and Geo-Informatics, Hong Kong Polytechnic University, Hung Hom, Kowloon, Hong Kong.
- 4. Department of Land and Administration (DOLA) (1994) Topographic Data Acquisition, Standard Specification Circular, Department of Land Administration, Perth, Australia.
- Everitt, J.H., Escobar, D.E., Gerbermann, A.H. and Alaniz, M.A. (1988) Detecting Saline Soils with Video Imagery, Photogrammetric Engineering and Remote Sensing, Vol. 54, No. 9, pp. 1283-1287.
- Fusco, L. and Trevese, D. (1985) On the Reconstruction of Lost Data in Images of More than One Band, International Journal of Remote Sensing, Vol. 6, No. 9, pp. 1535-1544.
- Jensen, J.R. (1986) Introductory Digital Image Processing: A Remote Sensing Perspective, Prentice Hall, New Jersey, USA, 379 pp.
- 8. Mather, P.M. (1987) Computer Processing of Remotely-sensed Images: An Introduction, John Wiley and Sons, Suffolk, UK, 352 pp.
- Pickup, G., Chewings, V.H. and Pearce, G. (1995) Procedures for Correcting High Resolution Airborne Video Imagery, International Journal of Remote Sensing, Vol. 16, No. 9, pp. 1647-1662.
- Repic, R.L., Lee, J.K. and Mausel, P.W. (1991) An Analysis of Selected Water Parameters in Surface Coal Mines Using Multispectral Videography, Photogrammetric Engineering and Remote Sensing, Vol. 57, No. 12, pp. 1589-1596.
- 11. Richardson, A.J., Menges, R.M. and Nixon, P.R. (1985) Distinguishing Weed from Crop Plants Using Video Remote Sensing, Photogrammetric Engineering and Remote Sensing, Vol. 51, No. 11, pp. 1785-1790.
- 12. Steiner, D.R. (1992) The Integration of Digital Orthophotographs with GIS in a Microcomputer Environment, ITC Journal, Vol. 1992-1, pp. 65-72.
- Sumarto, I (1997) An Investigation into the Applicability of Airborne Videography for Topographic Mapping, Unpublished Ph.D Thesis, Curtin University of Technology, Perth, Western Australia, 250 pp.
- Thapa, K. and Bossler, J. (1992) Accuracy of Spatial Data used in a Geographic Information System,
- Photogrammetric Engineering and Remote Sensing, Vol. 58, No. 6, pp. 835-841.
- Torlegard, K. (1992) Sensors for Photogrammetric Mapping: Review and Prospects, Intemational Society for Photogrammetry and Remote Sensing .Toumal of Photogrammetry and Remote Sensing, Vol. 47, pp. 241-262. l 5
- Vlcek, J. (1988) Nature of Video Images, Proceedings of American Society for Photogrammetry and Remote Sensing First Workshop on Videography, Indiana, USA, October,pp. 5-12. t 6 19.
- Wamer, W.S. (1989) A Complete Small-format Aerial Photography System for GIS Data Entry, ITC Joumal, Vol. 1989-2, pp. 121-129 t 7
- Wamer, W.S. (1990) Accuracy and Srnall-fonnat Surveys: The Influence of Scafe and Object Detiniti<xr on Photo Measurements, ITC-.Toumal, No. 1990-1, pp. 1A a 1 t 8
- Wright, R. (1993) Airbome Videography: Principles and Practice, Photogrammetric Record, Vol. 14, No. 81, pp.447-451.