

Sari
Pemodelan penyebaran air hangat dari pembangkit listrik tenaga uap di perairan Muara Karang, Teluk Jakarta
Pemodelan sebaran panas di Teluk Jakarta merupakan salah satu bagian dari studi resirkulasi air pendingin PLTU Muara Karang, Jakarta Utara. Hasil simulasi pada makalah ini menggambarkan kondisi pada musim timur (Agustus 1994), musim peralihan (November 1995), dan musim barat (Januari 1996). Sebaran ternal di perairan Muara Karang dekat saluran outlet PLTU untuk masing-masing musim dan semua kondisi pasang surut dan angin sangat dominan dipengaruhi oleh debit PLTU yang maksimum 35,1 m³/detik. Di daerah jauh, arah sebaran ternal bergantung pada arus musim (pengaruh angin) dan sebagian dipengaruhi oleh pasang surut. Temperatur air panas yang keluar dari saluran outlet menyebar ke perairan dengan luas minimum 58,60 hektar pada musim peralihan pada saat air pasang maksimum, dan luas maksimum sekitar 156 hektar pada musim peralihan saat air menuju surut. Secara umum hasil simulasi pada musim timur yang dibandingkan dengan data lapangan hampir sesuai, sedangkan pada musim peralihan dari musim timur ke musim barat dan pada musim barat masih akan diverifikasi lebih lanjut.
Kata kunci: reklamasi pantai; sirkulasi air pendingin; sebaran termal.
1 Introduction
In the frame work of study on cooling water circulation of Muara Karang (North Jakarta) Power Plant which aims to evaluate the impact of coastal reclamation near the plant, a simulation of heated water spreading have been performed in the Muara Karang coastal waters that is a part of Jakarta Bay (see Figure 2). The final goal of the study is to try to find out the solution of a conflict of interest between the owner of the power plant and the developer who has reclamated the coastal area near the plant. However this paper is written based on the progress results. So, the above mentioned solution is not yet described in the paper and will be implied in the final result that is being finalised. The authors have analyzed simulation results in the east, west, and transitional seasons, and have compared model simulation in the east season with observed data.
From the environmental point of view, Burhanuddin (1989) had studied an impact of thermal pollutant from this power plant on marine biota in this coastal waters area (see also Mahlan, 1984 and Martono, 1984). Burhanuddin had concluded that only fishes, crustaceans, and mollusca are tolerant to high temperature and can live in the hot environment. The highest temperature tolerated by fishes is 38.1°C, by crustaceans is 37.9°C and by mollusca is 36.7°C.
Results of the modelling of the heated water spreading described in this paper can be used for an environmental investigation as mentioned in the above study.
The model is based on a far field model that includes different flow rates and increasing of temperature of discharge canal of the power plant. Governing equation of the model is based on basically advection-diffusion equation with the adding of source term and a term that represent an interaction process of thermal exchange between the sea and the air. The velocity field of coastal waters had been derived from a horizontal 2-D hydrodynamics model (Mihardja, et al, 1996).
This paper describes the simulation results of thermal pollutant transport in the east, transitional, and west seasons represented in August 1994, November 1995, and January 1996 respectively, in which the observed data are available to verify the model. The simulation was carried out for various tidal and wind conditions, and as well as various coastal morphology alterations due to reclamation.
2 Methods
2.1 Depth averaged transport equation
The 3-D model of transport equation (DHL and MIT, 1975; and Fisher, 1979) is applied for a simulation of heated/cooling water transport, in an assumed homogenous coastal waters near Muara Karang power plant. For this application, the equation is integrated in a vertical direction using Leibniz's rule. The integration is done from bottom (z=-h) to surface water (z=\(\zeta\)) to obtain a depth averaged or 2-dimension horizontally model transport equation as shown in equation (2.1) (Cahyono, 1994; DHL and MIT, 1975; Fisher, 1979; and Leonard, 1979):
\[\frac{\partial}{\partial I}(HT) + \frac{\partial}{\partial x}(HuT) + \frac{\partial}{\partial x}(HvT) = \frac{\partial}{\partial x}(HK_x \frac{\partial T}{\partial x}) + \frac{\partial}{\partial y}(HK_y \frac{\partial T}{\partial y}) - \frac{A}{\rho C_p}(T - T_a) + \frac{Q_{out}T_{out}}{A_p}\] (2.1)
where h is the depth of the water (m); \(\zeta\) is the sea surface elevation (m); A is the sea-air heat exchanged coefficient; \(A_p\) is a cross section area (m²); dimension of \(C_p\) is the specific heat at constant pressure; \(H (= h + \zeta)\) is the actual depth (m); \(\rho\) is the sea water density (kg/m³); T, \(T_a\) and \(T_{out}\) are actual, ambient, and outlet temperature (°C) respectively; u,v and Kx,Ky are velocity components (m/sec) and turbulence coefficients (m²/sec) in x and y axis direction respectively; and \(Q_{out}\) is the outlet discharge (m³/sec).
2.2 Numerical solution
The heat transport model equations have been solved by UPSTREAM (Noye, 1987) and/or QUICKEST methods (Leonard, 1979). The numerical discretization of the model in equation (2.1) is done as follows: the time derivative term is discretized in forward difference, while advection and diffusion terms are discretized as a difference between their fluxes that are occurred among the boundaries of a grid cell. This discretization is performed in term of a staggered grid, where variables of velocity, depth and temperature are located at separate points in a grid cell as shown in figure 1 below:
Figure 1 Numerical schematization of a grid
The numerical solution of equation (2.1) is written as follows:
\[\frac{H_{i,j}(T^{n+1}-T^n)}{\Delta t} = -\left[ \frac{\left(U_{i,j}(HT)_{i+\frac{1}{2},j} + U_{i-1,j}(HT)_{i-\frac{1}{2},j}\right)}{\Delta x} \right]^{n} + \left[ \frac{\left(V_{i,j}(HT)_{i,j+\frac{1}{2}} + V_{i-1,j}(HT)_{i,j-\frac{1}{2}}\right)}{\Delta y} \right]^{n} + \left[ \frac{K_x \left(H\frac{\partial T}{\partial x}\right)_{i+\frac{1}{2},j} - K_x \left(H\frac{\partial T}{\partial x}\right)_{i-\frac{1}{2},j}}{\Delta x} \right]^{n} + \left[ \frac{K_x \left(H\frac{\partial T}{\partial x}\right)_{i,j+\frac{1}{2}} - K_x \left(H\frac{\partial T}{\partial x}\right)_{i,j-\frac{1}{2}}}{\Delta y} \right]^{n} + \left[ \frac{Q_{out}}{\Delta y} T_{out} \right]^{n} + \left[ \frac{Q_{out}}{\Delta y} T_{out} \right]^{n}\] where:
i,j : the number of grid space iteration in x and y directions
n : the number of time iteration
\(\Delta x\), \(\Delta y\): the grid size in x and y directions (m)
\(\Delta t\): the time step (sec)
3 Results and discussions
The heat transport model equation (2.2) was used to simulate thermal dispersion due to the heated circulation
doi betteasi and tide
ri
pl
N of
Ja
cu
sp.
3.1
Fre
Tab
E (A
Trai (No
W (J
Notes: PSS: S SSS: S SPS: S PPS: S Distance
water of Muara Karang Porver Plant in North Jakarta. The water is used in a cooling slstetn for generating 700 MW of elcctricity. This location is surrounded by Karang and Angke Rivers (at western side) and Pantai Mutiara Rcsort and Sunda Kclapa Flarbour (at easterrt side)(see Figue 2). Discharged walers frorn the outlet is steered through an opened canal via Pantai Mutiara Resort. Natural sea water is purnped through an open concrete-wall intake canal.
The model was lead by the hydrodynamics model to obtarn current field. Tltc currcnt is induccd by a combination of natural and artificial processes, i.e. tide, ocean turbulence, wind surface, Angke and Karang rivers, and disclnrge of cooling water of the porvcr plant. The hydrodynamics model was irnplernentcd by Nested Model Technitlue to obtain dctailed current field of Muara Karang coastal waters frorn the largc rnodcl of Jakarta Bay (N{ihardja, et a/., 1996). The obtaincd cunent field is used as an iuDut data for thermal rvaler spreading modcl.
3.1 Sirnulation dcsign
From our obscrvation in August 199:t until January 1996, (Mihardja, et al., 1996), the hcatcd $'atcrs $'as dorninantly dispcrscd in the "outlct pond", i.e. the arca between the rvest coastlinc of Pantai Mutiara and the eastcrn side of intake canal wall. In thc far field. the thermal plt*r, therl dispcrsed out to the cnvironurcnt and followed the current pattern tlrat is induccd by u'ind, tide, and rivcr disclnrgc.
The model is uscd to describe the thcnnal dispcrsron iu more details and colrrpreheusive. To do tlnt ttre ntodel was ran for each season, tidal condition, and coastal morphology clunges due to reclamation. The seasons that were sirnulated were the east season. the transitiornl season, and the west season as an annnl variation due to tnonsoon. The maximurr intake-outlet discharges wcrc set constant at 35.1 mt/scc each, while thc discharge and temperature increasing, actually, follorvcd the electricity generation at lhe time.
Note thal the hcat or thcrnlal rnay bc repre.scnted as actual sea *'ater tenrperature and/or incrcasing tcrnpcraturc from its natural tempcmture tlut varies for cach season. Thc conrplctc simulation results are surnnrarized in Table I and the description of each ilnportant condition for lhc cnvirorrrnsnt will be described as follorvs.
3.2. Simulation rcsults
3.2.1 Simulalion in the east selson
The therrnal plurne dispersion of the east scasou is reprcsentcd by a sinrulation in August 1994 lscc Figurc 3.1.1 and FigLrrc 3.1.2). Tlrc natural teruperaturc is 2'1 .6"C that is takcn fronr our obscnation on 4-12 August 1991 (Mihardja, et o1.,1996). In all of the tidal conditions, tlre dorninant dispersion is in west direction througlr Angke breakwatcr (i.e. morc than 1450 mcters distance).
Table IResume of simulations of thermal dispersion of Muara Karang Power plant
| Simulations | Coastal Morphology condition | Tidal Condition | Plume spearing description | Plumo spraading area (hectaro) | |||
|---|---|---|---|---|---|---|---|
| Oominant direction | Distance") | nr'o,scc | I | ar;teblar 'ao'c | |||
| Easl soason (August 1994) | Tho Inlake Channel and Pantai Muliara | PSS | Wsst | Unlrl breakwater Angko, aboul 1 450m | 290,64 | 42,88 | |
| are still in original (Figure 2) | sPs | West | Until brsakwater Angke about 1450m | 201,68 | 50,2{ | ||
| Transition season (November 1995) | Tho lntake Channel is longlhened about | PSS | Norlh | Conlined in outlel pond: about 100m | 91,04 | 55,16 | |
| 600 m; Panlai | sss | North | About 1300m | 144,44 | 59,64 | ||
| Mutiara starts to be | SPS | Norlh | About l300m | 146,68 | 60,76 | ||
| reclamated | PPS | Nodh | Confined in outlot por:d: /UUM | 58,60 | 29,00 | ||
| West season (Januari 1996) | The lnlake Channel is lhe sams as | SSS | Norlh | Up lo norl model boundary: > 1450 m | 't 35,60 | 75,12 | |
| abovs: Reclamation of | sPs | Norlh and East | Aboul 1450 m | 139,64 | 68,96 | ||
| Panlai Mutiara had rsachod about 500m | PPS | East | Until Sunda Kelapa Harbour: aboul 100 m | 121,20 | 56,32 | ||
| PSSS | North | Confined about 1300 ni | 93,12 | 62,76 | |||
Notes:
PSS: Spring Ebb Condition
SSS: Spring Lowst Water
SPS: Spring Flood Condition
PPS: Spring Highest Water
Dislance is measured from the mouth of outlet channel at Pantai Mutiara
PRC
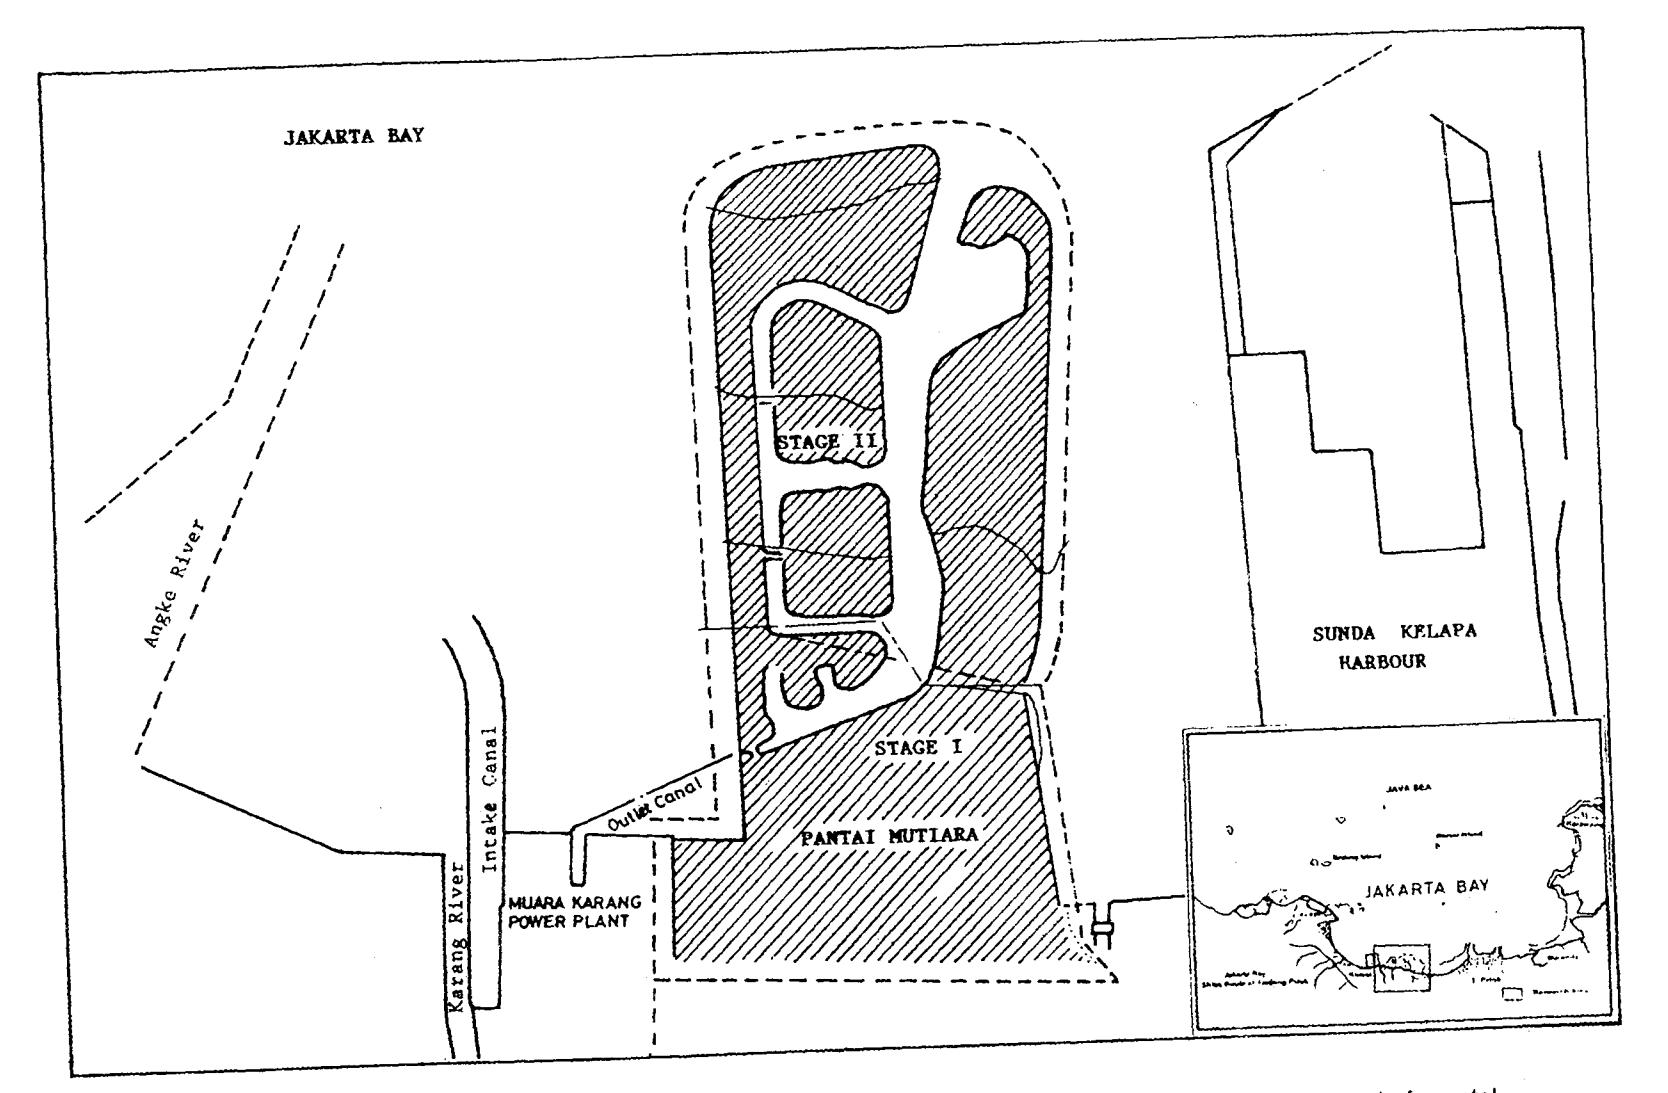
Figure 2 Situation map of Muara Karang Coastal Waters Jakarta Bay and location of the power plant and of coastal reclamation plan of Pantai Mutiara
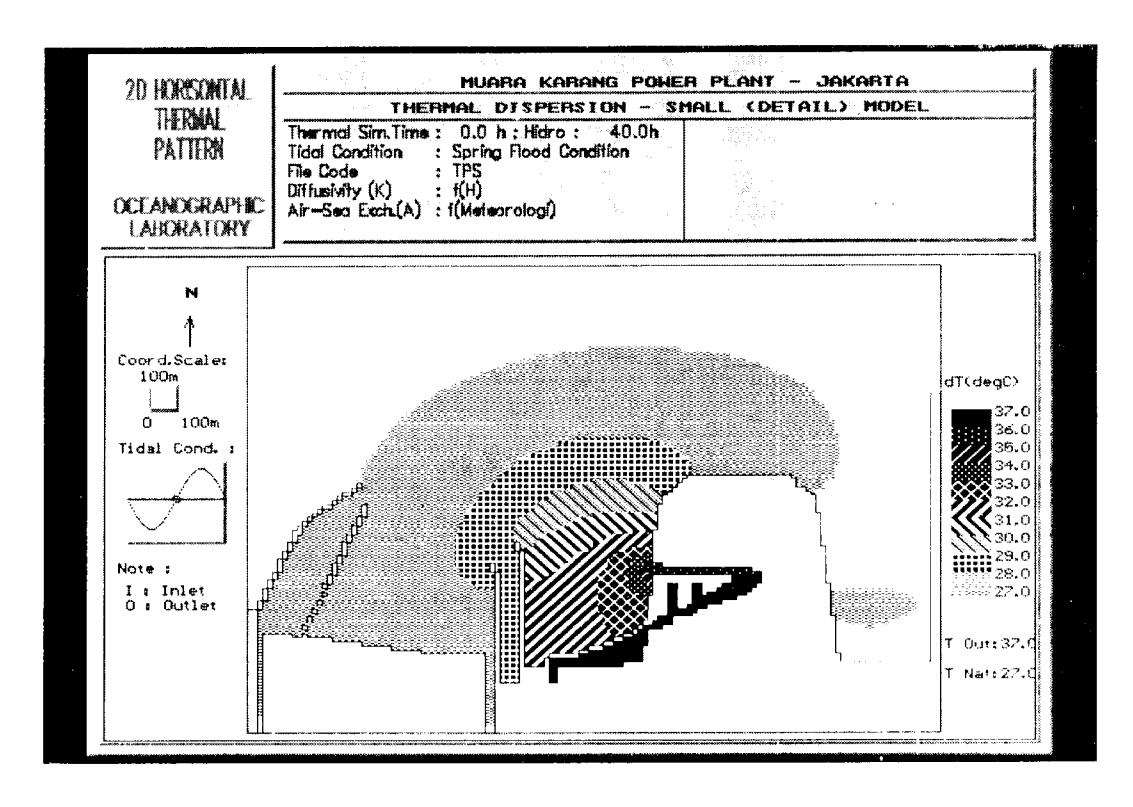
Figure 3.1.1 Thermal Dispersion simulation when water level goes to flood spring, in August 1994 (East wind season)
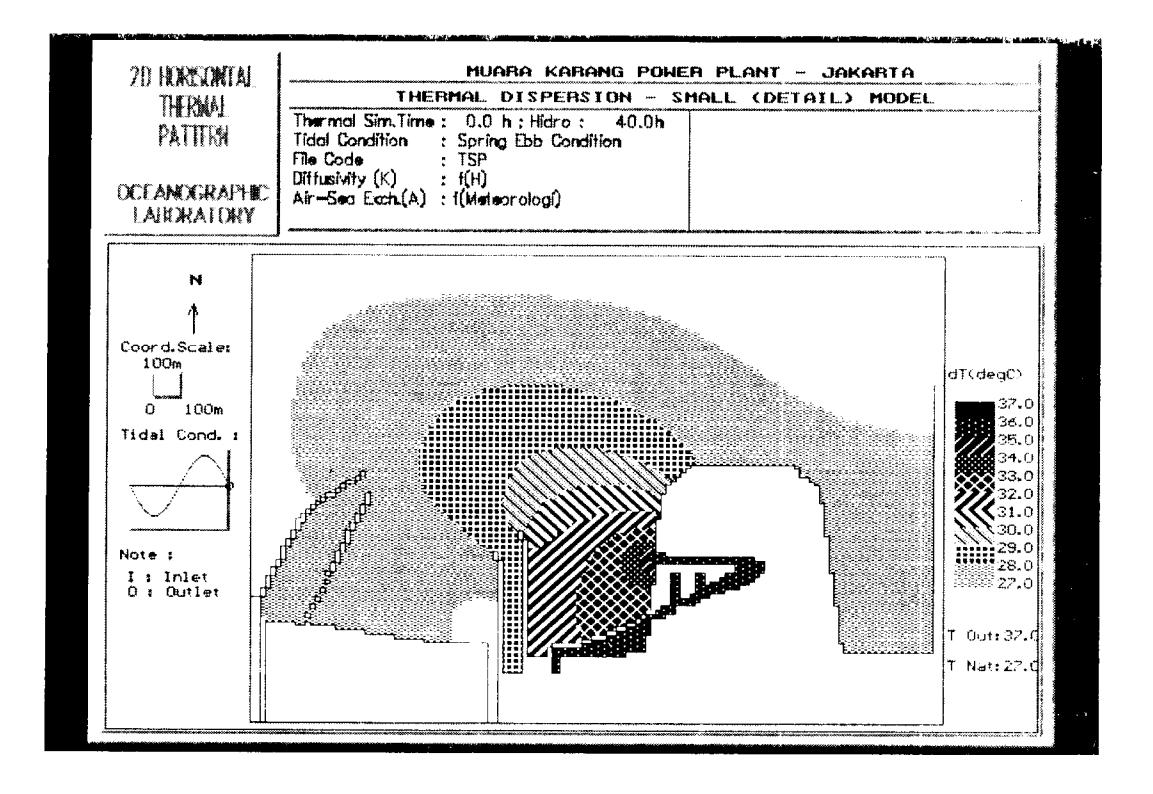
Figure 3.1.2 Thermal dispersion simulation when water level goes to Ebb Spring, in August 1994 (East wind season)
The thermal plume disperses in the "maximum dispersion area" (i.e. the area through which there is an increasing temperature, \(\Delta T\), more than 0.5°C) of 290.64 and 201.68 hectares when water level goes to ebb and to flood, respectively. When water level goes to flood until the highest water time, the plume weakly disperses due to the tidal waves influence on currents.
In our suggestion, there are two categories for the thermal dispersion area that significantly influence the environment, i.e. the area through which there is an increasing temperature (\(\Delta T\)) of:
- 1. more than 3°C, that is classified as "most significant", and
- 2. more than 2°C, that is classified as "significant".
The maximum "significant" and "most significant" dispersion areas are 71.72 and 50.24 hectares that occur at lowest water time, respectively. At the other tidal conditions (when water level goes to flood and ebb, as well as at the highest water) the two areas are 38.56-59.64 hectares and 31.80-42.88 hectares, respectively.
In general the isotherm pattern of the simulation results (see Figure 3.1.1 and Figure 3.1.2) is quite comparable to the observed data (see Figure 3.1.3 and Figure 3.1.4). The simulated temperature in the outlet canal is rather constant over the time, i.e. about 36°C, whereas in the contrary, the observed ones varied at 32.5°C–38°C but have an average of 34.3°C (see Figure 3.1.5 and Figure 3.1.6), while the model simulation in the inlet canal showed almost the same order with observation.
3.2.2 Simulation in the transitional Season of East-West Season
The thermal plume dispersion of the transitional season is represented by the simulation at November 1995 (see Figure 3.2.1 until Figure 3.2.4). From our observation on 8-10 November 1995, the natural temperature was 30.2°C (Mihardja, et al., 1996). The coastal morphology in the model had been changed due to the extension of the intake canal as far as 600 m and the reclamation of Pantai Mutiara Resort to the north direction. In all of the tidal conditions, the dominant dispersion is in the north direction as is confined by the two extensions as far as about 700–1300 meters.
In the simulations of maximum (worst) conditions, although it is more confined, the "maximum thermal dispersion areas" remain relatively large, i.e. 144.44 and 146.68 hectares at lowest water time and when the water level goes to flood, respectively. In other conditions, i.e. when water level goes to ebb and at the highest water time, the plume less disperses, i.e. 91.04 and 58.60 hectares, due to the influence of the tide on currents.
The "significant" and "most significant" dispersion areas do not vary substantially in all of the tidal conditions, i.e. 43.60–64.56 hectares and 29.00–60.76 hectares, respectively. These dispersion area are generally located in the "outlet pond" that is more confined by the extension of intake canal and Pantai Mutiara Resort.
3.2.3 Simulation in West Season
Thermal plume dispersion of the west season is represented by the simulation of January 1996 (see Figure 3.3.1 until Figure 3.3.4). The natural temperature in this season is about 28°C that is shown at our observation on 18–19 January 1996 (Mihardja, et al., 1996). The coastal morphology in the model had been changed due to the continuing reclamation of Pantai Mutiara Resort in the northern side.
In all of the tidal conditions, the dominant dispersion is also in north direction as far as about 1000 - 1450 meters since it is confined by the two extensions. Furthermore, the plume dispersion is directed to the east when the water goes to flood and at the highest water level.
Although it is more confined, the "maximum thermal dispersion areas" remains relatively large, i.e. 121.20–139.64 hectares at the lowest water time, when the water level goes to flood, and at the highest water time. When the water level goes to cbb the plume disperses as large as 93.12 hectares.
The "significant" and "most significant" dispersion areas also do not vary substantially in all of the tidal conditions, but relatively larger than the previous simulations, i.e. 57.92–96.36 hectares and 56.32–75.12 hectares, respectively. These dispersion areas are generally located in the "outlet pond".
Fig
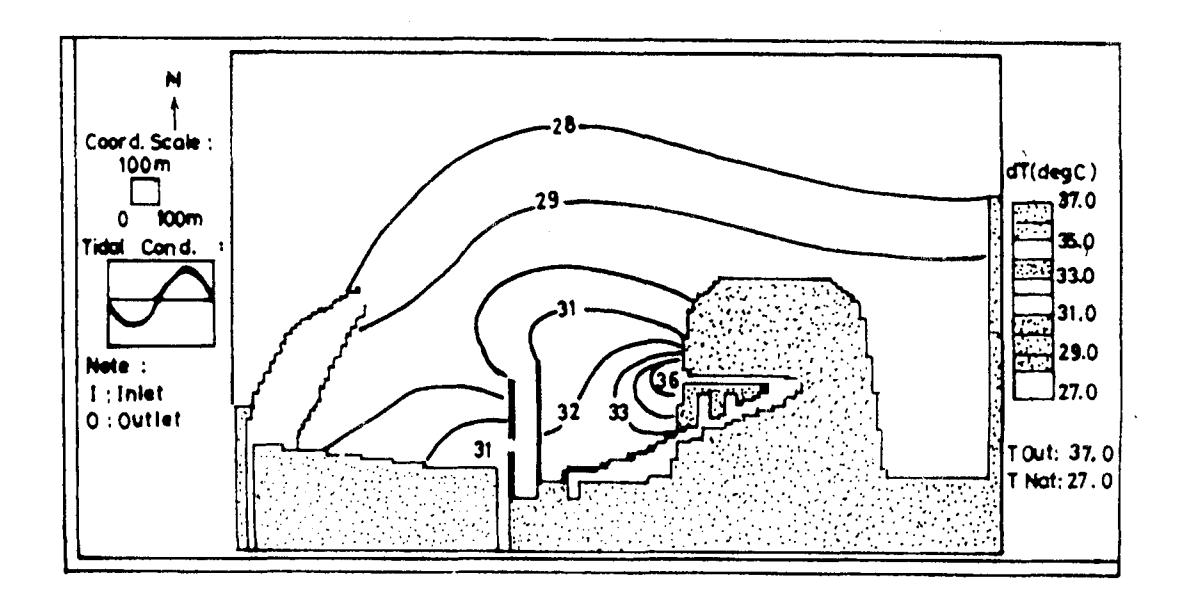
Figure 3.1.3 Isotherm pattern (deg-C) of observed data when water goes to flood spring in August 1994 (East wind season)
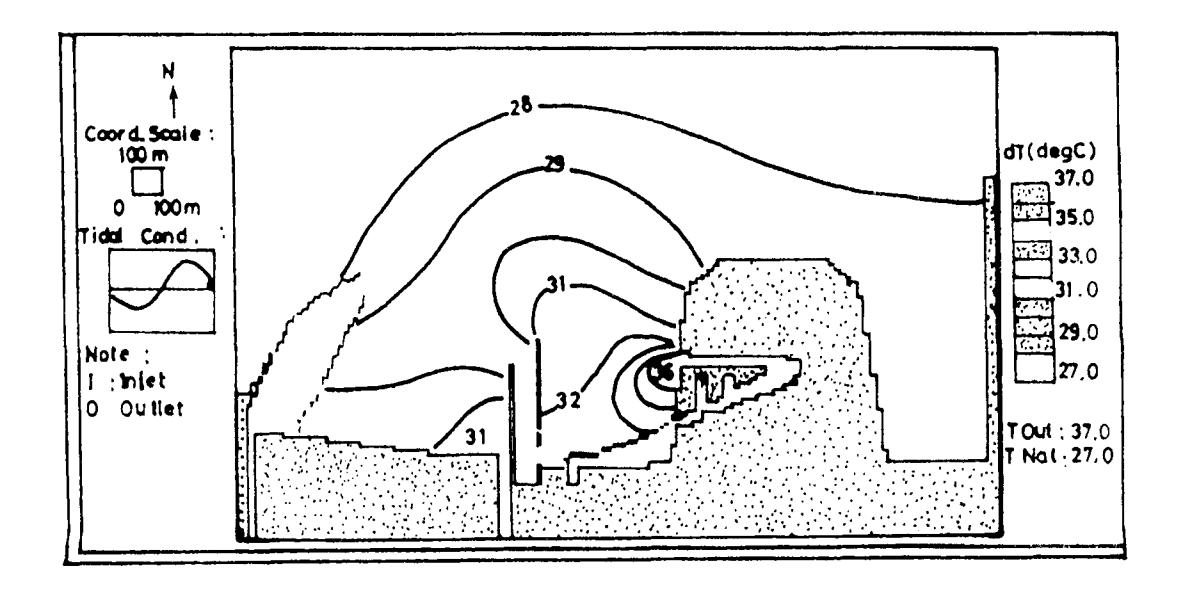
Figure 3.1.4 Isotherm pattern (deg-C) of observed data when water goes to ebb spring in August 1994 (East wind season)
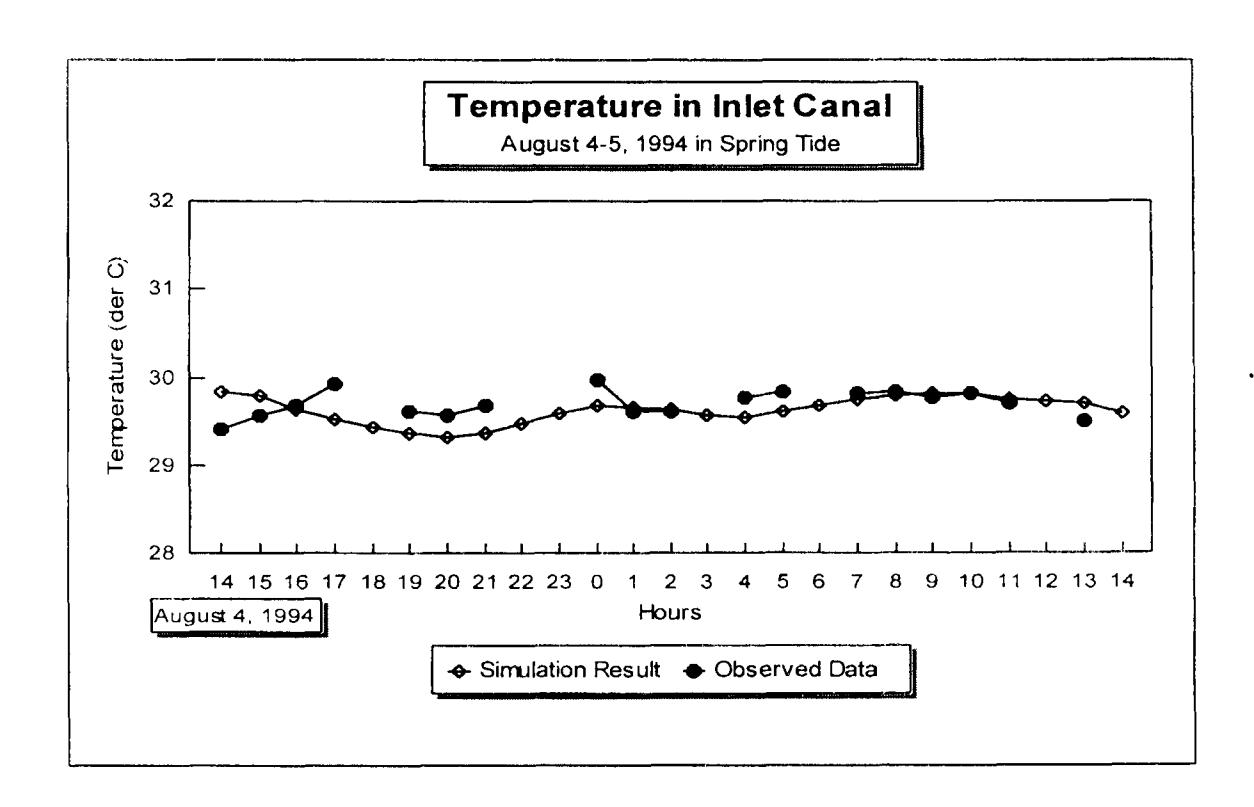
Figure 3.1.5 Comparison of simulation result and observed data temperature in inlet canal (In east wind season)
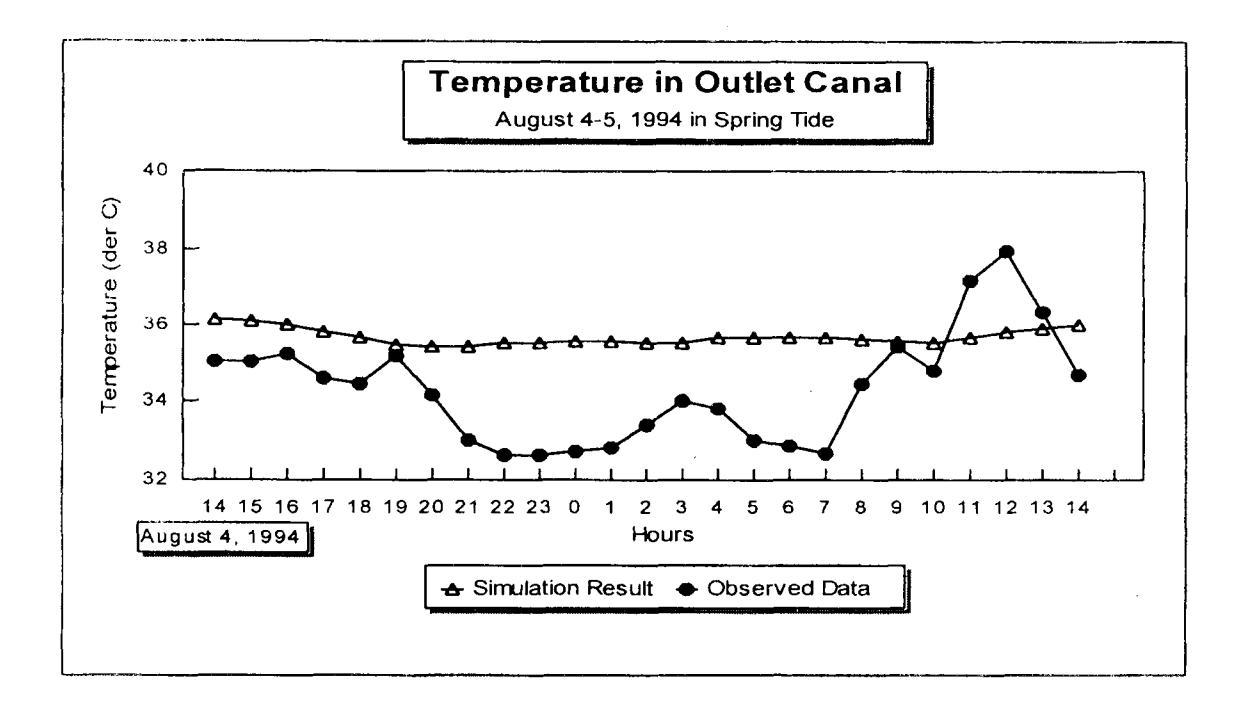
Figure 3.1.6 Comparison of simulation result and observed data temperature in outlet canal (In east wind season)
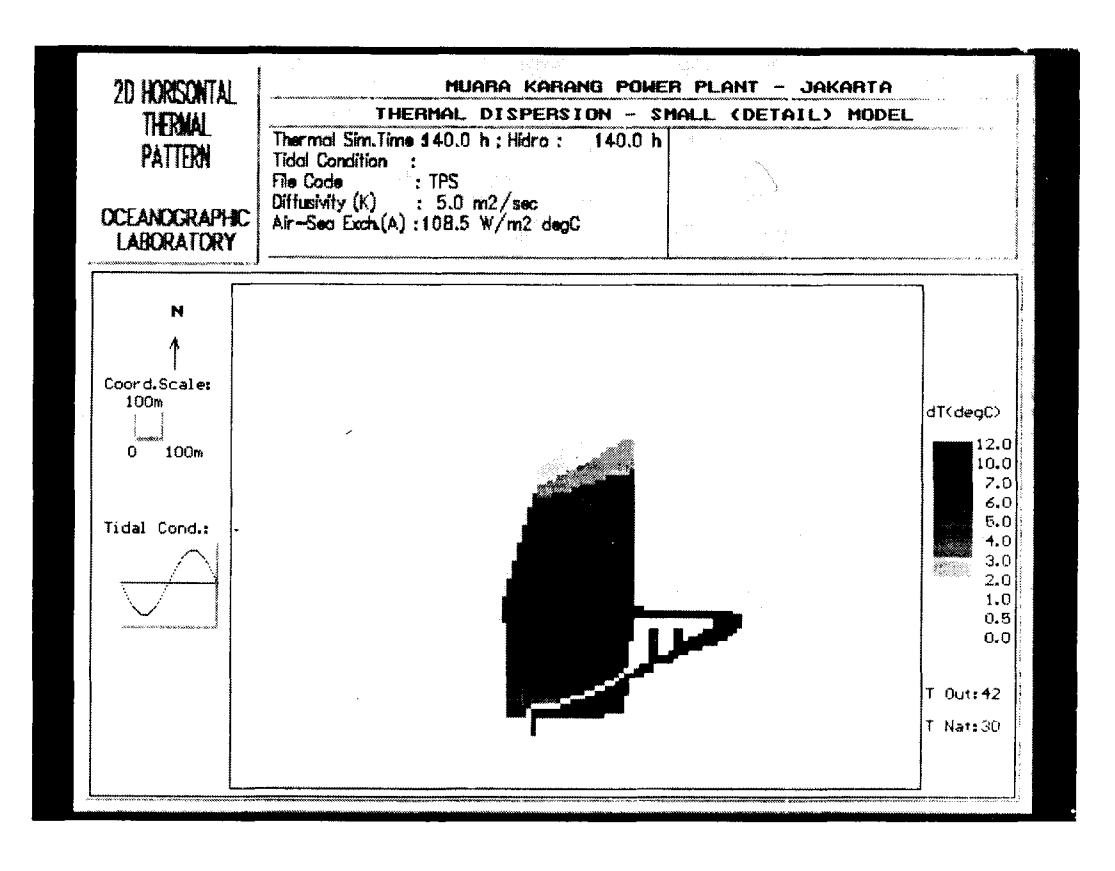
Figure 3.2.1 Thermal dispersion simulation when water level goes to Ebb Spring, in November 1995 (Transitional season)
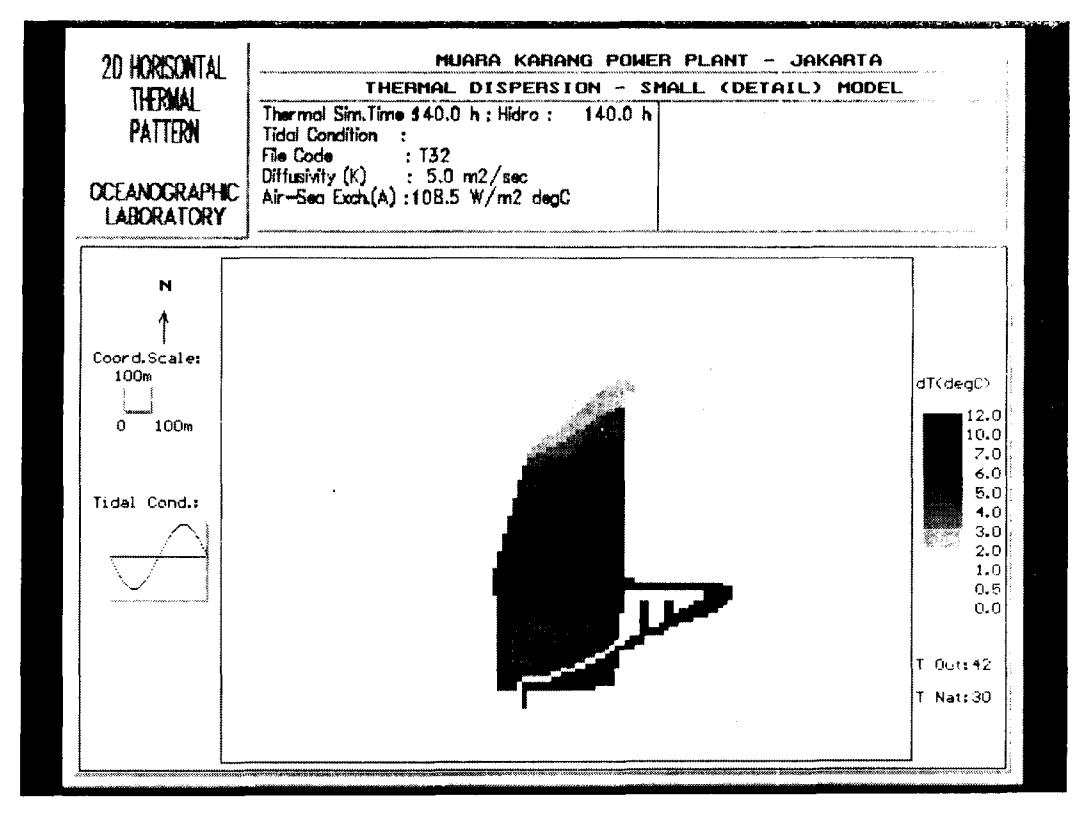
Figure 3.2.2 Thermal dispersion simulation at lowest water time spring, ir November 1995 (Transitional season)
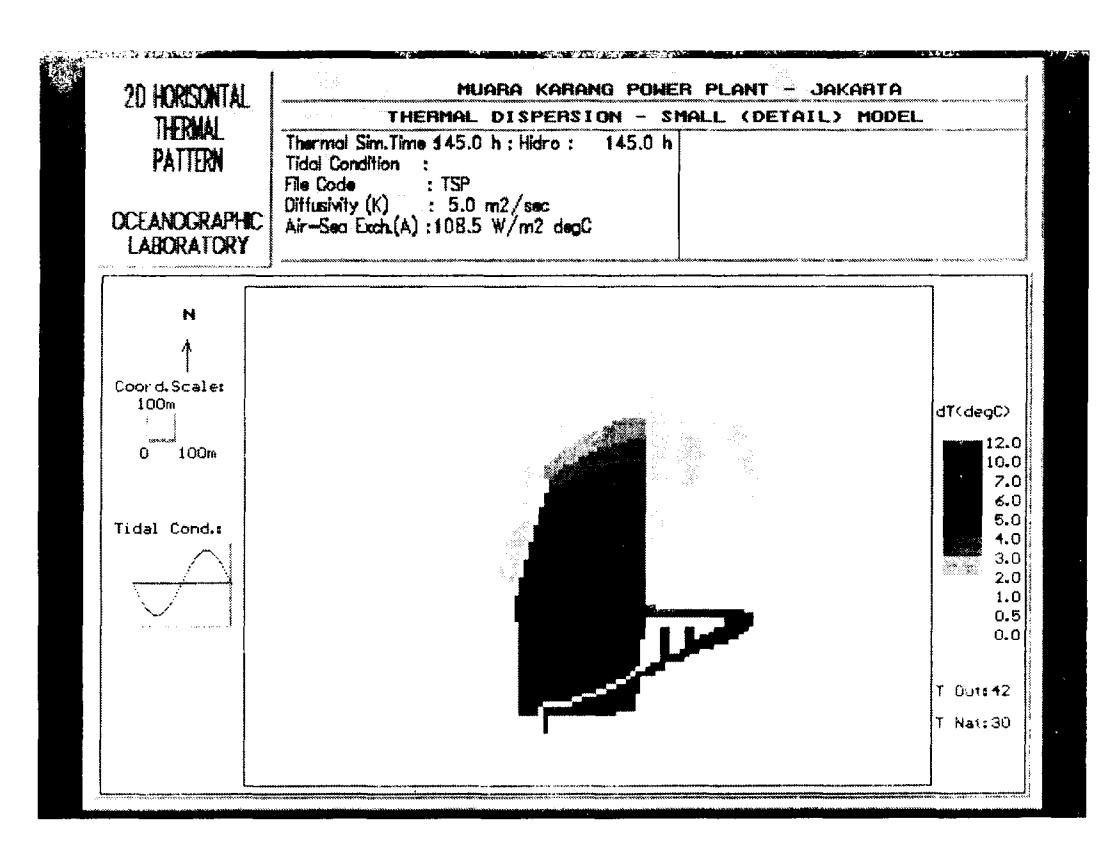
Figure 3.2.3 Thermal dispersion simulation when water level goes to flood spring, in November 1995 (Transitional season)
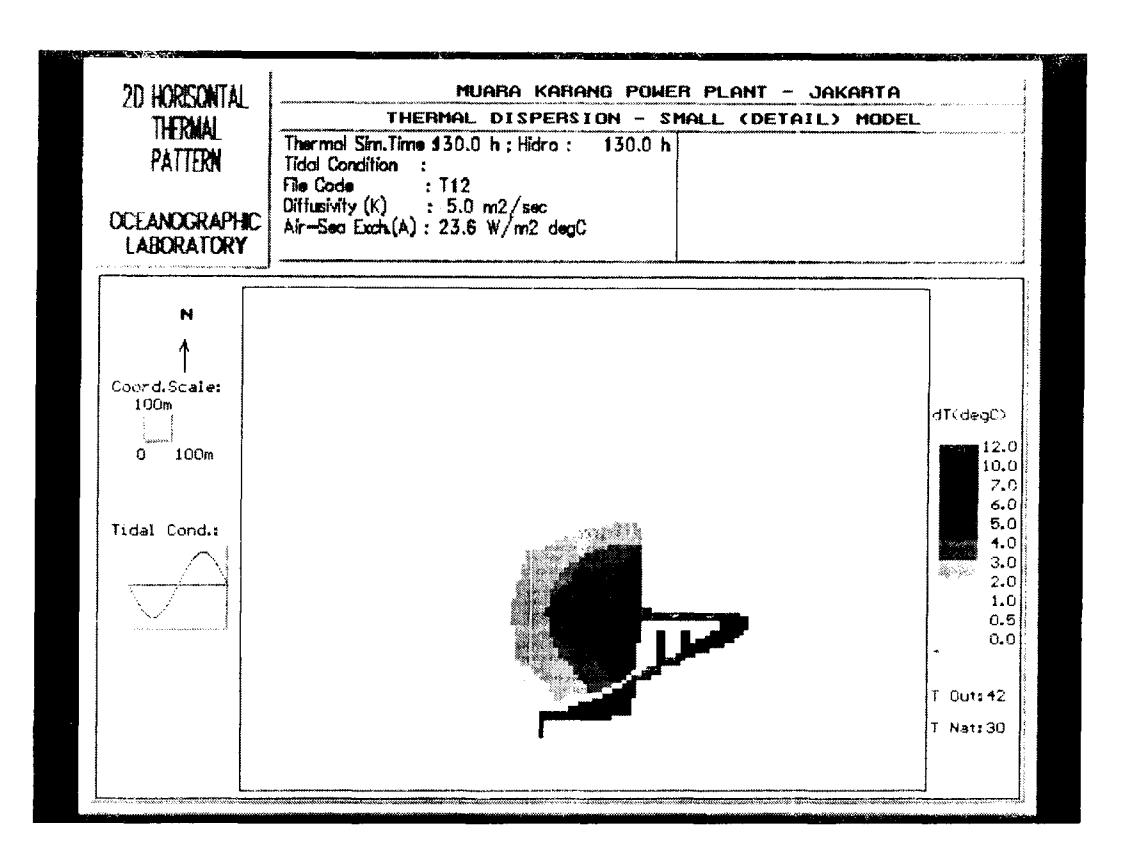
Figure 3 2.4 Thermal dispersion simulation at highest water time spring, in November 1995 (Transitional season)
Figure 3.
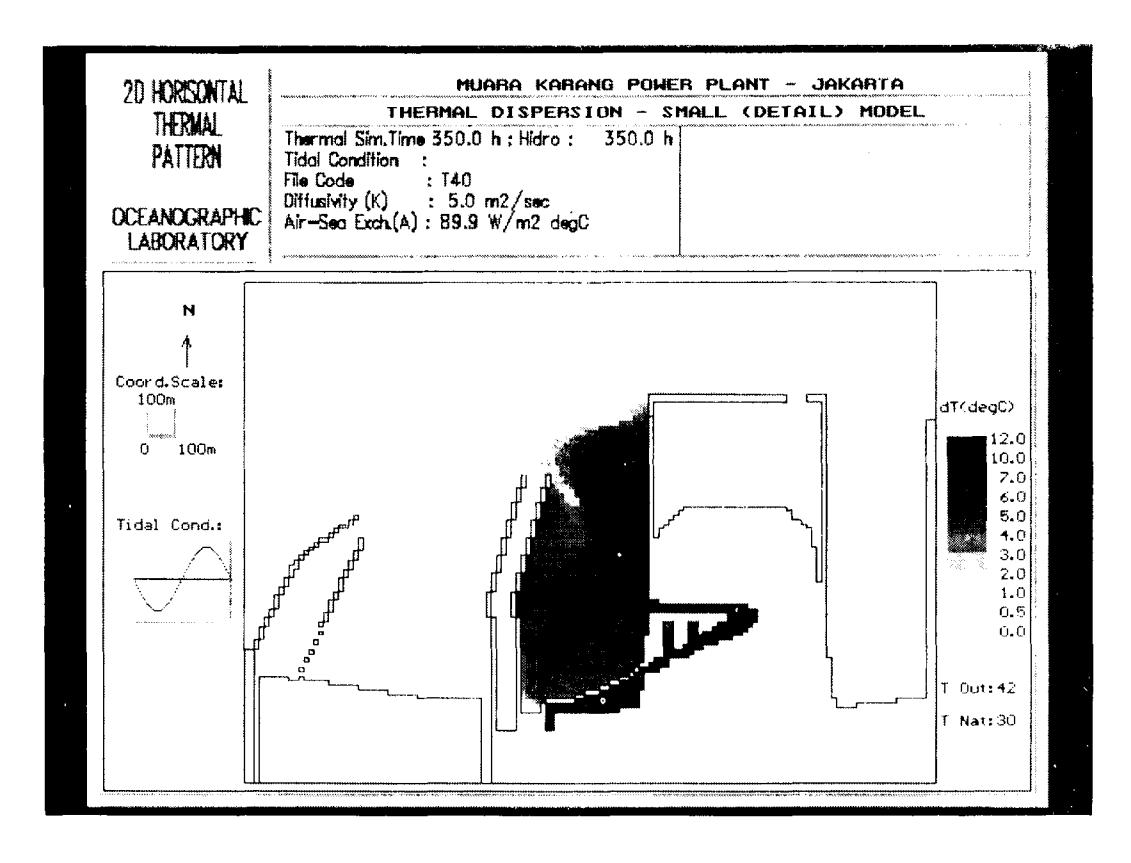
Figure 3.3.1 Thermal dispersion simulation when water level goes to ebb spring, in January 1996 (West wind season)
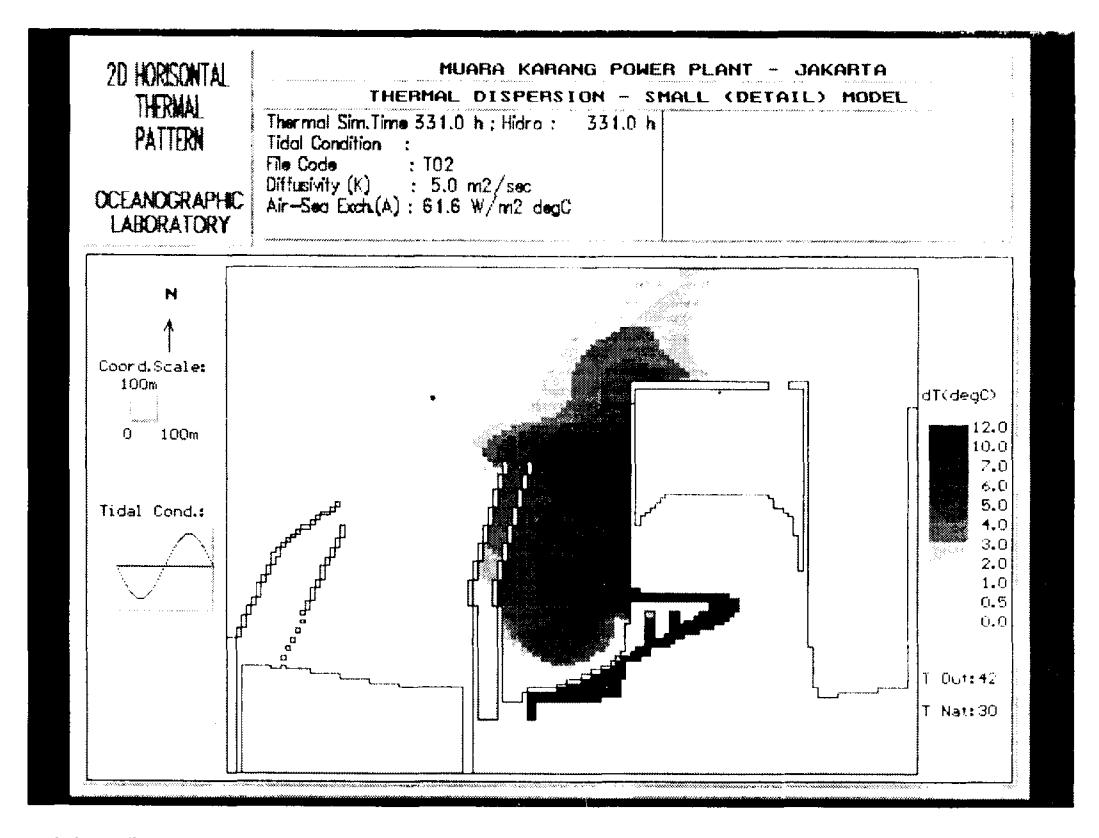
Figure 3.3.2 Thermal dispersion simulation at lowest water time spring, in January 1996 (West wind season)
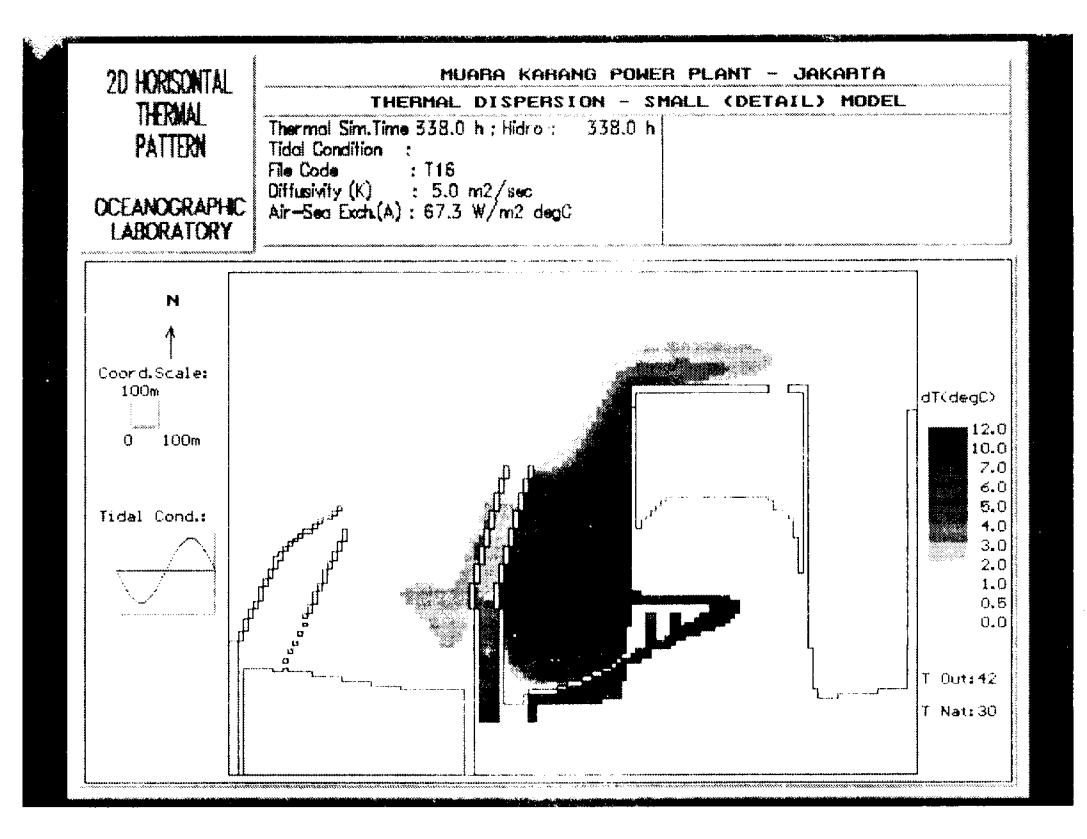
Figure 3.3.3 Thermal dispersion simulation when water level goes to flood spring, in January 1996 (West wind season)
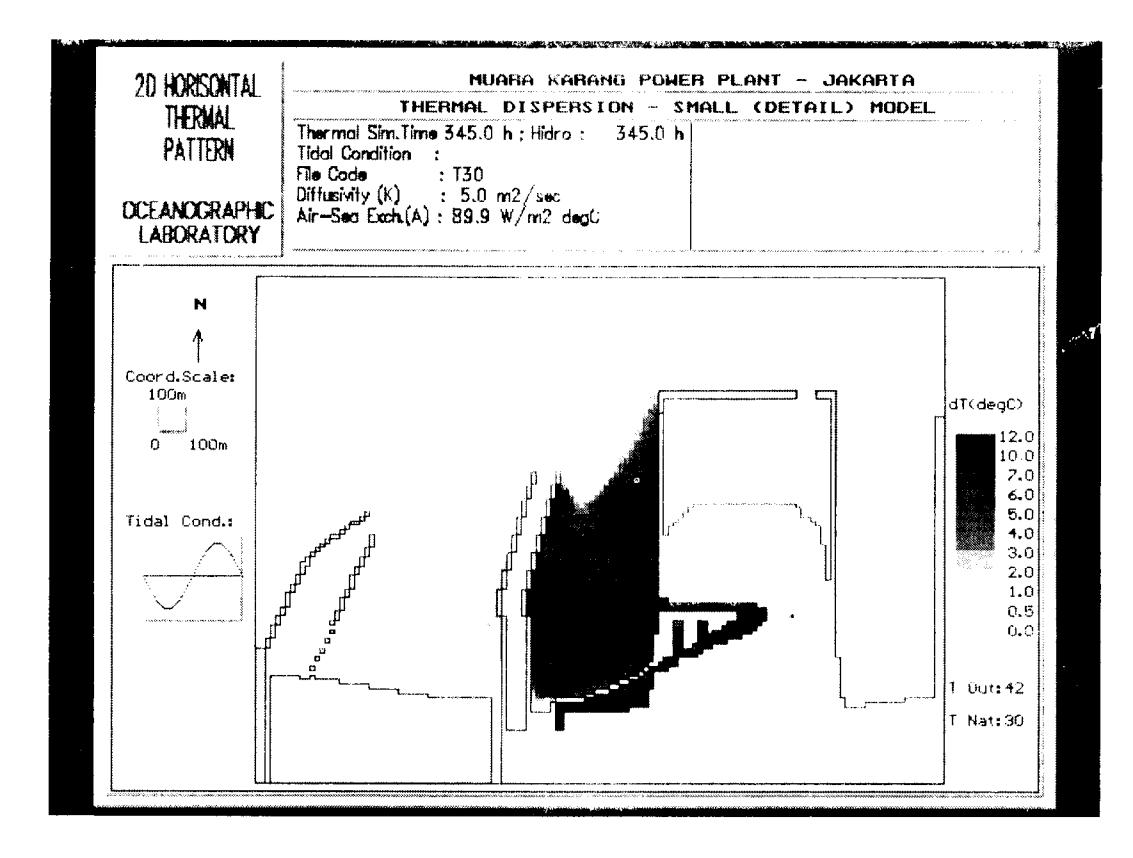
Figure 3.3.4 Thermal dispersion simulation at highest water time spring, in January 1996 (West wind season)
3.3
The above natura gener obser
35.0words temper The Seaso of the range avera ones. and loutle
The 12°C simu simu temp
Augu comp 34.5° 1995
1.6-: mode data
l.
2.
3.3 Discussions
The outlet temperature of the simulations mentioned above actually were not constant due to the variation of natural temperature and condition of electricity generation. The diurnal variation is shown on the observation of 18–19 January 1996 that is in a range of 35.0–42.2°C (with the average of 38.6°C). In other words, the average value means an increasing outlet temperature of 10.5°C from its natural temperature.
The simulated temperature of January 1996 (West Season) at a pier of outlet canal varies from 35.8°C to 40.3°C with the average of 38.5°C, while in the middle of the intake canal the simulated temperature is in a range of 29.5-35.5°C with an average of 31.5°C. These average results are about 2°C higher than the observed ones. The two previous simulations (i.e. August 1994 and November 1995) used the predicted value for the outlet temperature because there were no data available. The value was a maximum increasing temperature (i.e. 12°C) that was performed constantly along the simulation time. If the value is applied as is used in the simulation of January 1996 (i.e. 10.5°C), the temperature at the outlet canal would be 38.0°C on August 1994 and 40.5°C on November 1995. By comparing to the observed data (i.e. the average of 34.5°C in August 1994 and of 38.9°C in November 1995), it is shown that the simulation results are 1.6-3.5°C higher than the observed ones. Recently, this model is still being calibrated by putting the actual input data and adjusting some model parameters
4 Conclusions
- 1. The transport of the heated waters due to the operation of Muara Karang Power Plant is more induced by seasonal wind-generated current pattern rather than by the tidal current. This phenomena is shown by the heated water spreading that is dominantly in one direction for each season in all of the tidal conditions (i.e. to the west in the east season, to the north in the transitional season, and to the north-east in the west wind season).
- 2. The plume dispersion is also influenced by coastal morphology that has been changed due to the extension of the power plant intake canal and the reclamation of Pantai Mutiara Resort. Furthermore, the two extension confines the plume dispersion in the eastern and western side. But in many cases, the plume disperses in far field more extensively, especially in the west season (i.e. to the north-east as far as 1300-1450 meters from the mouth of the outlet canal).
- 3. The maximum plume dispersion varies in the range of 58.60 hectares (at the highest water level in transitional season) until 146.68 hectares (when the water level goes to flood in the transitional season) for the case after the intake and Pantai Mutiara extensions, or until 156.24 hectares (when the water level goes to ebb in the east wind season) for the case before the extensions.
- 4. The plume dispersion that significantly influences the environment is generally located in the "outlet pond", i.e. the area between Pantai Mutiara and the intake canal wall (see figure 2). The area covered by the increasing temperature of more than 2°C varies from 38.56 hectares (at the highest water level in the east season) to 96.36 hectares (at the lowest water level in the west season), while the area covered by the increasing temperature more than 3°C varies from 29.00 hectares (at the highest water level in the transitional season) to 75.12 hectares (at the lowest water level in the west season).
- 5. The simulation result in the east season is quite comparable to the observed data, while in the west and the transitional season the model is still being verified. The verification is done by putting some actual input data and adjusting some model parameters.
5 Acknowledgments
The authors would like to thank the National Research Council of Indonesia (i.e. Development Project on Integrated Researches) for sponsoring this research with the contract No. 051/SP-KD/PPIT/IV/94, 29 April 1994. A special thank to Mr. Totok Suprijo, Mrs. Puji Astuti, and Mrs. Ivonne M. Radjawane, M.Si, for their help in typing this paper and preparing some figures.
6 References
- Burhanuddin, Pengaruh Limbah Air Panas PLTU Muara Karang terhadap Komposisi Jenis, Toleransi, dan Kejerahan Pisces, Crustacea, dan Mollusca di Perairan Muara Karang, Teluk Jakarta., Dissertation, Bandung Institute of Technology (1989), 358 pages.
- 2. Caliyono, Two-Dimensional Depth-Integrated Numerical Modelling of Suspended Sediment Transport in Estuarine and Coastal Waters, Proc. ITB, 26, (1), 166-179, 1994, Supplemen.
- 3. Delft Hydraulic Laboratory (DHL) The Netherlands and Massachusetts Institute of Technology (MIT). European Course on Heat Disposal From Power
- Generation in The Water Environment., Delft June 23-27 1975, part 1 dan part 2.
- 4. Fisher, et.al., Mixing Inland and Coastal Waters., Academic Press, Orlando (1979), 483 pages.
- Leonard, B.P., A Stable and Accurate Convective Modelling Procedure Based on Quadratic Upstream Interpolation., Computer Methods in Applied Mechanics and Engineering, Vol.19, North-Holland Publishing Company, New York (1979), page: 59-98.
- Mahlan, M., Pengaruh Limbah Air Panas PLTU Muara Karang Terhadap Ikan dan Taritip di Pelimbahannya., Investigation Center of Electricity Problem, P.T. PLN (National Electricity Company) (1984),13 pages.
- Martono, A., Batasan Suhu Limbah Air Pendingin PLTU., Investigation Center of Electricity Problem, P.T. PLN (National Electricity Company) (1984), 11 pages.
- 8. Mihardja, D.K. et al, Pengkajian Sirkulasi Air Pendingin (Cooling Water) Pembangkit Listrik Tenaga Uap PLTU Muara Karang, Jakarta Utara, Research Report, Bandung Institute of Technology (1996), 365 pages.
- 9. Noye, J., Numerical Methods for Solving the Transport Equation in Noye, J., (ed.): "Numerical Modelling Application to Marine System", Elsevier Sciences Publ., (1987), page: 145-158.
- Sweers, H.E., A Nomogram to Estimate the Heat-Exchange Coefficient at the Air-Water Interface as A Function of Wind Speed and Temperature; A Critical Survey of Some Literature, J. Hydrol., 30, 375-401 (1976).
- 11. Thomann and Mueller, Principle of Surface Water Quality Modelling and Control., Harper & Rows Publisher, New York (1987), 644 pages.
Sar
-и
Sist bagi kon: Olel hasi laru
kart pasi Kata
vana
Ab
Cart attac abso inhil is ef pass benz benz
Key
Satu K<sub>2</sub>C yang pada men K<sub>2</sub>C
Lan bers kons rege
men
Fe+