
1 Introduction
The increased corrosion rate of carbon steel pipelines in gas and oilfields, induced by the presence of carbon dioxide and water has been a serious problem in the oil and gas industry for decades [1]. The maintenance of the pipelines is both extremely costly and labor intensive. One of the most effective ways to inhibit the corrosion, especially in the internal parts of carbon steel pipelines, caused by carbon dioxide and other acidic media, is the use of organic corrosion inhibitors [1, 2-6]. The common organic corrosion inhibitors that widely and commercially used to minimize the corrosion are imidazoline derivative compounds. According to some studies, the corrosion inhibition mechanism on metal surface by imidazoline derivative compounds comprises of three important parts in their structure, that are capable of interacting with the metal surface [5, 7-12]. The three important parts of imidazoline derivative compounds are: the 'head', the 'anchor' (or 'pendant'), and the 'tail' parts [5]. The 'head' part of imidazoline, which is the imidazoline ring framework, can be attached to the metal surface through the electron pair of nitrogen of imidazoline ring. The 'anchor' part is the alkylamine substituent of imidazoline ring that can maintain the adsorption of imidazoline ring on metal surface. The 'tail' part of imidazoline is the long hydrophobic alkyl chain present as one of substituent of imidazoline ring [5].
Microwave assisted organic synthesis is a novel synthesis method developed over the past decade [13, 14]. Many scientists working across an array of disciplines that have applied the rapid heating associated with microwave technology to a number of processes. These include the preparation of samples for analysis, application to waste treatment, polymer technology, drug release/targeting, decomposition processes, preparation of ceramics and hydrolysis of proteins and peptides [13-16]. This technology opens up new opportunities to the synthetic chemist, especially for reactions that are not possible using conventional heating, improved reaction yields, decreased reaction times and even solvent free reaction conditions [14-17]. It is likely that, with increased activities in this exciting area, widespread acceptance of this technology will result in the microwave oven becoming an integral part of every modern organic synthesis laboratory [13-16].
In Indonesia, the gas and oilfield mining is an important industry that gives valuable commodity and income to the nation. The development of improved organic corrosion inhibitors could be quite crucial in the cost-effectiveness of this crucial industry. The present work contributes to this quest, as well as to the most essential purpose in practicing scientific methodology. The aim of this work is to synthesize some imidazoline derivative compounds utilizing the novel method in organic synthesis, microwave assisted organic synthesis
(MAOS), and comparing the effectiveness of this method with conventional synthetic methods. A second aim of this work is to analyze the correlation between the structures of the synthesized products and their corrosion inhibition activities towards carbon steel in 1% NaCl solution utilizing the Tafel plot method.
2 Experimental
2.1 General Procedure
All of reagents used in this research are GR grade. All of solvents were distilled before use. The microwave assisted organic synthesis (MAOS) was performed using a GE domestic microwave oven type JEI642WC. The synthesized products was characterized using a Shimadzu FTIR at Chemistry Department ITB. Melting points were determined utilizing the Electrothermal® Melt-Temp Apparatus. The structure elucidation was determined utilizing JEOL DELTA NMR 400 MHz (<sup>1</sup>H-NMR) and 100 MHz (<sup>13</sup>C-NMR), using CDCl<sub>3</sub> as solvent, at Universiti Kebangsaan Malaysia and FU Berlin. The determination of inhibition activities of synthesized products employing VoltaLab® apparatus at Department of Chemistry ITB, with carbon steel electrode as working electrode, SCE (Saturated Calomel Electrode) as reference electrode, and platinum electrode as auxiliary electrode.
2.2 Synthesis of Imidazoline Derivative Compounds
A. Conventional (Reflux) Method
An amount of 50 mmol of Fatty acid (oleic acid for compound 1 and 2; stearic acid for compound 3) and 66.25 mmol of amine compounds (diethylenetriamine (DETA) for compound 1 and 3; aminoethylethanolamine (AEEA) for compound 2) were placed in a three neck round bottom flask. The flask system was evacuated and then the nitrogen gas was introduced into the flask at 1.3 psi to make the reaction under nitrogen atmosphere. The reaction mixture was stirred and slowly refluxed with the increasing temperature each step at temperature range from 100 °C until 230 °C for approximately 13 hours. The reaction was monitored by thin layer chromatography (TLC) using n-hexane/ethyl acetate 7: 3 as eluents. After completion, the reaction mixture was cooled to room temperature. Purification was carried out using column chromatography with n-hexane/ethyl acetate 7: 3 as eluents. The pure products were characterized using FTIR spectroscopy and NMR spectroscopy.
Compound 1a: \({}^{1}\)H-NMR 400 MHz JEOL DELTA (CDCl<sub>3</sub>): \(\delta\) 5.33 – 5.30 (m, 2H), 3.38 – 3.29 (dd J = 8 and 2 Hz, 4H), 2.74 – 2.71 (t, 2H), 2.67 (t, 1H), 2.55
(t, 1H), 2.18 – 2.14 (t, 2H), 1.99 – 1.96 (q, 4H), 1.59 (2H), 1.27 – 1.23 (m, 22H), 0.87 – 0.84 (t, 3H). 13C-NMR 100 MHz JEOL DELTA (CDCl3): δ 174.2, 130.0 (0), 129.9, 129.5, 52.2, 51.9, 51.7, 50.1, 50.9, 48.1, 46.4, 41.6, 41.4, 40.4, 37.9, 36.4, 32.5, 31.8, 31.7 (0), 29.7, 29.4, 29.3, 29.2, 29.1, 28.9, 27.1, 26.2, 25.6, 25.5, 22.6, 14.0
B. Microwave Assisted Organic Chemistry (MAOS) Method
An amount of 50 mmol of Fatty acid (oleic acid for compound 1 and 2; stearic acid for compound 3) and 66.25 mmol of amine compounds (diethylenetriamine (DETA) for compound 1 and 3; aminoethylethanolamine (AEEA) for compound 2) were placed in the 250 mL Erlenmeyer flask. The reaction mixture was placed in the GE domestic microwave oven and was radiated at 700 W powers for several minutes. The reaction was monitored by thin layer chromatography (TLC) using n-hexane/ethyl acetate 7 : 3 as eluents. After completion, the reaction mixture was cooled to room temperature. The purification was carried out using column chromatography with n-hexane/ethyl acetate 7 : 3 as eluents. The pure products were characterized using FTIR spectroscopy and NMR spectroscopy.
Compound 1b: 1 H-NMR 400 MHz JEOL DELTA (CDCl3): δ 5.33 – 5.30 (m, 2H), 3.38 – 3.29 (dd J = 8 and 2 Hz, 4H), 2.74 – 2.71 (t, 2H), 2.67 (t, 1H), 2.55 (t, 1H), 2.18 – 2.14 (t, 2H), 1.99 – 1.96 (q, 4H), 1.59 (2H), 1.27 – 1.23 (m, 22H), 0.87 – 0.84 (t, 3H). 13C-NMR 100 MHz JEOL DELTA (CDCl3): δ 174.2, 130.0 (0), 129.9, 129.5, 51.9, 50.1, 50.9, 48.1, 46.4, 41.6, 41.4, 40.4, 37.9, 36.4, 32.5, 31.8, 31.7 (0), 29.7, 29.4, 29.3, 29.2, 29.1, 28.9, 27.1, 26.2, 25.6, 25.5, 22.6, 14.0
Compound 2b: 1 H-NMR 400 MHz JEOL DELTA (CDCl3): δ 5.33 – 5.30 (m, 2H), 3.67 – 3.64 (t , 1H), 3.37 – 3.32 (q, 1H), 2.76 (t, 2H), 2.17 (t, 1H), 1.99 – 1.96 (q, 4H), 1.59 (2H), 1.27 – 1.23 (m, 20H), 0.87 – 0.84 (t, 3H). 13C-NMR 100 MHz JEOL DELTA (CDCl3): δ 173.6, 129.9, 129.7, 60.9, 50.9, 48.6, 39.1, 31.8, 29.7, 29.6, 29.5, 29.3, 27.2, 29.1, 22.6, 14.1
Compound 3b: 1 H-NMR 400 MHz JEOL DELTA (CDCl3): δ 3.33 (m, 2H), 2.81 – 2.71 (m, 4H), 2.16 (t, 2H), 1.59 (q, 4H), 1.26 – 1.23 (m, 30H), 0.86 (t, 3H). 13C-NMR 100 MHz JEOL DELTA (CDCl3): δ 173.8, 48.5, 39.0, 36.7, 31.8, 29.7, 29.6, 29.5, 29.3, 25.8, 22.6, 14.1
2.3 The Determination of Corrosion Inhibition Activity
Appropriate amounts of the products were dissolved in 250 mL 1% (w/v) NaCl solution, to give several of concentration (in ppm) of sample solutions. The 1%
NaCl solution was also used as blank solution in each measurement. Into the 400 mL beaker glass equiped with magnetic stirrer was introduced 250 mL of blank solution. The working electrode (carbon steel), the reference electrode (SCE), and auxiliary electrode (platinum electrode) were immersed into the solution. Carbon dioxide gas was introduced into the electrolyte solution until saturation was reached. The measurement, utilizing Voltalab® and Tafel Method software program, was continued until the curve of potential measurement was constant. The measurements of each electrolyte solution should be initiated by the measurement of blank solution. The inhibition activity can be calculated using following equation [6-9]:
% inhibition = \[\frac{\text{Blank Corrotion Rate (mm/Y) - Sample Corrosion Rate (mm/Y)}}{\text{Blank Corrosion Rate (mm/Y)}} \times 100\%\] (1)
or
% inhibition = \[\frac{I_{\text{Blank}} \text{ (mA/cm}^{2}) - I_{\text{Sample}} \text{ (mA/cm}^{2})}{I_{\text{Blank}} \text{ (mA/cm}^{2})} \times 100\%\] (2)
3 Results and Discussion
The results of the synthesis of imidazoline derivative compounds were presented in Table 1. We can derive from Table 1 that the microwave assisted organic synthesis (MAOS) method (note the experiments 1b, 2b and 3b) resulted in higher chemical yields of the synthesized products with shorter reaction time than the conventional (reflux) method (note the experiments 1a, 2a and 3a). The MAOS method is based on the efficient heating of materials by "microwave dielectric heating" effects [11], that is dependent on the ability of a specific material (solvent or reagent) to absorb microwave energy and convert it into heat. The irradiation of the sample at microwave frequencies results in the dipoles or ions aligning in the applied electric field [11-15]. As the applied field oscillates, the dipole or ion field attempts to realign itself with the alternating electric field and, in the process, energy is lost in the form of heat through molecular friction and dielectric loss. The amount of heat generated by this process is directly related to the ability of the matrix to align itself with the frequency of the applied field (11-13). These principles explain the results shown in Table 1 as well as the diagrams shown in Figure 1.
Table 1 The data of synthesized products of imidazoline derivatives utilizing conventional method and MAOS method. The microwave method at 700 W powers showed higher percentage of chemical yields and shorter reaction time than the conventional (reflux) method.
\[R^{1} \xrightarrow{OH} + H_{2}N \xrightarrow{K} X = -NH_{2} \text{ or -OH}\] \[R^{2} \xrightarrow{\text{Reaction Method}} X = -NH_{2} \text{ or -OH}\] \[A \text{ mine}\] \[66.25 \text{ mmol}\] \[R^{1}\]
| Experiment | Fatty Acid | Amine | -R1 | -R2 | Reaction Method | Reaction Time (minutes) | reaction (°C) | Melting Point (°C) | Yield (%) |
|---|---|---|---|---|---|---|---|---|---|
| 1a | Oleic Acid | DETA | heptadec-8-enyl | \(-C_2H_5NH_2\) | ] | 760 | 230 | - | 92.37 |
| 2a | Oleic Acid | AEEA | heptadec-8-enyl | \(-C_2H_5OH\) | Refluks | 780 | 230 | - | 91.42 |
| 3a | Stearic Acid | DETA | heptadecyl | \(-C_2H_5NH_2\) | J | 720 | 210 | 79-85 | 89.15 |
| 1b | Oleic Acid | DETA | heptadec-8-enyl | \(-C_2H_5NH_2\) | MW, | 7 | 210 | - | 94.24 |
| 2b | Oleic Acid | AEEA | heptadec-8-enyl | -C2H5OH | 700 W | 10 | 210 | - | 93.04 |
| 3b | Stearic Acid | DETA | heptadecyl | \(-C_2H_5NH_2\) | J | 10 | 213 | 81-85 | 91.23 |
Note: AEEA = AminoEthylEthanolAmine (if X = -OH) DETA = DiEthyleneTriAmine (if X = -NH<sub>2</sub>)
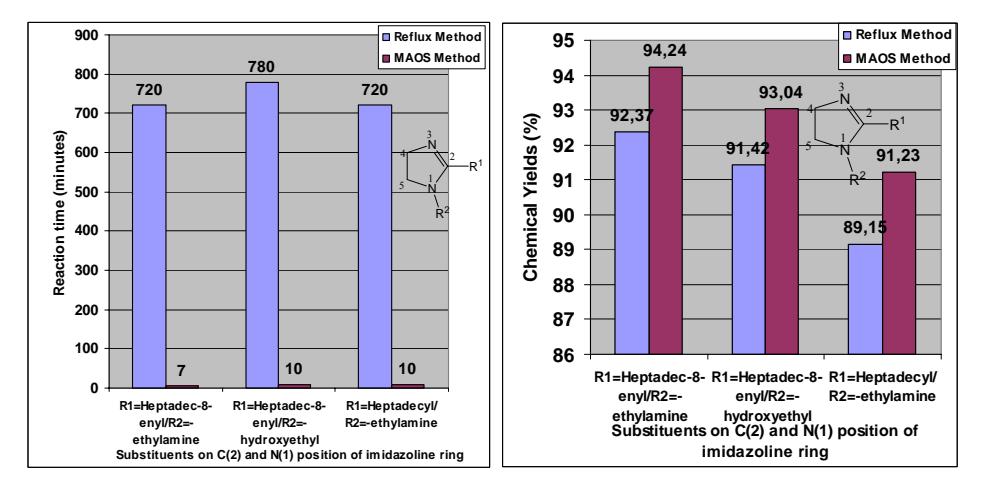
Figure 1 The relationship between the reaction time and the method used (figure on the left side) and the relationship between chemical yields and the method used (figure on the right side) in synthesizing imidazoline derivative compounds.
The structure of the synthesized products was analyzed by IR and NMR spectroscopies. The NMR data was presented in the 'Experimental' section. The IR data is presented on Table 2.
Table 2 The infra red spectra data of synthesized products of imidazoline derivative compounds. The values inside the brackets ([]) represent the IR data for experiments 1b, 2b and 3b.
| Sample | Wavenumbers (cm-1) | Type of vibration |
|---|---|---|
| 3306 [3308] | \(NH_2\), \(NH_3^+\) |
| and 1b (product | 2920 [2922], 2847 [2848] | Alkyl, ethylene |
| of experiment | 1647 [1649], 1607 [1607] | C=N, N=C-N |
| 1a and 1b) | 1554 [1554], 1455 [1454], 1360 [1360] | C-N-C |
| 1270 [1272], 1064 [1065] | C-NH | |
| 1007 [1008], 966 [967], 721 [722] | Alkyl | |
| 2. Compound 2a | 2999 – 3250 [3000 – 3250] | \(OH, NH_2, NH_3^+\) |
| and 2b (product | 2930 [2931], 2847 [2848] | Alkyl, ethylene |
| of experiment | 1649 [1649], 1604 [1605] | C=N, N=C-N |
| 2a and 2b) | 1554 [1554], 1453 [1454], 1359 [1360] | C-N-C |
| 1253 [1254], 1114 [1114], 1089 [1090] | C-N | |
| 1007 [1008], 966 [967], 721 [720], 596 | Alkyl | |
| [596] | ||
| 3. Compound 3a | 3306 [3308] | \(NH_2\), \(NH_3^+\) |
| and 3b (product | 2699 – 2900 [2700 – 2900] | Alkyl |
| of experiment | 1649 [1649], 1605 [1607] | C=N, |
| 3a and 3b) | 1553 [1554], 1453 [1454], 1359 [1360] | C-N-C |
| 1271 [1272], 1063 [1065] | C-N | |
| 1007 [1008], 966 [967], 722 [722] | Alkyl |
Based on the IR spectra data in Table 2, we confirmed that compound 1a is the same as 1b, compound 2a is equal to 2b, and compound 3a is the same as 3b. That samples 1a and 1b are the same compound is verified by comparison of their NMR spectra data (see 'Experimental' section). The chemical shifts of <sup>1</sup>H-NMR and <sup>13</sup>C-NMR of both compounds are similar and correlated to each other. The structure of compound 1b and 2b were further confirmed by the HMBC (Heteronuclear Multiple Bond Correlation) and HMOC (Heteronuclear Multiple Quantum Coherence) spectra data. The IR spectra of compound 1b, 2b and 3b showed the characteristic peaks of the imidazoline ring with wavenumbers of 1649 cm<sup>-1</sup> for stretching vibration of C=N, 1607 cm<sup>-1</sup> for stretching vibration of N=C-C and 1554, 1454 and 1360 cm<sup>-1</sup> for stretching vibration of C-N-C. The ethylene and alkyl groups of compound 1b and 2b were shown on 2848 cm<sup>-1</sup>, 2922 cm<sup>-1</sup> (for -CH- vibration of compound 1b) and 2931 (for -CH- vibration of compound 2b). The alkyl groups of compound 3b were shown on the wavenumbers of 2700 – 2900 cm<sup>-1</sup>. The hydroxyl group of compound 2b was shown at wavenumber of 3000 cm<sup>-1</sup>; meanwhile the amine groups of compound 1b and 3b were shown at wavenumer 3308 cm<sup>-1</sup>. In summary, the structures of the synthesized imidazoline derivative compounds were confirmed and, based on those structures, we can derive the IUPAC name for each compound as follows: (Z)-2-(2-(heptadec-8-enyl)-4,5-dihydroimidazol-1-yl)ethanamine (compound 1a and 1b), (Z)-2-(2-(heptadec-8-enyl)-4,5-dihydroimidazol-1-yl)ethanol (compound 2a and 2b) and 2-(2-heptadecyl-4,5-dihydroimidazol-1-yl)ethanamine (compound 3a and 3b). The structure of each compound is presented in Figure 2. The difference between compound 1b and 2b is the substituent on N(1) position of imidazoline ring; the hydroxyethyl group was attached to N(1) in compound 1b while aminoethyl substituent was attached to N(1) in compound 2b. In compound 3b, the heptadecyl group was attached to C(2) position of imidazoline ring instead of heptadec-8-enyl group that was attached to C(2) of compound 1b and 2b.
\[\begin{array}{c} 4 & 5 \\ 3 & N & N \\ N & 1 \\ 1 & 5 \\ 2 & N \\ \end{array}\] \(\begin{array}{c} 3 & 4 \\ N & 1 \\ 2 & N \\ \end{array}\) \(\begin{array}{c} 3 & 4 \\ N & 1 \\ 2 & N \\ \end{array}\) \(\begin{array}{c} NH_2 \\ NH_2 \\ \end{array}\) Compound 1 (1a and 1b) Compound 2b Compound 3b
Figure 2 The Structure of compound 1 (1a and 1b), 2b and 3b based on the <sup>1</sup>H-NMR and <sup>13</sup>C-NMR spectroscopies data.
The investigation of the corrosion inhibition activities of compound 1b, 2b and 3b towards carbon steel in 1% NaCl solution were determined utilizing the Tafel plot method. The results were represented on Table 3 and Figure 3.
| Table 3 | The | corrosion | inhibition | activities | of | compound | 1b, | 2b | and | 3b |
|---|---|---|---|---|---|---|---|---|---|---|
| utilizing | Tafel | plot metho | d at 8 ppm | concentrat | ion | in 1% NaCl | solu | tion |
| Sample | I corr of NaCl 1% (mA/cm2) | I corr of Sample (mA/cm2) | Corrosion Rate of NaCl 1% (mm/year) | Corrosion Rate of Sample (mm/year) | % Efficiency Inhibition |
|---|---|---|---|---|---|
| 1b | 0.1768 | 0.1199 | 2.068 | 1.402 | 32.18 |
| 2b | 0.1768 | 0.1068 | 2.068 | 1.249 | 39.59 |
| 3b | 0.1768 | 0.1543 | 2.068 | 1.805 | 12.73 |
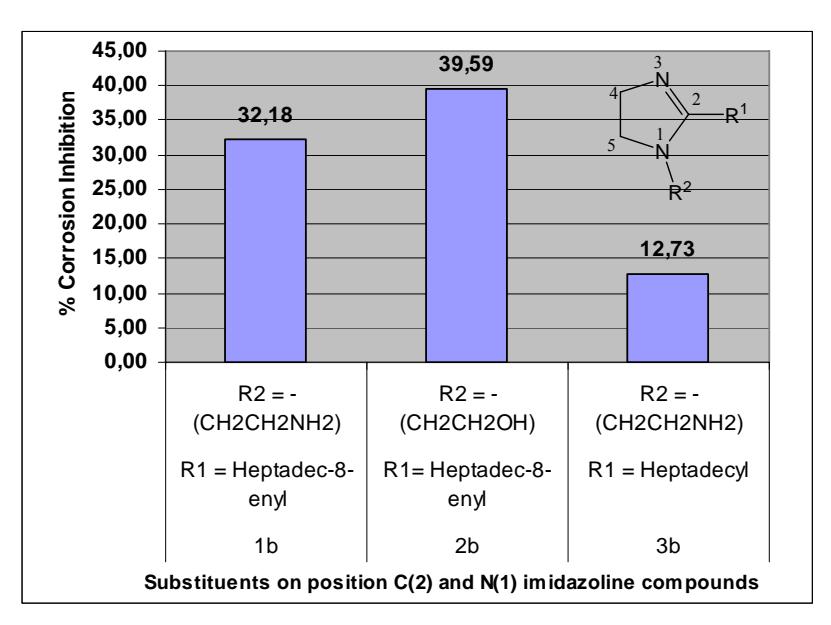
Figure 3 The relationship between corrosion inhibition activities and the structure of imidazoline derivative compounds.
Table 3 and Figure 3 show the relationship between the structure of compounds 1b, 2b and 3b, and their corrosion inhibition activities toward carbon steel at 8 ppm concentration in 1% NaCl solution. The heptadec-8-enyl substituent on C(2) position of imidazoline ring as present in compounds 1b and 2b showed higher corrosion inhibition activity than the heptadecyl substituent on C(2) of compound 3b. The phi (π) electron of the ethylene groups of heptadec-8-enyl substituents are thought to play an important role in the adsorption of compounds 1b and 2b on the metal surface, in addition to the lone pair of electrons on the nitrogen of the imidazoline compounds. Furthermore, the long straight chain of heptadecyl group in compound 3b gives steric hindrance to make the adsorption process of this compound on the metal surface became less effective. The hydroxyethyl group on position N(1) of 2-heptadec-8 enylimidazoline derivative compounds gave higher corrosion inhibition activity than the ethylamine (aminoethyl) group substituted on the same position. The hydroxyethyl substituent on N(1) position of imidazoline ring in compound 2b apparently has a synergic effect on the effectiveness of adsorption process on metal surface relative to the ethylamine substitute on N(1) position of compound 1b and 3b. The oxygen atom of the hydroxyethyl group has a higher electronegativity than the nitrogen atom of the ethylamine group, therefore the affinity of the –OH group towards electrons in the 3d orbitals of the transition metal is higher than the –NH2 group. In conclusion, the heptadec-8-enyl substituent on C(2) and the hydroxyethyl substituent on N(1) of imidazoline
ring gave a synergistic effect on the adsorption process on the metal surface its corrosion inhibition activity.
Table 4 The corrosion inhibition activities (%EI = Efficiency Inhibition of corrosion rate) and the degree of surface coverage, \(\theta\), of compound 1b, 2b and 3b at various concentrations in 1% NaCl solution at 27 °C.
| Sample | \[\begin{array}{c} Concentration \; (C_{inh}) \; in \; NaCl \\ 1\% \; solution \; (ppm) \end{array}\] | % EI | θ | Cinh/θ |
|---|---|---|---|---|
| 8 | 32.18 | 0.32 | 24.86 | |
| 16 | 44.91 | 0.45 | 35.63 | |
| 32 | 48.07 | 0.48 | 66.57 | |
| 1b | 64 | 51.33 | 0.51 | 124.68 |
| 80 | 52.99 | 0.53 | 150.97 | |
| 108 | 58.81 | 0.59 | 183.64 | |
| 120 | 64.12 | 0.64 | 187.15 | |
| 8 | 39.59 | 0.40 | 20.21 | |
| 26 | 16 | 49.21 | 0.49 | 32.51 |
| 2b | 32 | 52.02 | 0.52 | 61.51 |
| 64 | 55.27 | 0.55 | 115.80 | |
| 8 | 12.73 | 0.13 | 62.84 | |
| 3b | 16 | 23.87 | 0.24 | 67.03 |
| 30 | 32 | 30.12 | 0.30 | 106.24 |
| 64 | 21.26 | 0.21 | 301.03 |
In order to investigate the concentration effect towards the corrosion inhibition activities, the corrosion inhibition activities of compound \({\bf 1b}\), \({\bf 2b}\) and \({\bf 3b}\) were measured under different concentrations. Table 4 and Figure 4 represent the corrosion inhibition activities data of compound \({\bf 1b}\), \({\bf 2b}\) and \({\bf 3b}\) at various concentrations. The analysis of adsorption mechanism of imidazoline derivative compounds towards carbon steel can be derived by the determination of the degree of surface coverage (\(\theta\)) according to the following equation [7-9],
\[\theta = 1 - \left(\frac{I_{inh}}{I_{uninh}}\right) \tag{3}\] with \(I_{inh}\) and \(I_{uninh}\) is the corrosion current density (in mA/cm<sup>2</sup>) of sample solution with and without inhibitor, respectively. The data of the degree of surface coverage, \(\theta\), at various concentrations of compound 1b, 2b and 3b at 27 \(^{\circ}\)C was also presented on Table 4.
Based on Table 4, the most suitable relationship between the concentration of corrosion inhibitor compounds, \(C_{inh}\), and the degree of surface coverage, \(\theta\), is the Langmuir isotherm adsorption. In the simplest form this has a linear relationship between \(C_{inh}\) and \(C_{inh'}\theta\), according to the following equation [7-9],
\[\theta = \frac{bC_{inh}}{1 + bC_{inh}} \tag{4}\] where b is the adsorption coefficient; \(C_{inh}\) is the concentration of corrosion inhibitor compounds and \(\theta\) is the degree of surface coverage.
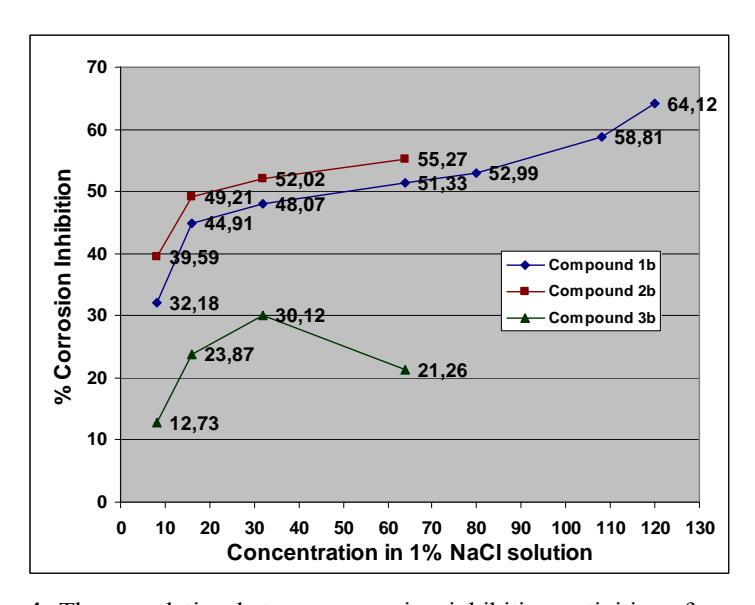
Figure 4 The correlation between corrosion inhibition activities of compound 1b, 2b and 3b and their concentrations in 1% NaCl solution.
Figure 5 illustrates the linear relationship, according to Langmuir adsorption isotherm, for compounds 1b, 2b and 3b. The value of b, the adsorption coefficient, which is equal to adsorption equilibrium constant (\(K_{ads}\)), for each compound is presented in Table 5. The value of adsorption Gibbs free energy (\(\Delta G_{ads}^0\), in kJ/mol) for each compound, is also presented on Table 5, and can be determined using the following equation [6-8].
\[K_{ads} = \frac{1}{55} \exp\left(-\frac{\Delta G_{ads}^0}{RT}\right) \tag{5}\] with R = ideal gas constant = 8.314 J/mol.K and T is temperature in K.
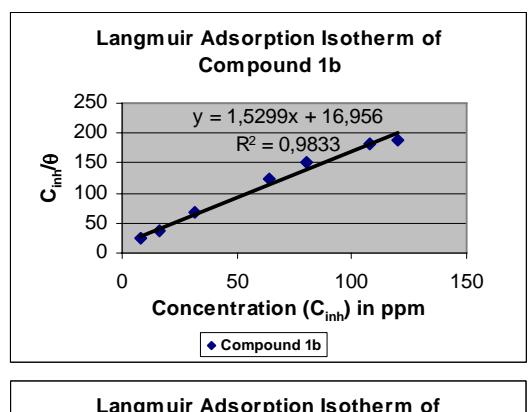
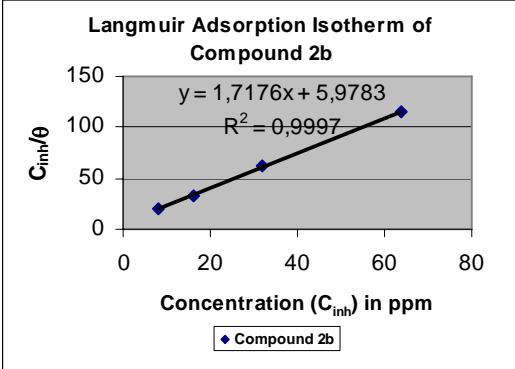
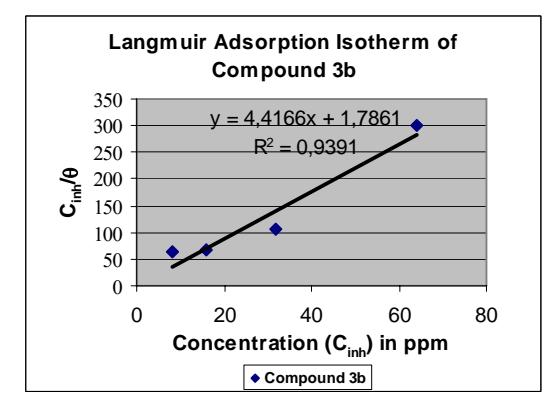
Figure 5 The linear relationship between concentration of corrosion inhibitor compounds, \(C_{inh}\), and \(C_{inh}/\theta\), according to Langmuir adsorption isotherm of compound 1b, 2b and 3b.
Table 5 The adsorption coefficient values (b, in \(M^{-1}\)) and the free Gibbs adsorption energy (\(\Delta G^0_{ads}\), in kJ/mol) of compound 1b, 2b and 3b at 27°C (300K)
| Compound | b (M-1) | \(\Delta G^0_{ads}\), (kJ/mol) |
|---|---|---|
| 1b | 9909.93 | -32.97 |
| 2b | 17148.90 | -34.34 |
| 3b | 5018.99 | -31.27 |
We can derive from Table 4 and Figure 4 that the increase in concentration of compounds 1b, 2b or 3b would increase their corrosion inhibition activities. The higher concentration of corrosion inhibitor the more effective their adsorption and coverage on the metal surface, therefore the interaction between the underlying metal and their corrosive surroundings would be hindered more effectively. However, in the case of compound 3b, when the concentration increased from 32 ppm to 64 ppm, there is significant decrease in its corrosion inhibition activity from 30.12% to 21.26%. This phenomenon was caused by the solubility of compound 3b in NaCl solution, which is very low. Therefore at concentration 64 ppm the compound 3b has already reached its saturated concentration and its adsorption on metal surface became supersaturated. In that condition, the addition of more compound 3b in 1% NaCl solution did not lead to an increase in corrosion inhibition. The linearity of the Langmuir isotherm adsorptions for each compound, as shown on Figure 5, represents the monolayer formation for each compound on the carbon steel surface. Based on Table 5 we can see that Gibbs free adsorption energy values, \(\Delta G^0_{ads}\), for each compound are negative, which demonstrates the spontaneity of adsorption the compounds onto the metal surface. The more negative the \(\Delta G^{0}_{ads}\) value the more favorable the adsorption onto the metal surface, therefore the corrosion inhibition activity would increase. The value of \(\Delta G^0_{ads}\), up to -20 kJ/mol, is consistent with the physical adsorption (physiosorption), whereas values of \(\Delta G_{ads}^0\) above – 40 kJ/mol are indicative of chemical adsorption (chemisorption) [7-8]. Therefore, compound 1b, 2b and 3b have the potential to interact with carbon steel through semi-physiosorption or semi-chemisorption because of their \(\Delta G^0_{ads}\) values are intermediate between – 20 kJ/mol and – 40 kJ/mol.
Figure 6 represents the simulation of the arrangements of compounds 1b, 2b and 3b on a metal surface. Each structure was energy minimized utilizing the MM2 program in Chem3D Ultra 8.0 of ChemOffice Cambridgesoft® software. As we can see from Figure 6 that the adsorption site of compound 1b is at the –NH<sub>2</sub> group and imidazoline ring, in addition to the ethylene groups (-C=C-) from its side chain. The hydrophobic effect of the long carbon chain will hinder the metal from the contact with corrosive environment. The adsorption site of compound 2b is at –OH group, imidazoline ring and also involves the ethylene groups (-C=C-) from its side chain. In compound 3b, there is no additional adsorption site beside the –NH2 group and imidazoline ring. These features explain why 3b has less corrosion inhibition activity than compounds 1b and 2b because of its lack of additional adsorption site of its molecule and also because of the steric hindrance from the hydrophobic heptadecyl group on its side chain.
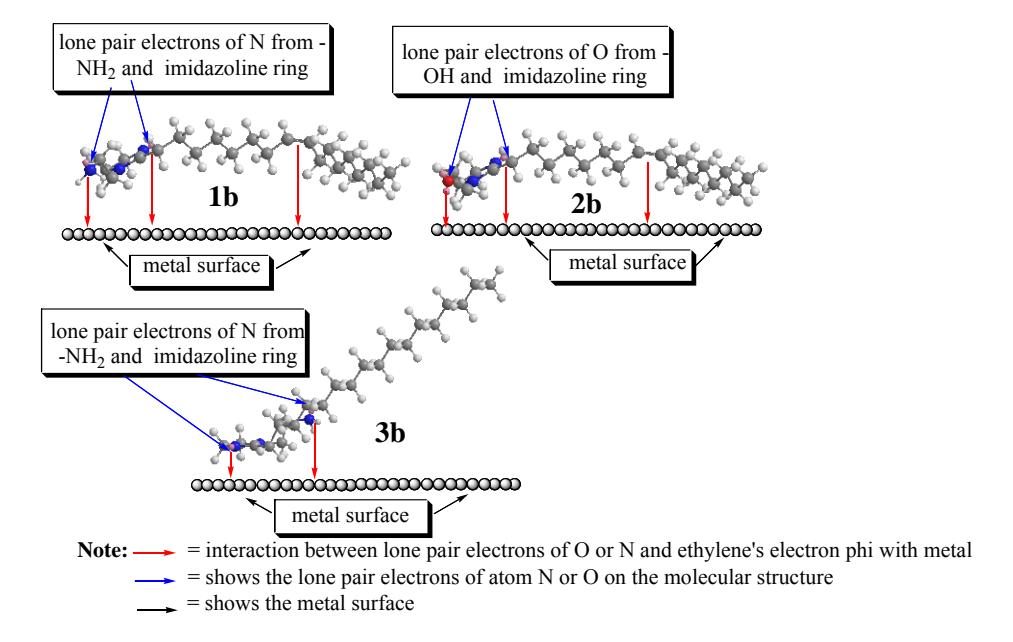
Figure 6 The simulation of 3D structure of compound 1b, 2b and 3b and their interaction on metal surface. The pink sphere indicates the lone pair electrons, the blue sphere indicates the nitrogen atoms, the oxygen atom is indicated with red sphere, the carbon atoms are indicated by black sphere and the hydrogen atoms are indicated by white sphere. Metal surface is indicated by the arrangements of round balls under each molecule.
4 Conclusions
The synthesis of imidazoline derivative compounds produced three types of compounds: (Z)-2-(2-(heptadec-8-enyl)-4,5-dihydroimidazol-1-yl)ethanamine (compound 1a and 1b), (Z)-2-(2-(heptadec-8-enyl)-4,5-dihydroimidazol-1 yl)ethanol (compound 2a and 2b) and 2-(2-heptadecyl-4,5-dihydroimidazol-1 yl)ethanamine (compound 3a and 3b). The MAOS method is more effective in synthesizing these compounds evidenced by the higher chemical yields and the shorter reaction times. Compound 2b ((Z)-2-(2-(heptadec-8-enyl)-4,5 dihydroimidazol-1-yl)ethanol) has highest corrosion inhibition activity towards
carbon steel (39.59%) at 8 ppm concentration in 1% NaCl solution. The increase in concentration of compounds 1b, 2b and 3b in 1% NaCl solution tends to improve the corrosion inhibition activity. Based on the analysis of the degree of surface coverage, θ, and the value of Gibbs adsorption energy, ΔG0 ads, compounds 1b, 2b and 3b have the potential to interact with carbon steel through semi-physiosorption or semi-chemisorption because of their ΔG0 ads values are in between – 20 kJ/mol and – 40 kJ/mol.
Acknowledgements
The team would like to thank to Dr. Jalifah Latip from Chemistry Department of Universiti Kebangsaan Malaysia, Prof. Dieter Ziessow from TU Berlin and Dr. Andreas Schaeffer from FU Berlin for the permission in taking the measurements of NMR spectroscopy of synthesized products using JEOL DELTA NMR at Universiti Kebangsaan Malaysia and FU Berlin. This research is partially granted by Hibah RUT XII from Kemenristek RI and BPPS scholarship for the first author.