
1 Introduction
Yttria Stabilized- Zirconia (YSZ) is widely used as the electrolyte for solid oxide fuel cell (SOFCs) since it exhibits sufficient ionic conductivity at operating temperature as high as 1000 oC [1]. However, a considerable interest in the mixed dopant effect on the ionic conductivity in several ternary systems containing ZrO2 and Y2O3 [2-4] has arisen. Some authors [5-7] found that partial replacement of Y2O3 by CaO in the system of ZrO2-Y2O3 may enhance the ionic conductivity at higher temperature (> 1127 C). Even at the operating temperature around 1000 oC, the mixed CaO/Y2O3-stabilized ZrO2 (CYZ) also exhibits ionic conductivity comparable to that of YSZ. Thus the ternary system ZrO2-Y2O3-CaO might be more attractive than other ternary systems, due to the lower cost of CaO compared to other trivalent oxides such as Sc2O3 and Yb2O3. Gong et al. [8] found that the migration energy, Em, and dissociation energy, Ea , for CYZ are higher than those for YSZ but lower than those for calcia stabilized zirconia (CSZ). At temperature over than 700 °C, the conductivity of CYZ increases more rapidly than that of YSZ. It has been noted by Gong et al. [8] that the pre-exponential factor of CYZ, \(\ln \sigma_o\), is 19.65 S cm<sup>-1</sup> at 600-800 K, meanwhile the pre-exponential factor of YSZ is 16.84 S cm<sup>-1</sup> at the same temperature. The high pre-exponential factor of CYZ mainly due to its higher oxygen vacancies concentration compared to YSZ.
Bucko, et al. [9] synthesized CYZ using hydrothermal method from coprecipitated zirconia hydrogels and found that samples with 8 % mol oxygen vacancies, obtained from substitution of Calcium and Yttrium with ratio below 50:50, were composed of the cubic phase only. This cubic phase can be obtained with heat treatment at 1300 °C. This is exceptional, since based on binary phase diagram of Y<sub>2</sub>O<sub>3</sub>-ZrO<sub>2</sub>, the fully cubic phase of Y<sub>8</sub>SZ (8 % mol of Y<sub>2</sub>O<sub>3</sub> doping into ZrO<sub>2</sub>) could only be achieved at heating temperature more than 1500 °C [10]. It has been found also by Bucko, et al. [9] that the substitution of Calcia (CaO) for Yttria (Y<sub>2</sub>O<sub>3</sub>) as well as Yttria for Calcia in the Zirconia solid solutions results in an enhancement of ionic conductivity. In 8 % mol oxygen vacancy of CYZ where the ratio of CaO:Y<sub>2</sub>O<sub>3</sub> is 10:90 (8C10Y90), introduction of Calcia produced the maximum enhancement of bulk and grain boundary conductivity.
In this paper, two types of doped-Zirconia, \(Y_2O_3\)-Zr\(O_2\) (YSZ) and CaO-\(Y_2O_3\)-Zr\(O_2\) (CYZ), were prepared using solid state reaction method. The Zirconia was prepared by caustic fusion of ZrSiO<sub>4</sub>, a side product of Tin Mining in Bangka Island, Indonesia. This study also aims to increase value of this ZrSiO<sub>4</sub>.
2 Experimental
Zirconia (ZrO<sub>2</sub>) was prepared by caustic fusion of Zircon (ZrSiO<sub>4</sub>), i.e by reacting Zircon with NaOH, followed by acid leaching and precipitation of ZrO<sub>2</sub> by addition of ammonia solution, as has been described by Soepriyanto, et al. [11]. Doping of \(Y_2O_3\) and (CaO-\(Y_2O_3\)) to create 8 % mol vacancy were carried out by solid state reaction, i.e. by introducing certain amounts of Yttria and Calcia-Yttria into the Zirconia powder. The mixed powder was ground and fired at 1350 °C for 5 hours for CYZ and 1500 °C for 5 hours for YSZ. The obtained powder was then pressed by Cold Isostatic Pressure at 200 MPa to form discs. The discs were then sintered at 1500 °C for 3 hours.
The synthesized materials were characterized by powder X-ray diffraction. Refinement on XRD data was carried out by using Le Bail method implemented in RIETICA program in order to analyze their structures. Morphology and elemental composition analyses were performed by Scanning Electron Microscope (SEM) equipped with EDX. Elemental analysis was also carried out using X-ray fluorescent (XRF). Ionic conductivities of the samples were measured by electrochemical impedance measurement using Agilent E4980A Precision LCR meter in the frequency range of 20 Hz - 2 MHz and at temperature range of 200 C - 500 C. The data from impedance measurement were fitted using ZView program to define of grain resistance (Rg) and grain boundary resistance (Rgb).
3 Results and discussion
The XRD patterns of ZrO2, YSZ and CYZ are presented in Figure 1. XRD pattern of ZrO2 showed broad peaks, indicating the small size of ZrO2 particles. There is no secondary phase observed in the XRD pattern of ZrO2. Doping of Yttria and Calcia-Yttria into ZrO2 allow to enhance the crystallinity of material, as evident from the sharp peaks observed in XRD patterns of YSZ and CYZ. Secondary phase were found in YSZ sample and it were identified as different structure of crystal, the peaks at 28.312 and 31.624. Meanwhile, in sample of CYZ (with 10:90 weight ratio of Calcia and Yttria), there is no indication of the presence of second phase, eventhough the sintering temperature of this CYZ is only at 1350 C, which is lower than sintering temperature of YSZ, 1500 C.
Le Bail profile refinement of XRD data of ZrO2 produced by caustic fusion of ZrSiO4, proceed successfully with tetragonal system and space group of P42/ nmc . The obtained cell parameters are listed in Table 1. The small value (below 10%) of Rp and Rwp, 2.645% and 3.011%, respectively, indicate that the good fitting was achieved. Elemental analysis using XRF showed that the ZrO2 contained 1.77% Silica and 5.76% Titania.
XRD analysis of YSZ and CYZ showed that there was phase transformation of ZrO2 from tetragonal to cubic system with introduction of Yttria and Calcia-Yttria into Zirconia. Le Bail refinement of XRD data of YSZ and CYZ could be carried out successfully with cubic structure and Fm3m space group. Cells parameters of ZrO2, YSZ and CYZ and other parameter from the refinement results are listed in Table 1. Again, good fitting were achieved as evident from the small value of Rp and Rwp for both materials. As expected, the Rp and Rwp values of YSZ are higher than those of CYZ (the values are listed in Table 1), due to the presence of monoclinic structure in YSZ.
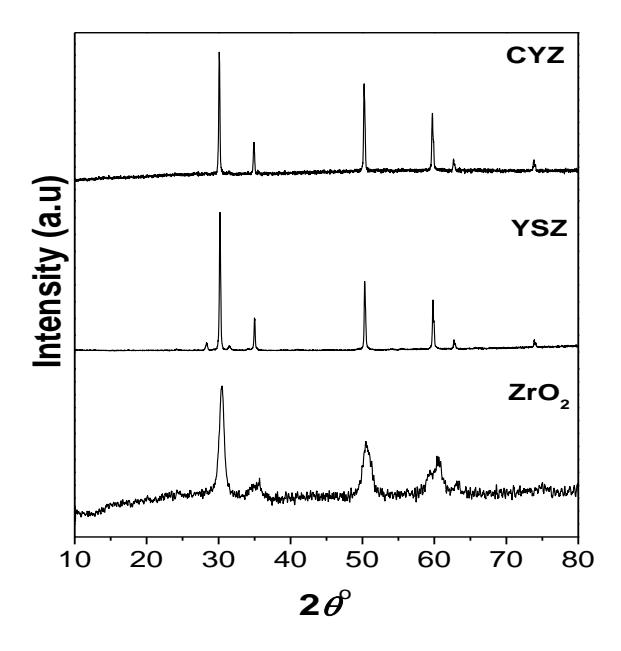
Figure 1 XRD patterns of \(ZrO_2\) prepared from caustic fusion of \(ZrSiO_4\), YSZ (8 % mol of Yttria) and CYZ (8 % mol of vacancy).
Table 1 Cell parameters of ZrO<sub>2</sub>, YSZ and CYZ as determined using Le Bail method.
| Parameters | ZrO2 | \(Y_{0.08}Zr_{0.92}O_{2-\delta} \ (YSZ)\) | \[\begin{array}{c} Ca_{0.008}Y_{0.072}Zr_{0.862}O_{1.84}\\ (CYZ) \end{array}\] |
|---|---|---|---|
| a (Å) | 3.60(1) | 5.134(2) | 5.150(3) |
| b (Å) | 3.60(1) | 5.134(2) | 5.150(3) |
| c (Å) | 5.22(2) | 5.134(2) | 5.150(3) |
| \(R_p(\%)\) | 2.645 | 9.697 | 4.828 |
| \(R_{wp}(\%)\) | 3.011 | 7.611 | 6.210 |
| \(\chi^2\) | 0.063 | 0.374 | 0.483 |
SEM photographs of YSZ and CYZ are given in Figure 2. These images indicate that the materials are not homogenous and still porous. There were two different morphologies appeared in SEM images, large grain and small ones. EDX analysis on the small grain showed that this region contains Silica as high as 2.97% of its total mass. This is 1.2% higher than the value obtained from XRF measurement. Presumably Silica was segregated in this part, i.e. in the area between the grain boundary of YSZ or CYZ.
Figure 2 SEM photographs of (a) YSZ and (b) CYZ.
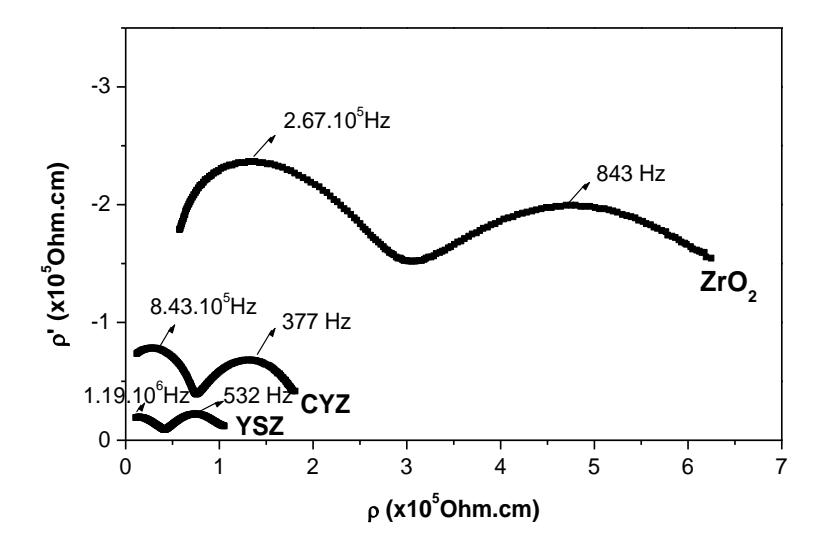
Figure 3 Impedance spectra of YSZ, CYZ and ZrO2 at 350oC, frequency is expressed in Hertz (Hz).
The raw impedance data of ZrO2, YSZ and CYZ are plotted in Figure 3. These impedance data were taken at 350 C and in the frequency range of 20 Hz-2 MHz. The two well-defined arcs have been observed. These arcs have capacitance values around 0.1 pF and 1.4 nF, which are related to the grain and grain boundary impedance, respectively [12]. We could see in Figure 3 that doping Yttria and Calcia-Yttria into Zirconia could reduce the impedance value significantly. The impedance data could be well fitted with a series circuit model of resistor-CPE (Constant Phase Element) and resistor-capacitor. CPE itself is non ideal behavior of the double layer capacitor on real cells. This model component represents several factors such as the porous-electrode effect associated with a distributed resistance/capacitance networks in the equivalent circuits and associated with electrode interface inhomogeneity [13].
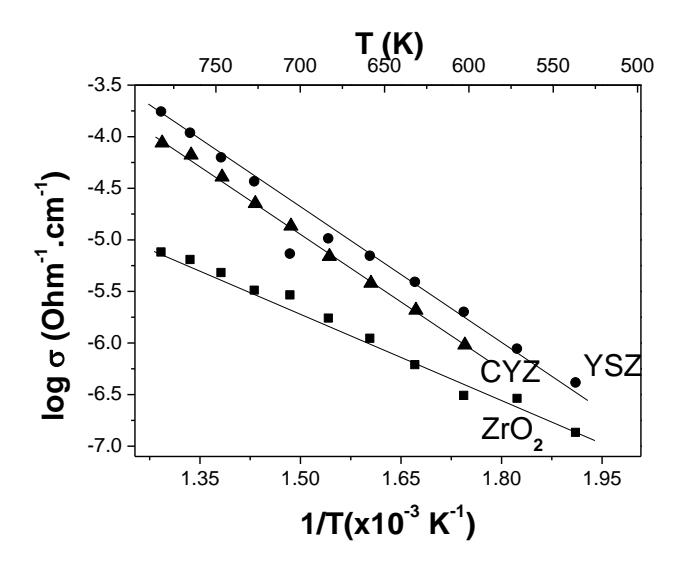
Figure 4 Plot of total conductivity of prepared materials of ZrO2, YSZ and CYZ.
From total resistivity, the sum of grain and grain boundary resistivity, the ionic conductivity values were calculated. Arrhenius plot of the ionic conductivity of the prepared materials were depicted in Figure 4. Arrhenius plot of the ionic conductivity of ZrO2 and YSZ are almost linear. However, there is an anomaly in CYZ, i.e. the conductivity has outlier value around 700 K, which always present in subsequent measurement. It is found that ZrO2 has the smallest activation energy, Ea = 0.25 eV. Meanwhile, the Ea values of YSZ and CYZ are 0.36 eV and 0.38 eV, respectively. The ionic conductivity of YSZ and CYZ are within in the range of electrolyte material, i.e. over 10-4 S.cm-1 [14]. The enhancement of conductivity of doped-Zirconia could be explained by the phase transformation from tetragonal into cubic. It is well known that fully stabilized cubic zirconia has high ionic conductivity and has been actively investigated as an oxide ion conductor in solid oxide fuel cell [15,16]. The conductivity values of CYZ are lower than that of YSZ in the measured temperature range of 200C-500C. The values of total conductivities of materials are plotted in Figure 4. Some authors found [5-7] that partial replacement of Y2O3 by CaO in the system ZrO2-Y2O3 may enhance the ionic conductivity at temperature higher than 1400 K.
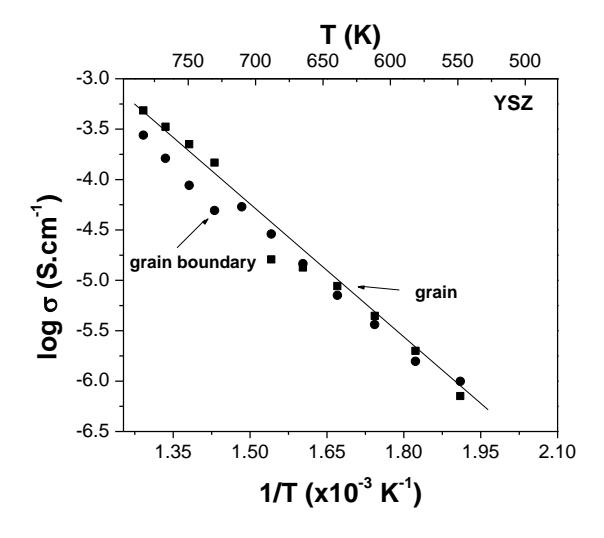
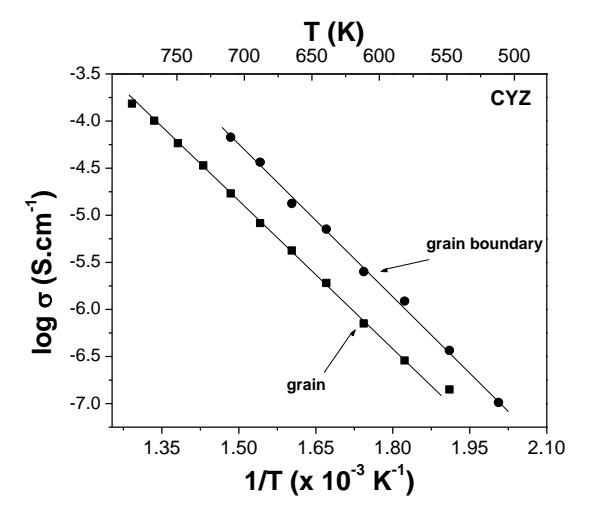
Figure 5 Arrhenius plots of grain and grain boundary conductivity of YSZ and CYZ samples.
In order to investigate the contribution of grain and grain boundary conductivity in the YSZ and CYZ, we plot the conductivities from those samples in separate figures, as shown in Figure 5. For the YSZ sample, we found that grain and grain boundary conductivity have similar values at temperature of 200 C – 425 C. At high temperature region, over 425 C, it is found that grain boundary conductivity is lower than bulk or grain conductivity. Some authors [7,17] found that the grain boundary effect in YSZ based compound has been largely attributed to the existence of second phase, consisting mainly of oxides of Si, Al, Mg and Ca impurities in the grain boundary. However, the influence of grain boundary on the conductivity is small at high temperature [18]. Different behavior is observed in CYZ sample where the grain boundary conductivity is found to be larger than grain conductivity. We could add here, that the slope of grain boundary conductivity is larger than the slope of grain conductivity. Therefore there is a possibility to obtain higher conductivity of CYZ at high temperature by increasing the grain boundary conductivity, as stated by some authors [5-7].
The electrolyte material in SOFC should be dense enough so that the fuel and oxidant could not pass through the electrolyte. Water diffusion test on prepared materials and microstructure analysis by means of SEM analysis on low magnification (Figure 6) showed that the prepared materials are still porous and has not met the requirement for electrolyte material yet. Presumably Silica enrichment as stated above hinders the growth and densification of Zirconia. Better preparation method that could produce Silica free Zirconia from ZrSiO4 is needed.
Figure 6 Microstructure images of SEM analysis of YSZ and CYZ with magnification 150x.
4 Conclusions
YSZ and CYZ prepared from ZrSiO<sub>4</sub> concentrate could have high ionic conductivity (above 10<sup>-4</sup> S.cm<sup>-1</sup>) at low temperature, 500 °C and has potential application in SOFC. Silica enrichment in the grain boundary decrease YSZ and CYZ conductivity. These impurities also result in porous structure of sintered prepared materials. At temperature range of 200 °C – 500 °C, the ionic conductivity of CYZ is found to be lower than YSZ due to the grain boundary effects. However, the grain boundary effects of YSZ are suppressed above 400 °C, implying that CYZ could have ionic conductivity comparable to or higher than YSZ at higher temperature.
Acknowledgements
This work was supported by Insentif Program by Ministry of Research and Technology, Indonesia, contract number 53/RT/Insentif/PPK/II/08 (February 15<sup>th</sup>, 2008) and 050/RT/D.PSIPTN/Insentif/PPK/I/2009 (January 20<sup>th</sup>, 2009). It was supported also by Riset KK ITB contract number 1501/K01.08/SPK/2009 January 30, 2009. Authors also gratefully acknowledge the help of Prof. G.M. Choi from Fuel Cell Centre, Department of Material Science and Engineering, Pohang University of Science and Technology, Pohang, South Korea.