
1 Introduction
The Aurivillius phases are a family of layered bismuth oxides, which are known to possess a structure described as intergrowths between fluorite-like [Bi2O2] 2+ layers and m perovskite-type layers [Am-1BmO3m+1] 2- [1]. A-site could be occupied by mono, di or trivalent cations having dodecahedral coordination, while B-site could be occupied by a transition element with octahedral coordination and m is an integer representing the number of sheets of cornersharing BO6 octahedra forming the ABO3-type perovskite blocks. Majority of these phases have been known as ferroelectrics materials with high Curie temperature, \(T_c\) such as Bi<sub>4</sub>Ti<sub>3</sub>O<sub>12</sub> (675°C), PbBi<sub>4</sub>Ti<sub>4</sub>O<sub>15</sub> (570°C), and Pb<sub>2</sub>Bi<sub>4</sub>Ti<sub>5</sub>O<sub>18</sub> (310°C) [2,3]. The ferroelectricity in these phases is resulted by \(d^0\) transition cations such as Ti<sup>4+</sup> which occupies B-site in the perovskite layer. \(T_c\) of these series decreases with increasing a number of perovskite layers. \(T_c\) has related to the degree of structural distortion of the perovskite which could be considered as the perovskite tolerance factor (t) [4]. As \(T_c\) decreases, the structural distortion of the perovskite decreases and t increases. The tolerance factor (t) of Bi<sub>4</sub>Ti<sub>3</sub>O<sub>12</sub>, PbBi<sub>4</sub>Ti<sub>4</sub>O<sub>15</sub>, and Pb<sub>2</sub>Bi<sub>4</sub>Ti<sub>5</sub>O<sub>18</sub> are 0.958, 0.976, and 0.986, respectively. The tolerance factor increases as the number of perovskite layers in the compounds increases and give decreasing of \(T_c\) as described above.
\(Bi_4Ti_3O_{12}\) and \(PbBi_4Ti_4O_{15}\) are reported as normal ferroelectric while \(Pb_2Bi_4Ti_5O_{18}\) and \(Pb_3Bi_4Ti_6O_{21}\) show a relaxor behavior [3]. According to Fernandez, et.al. [3], relaxor behavior in \(Pb_xBi_4Ti_{3+x}O_{12+3x}\) could appear as the symmetry in the ab plane of the structure increases and the temperature of transition phase decreases. Relaxor ferroelectrics are characterized by the frequency dependent diffuse phase transition.
Introducing magnetic transition metal cations \((d^n)\) into the central octahedral layer of the perovskite layers in the Aurivillius phases has received much interest since this may result in a material which has both dielectric and magnetic properties. Several Aurivillius phases containing both of \(d^0\) and \(d^n\)cations, such as Bi<sub>5</sub>Ti<sub>3</sub>FeO<sub>15</sub> [5,6] and Bi<sub>6</sub>Ti<sub>3</sub>Fe<sub>2</sub>O<sub>18</sub> [5,7] have been synthesized, studied and reported. These compounds could be easily obtained in single phase and found to be ferroelectric with antiferromagnetic correlation among their magnetic moments. However, to obtain the Aurivillius phase containing both ferroelectric and ferromagnetic ordering is a challenge. It was reported that BiMnO<sub>3</sub> has monoclinic (C2) structure with Curie temperature for ferroelectricity at 470 K and transition to ferromagnetism at 100 K [8]. Recently, we introduced Mn<sup>3+</sup> ion into the perovskite layers of Pb<sub>1-x</sub>Bi<sub>4+x</sub>Ti<sub>4-</sub> <sub>x</sub>Mn<sub>x</sub>O<sub>15</sub> synthesized by molten salt method [9,10]. The single phase of Aurivillius was observed for Mn concentration up to 0.6 and the critical temperature \((T_c)\) ferroelectric of these compounds increase as the Mn concentration increases. It is interesting to synthesize the five layers of Aurivillius phases (Pb<sub>2</sub>Bi<sub>4</sub>Ti<sub>5</sub>O<sub>18</sub>) containing Mn atom and to study the change of their dielectric and magnetic properties.
In this paper, we report the synthesis of five layers Aurivillius phases, \(Pb_{2-x}Bi_{4+x}Ti_{5-x}Mn_xO_{18}\) (\(0 \le x \le 1\)) using molten salt method, analysis of their crystal structures using X-ray diffraction powder and measurement of their dielectric and magnetic properties.
2 Experimental
Raw materials of TiO2, Mn2O3, Bi2O3, and PbO with high purity (Aldrich, 99.9%) were weighed in stoichiometric proportion and mixed in an agate mortar. The mixture of raw materials was then ground together with the mixture of Na2SO4/ K2SO4 salts (1:1 molar ratio). The molar ratio of oxide compounds to the salt mixture was 1:7, which was excess in salts mixture. The reactant mixtures were placed in an alumina crucible and heated at temperatures of 750 C, 850C, and 900C for 15 h for each heating step. Resulted products were washed several times using hot distilled water to remove the alkali salts and dried at 110 C for 24 h. Powder X-ray diffraction (XRD) data were collected by a Bruker D8 diffractometer using monochromatized Cu-K radiation from 2 = 10 to 100 with a step-width of 0.02 and counting time of 7 seconds per step. The Le Bail refinements were performed using RIETICA program [11]. The elemental compositions of product were analyzed by energy dispersive Xray spectroscopy (EDS).
For the dielectric constant measurement, the obtained powders were pressed into pellets with 1 cm in diameter and thickness of about 0.1 cm. These pellets were then sintered at 800C for 12 h in air for densification process. We used electrodes made from silver paste painted on both sides of the pellet and the painted pellet was heated at 200C for 2 h. The dielectric properties of the samples were measured by using a LCR meter (Agilent 4980 A) with signal strength of 1 V in the temperature range of 80C to 600C with a variation of frequencies. The magnetization measurement was carried out using a SQUID magnetometer in the temperature range of 2 K to 300 K in magnetic field of 1 T.
3 Results and Discussion
The X-ray diffraction (XRD) patterns of Pb2-xBi4+xTi5-xMnxO18powders with x = 0, 0.2, 0.4, 0.6, 0.8 and 1 are given in Figure 1. These patterns were matched well with the XRD pattern of the five layers Aurivillius phase reported in [12] with orthorhombic structure and space group of B2cb. The samples with composition x = 0, 0.2, 0.4 and 0.6 formed the five layers Aurivillius; however, the samples with x = 0.4 and 0.6 contained impurity as BiMnO3 [13] indicated by appearance of the peaks around 2 = 22.42 and 31.95. The additional phase (four layers Aurivillius, PbBi4Ti4O15) [9,14] was also observed for x = 0.6 with the appearance of the peaks around 2 = 12.98, 17.34, and 34.80. The samples with composition x 0.8 did not form five layers Aurivillius indicated by disappear of the peaks around 2 = 10.80, 14.23, and 17.89 as the indication of five layer Aurivillius phase. These samples formed four layers Aurivillius (\(PbBi_4Ti_4O_{15}\)) and \(BiMnO_3\).
Figure 1 Powder X-ray diffraction pattern of \(Pb_{2-x}Bi_{4+x}Ti_{5-x}Mn_xO_{18}\) synthesized by molten salt method. Samples with x = 0 and 0.2 are single phase of five layers Aurivillius, \(\downarrow = BiMnO_3\), * = four layers Aurivillius phase (PbBi<sub>4</sub>Ti<sub>4</sub>O<sub>15</sub>).
The Le Bail refinement was carried out for \(Pb_{2-x}Bi_{4+x}Ti_{5-x}Mn_xO_{18}\) (x=0 and 0.2) initially with the space group B2cb [12]. The R-factor values and the refinement results are given in Table 1, while the fits are given in Figure 2. The parameters of a and b of these compounds (a=5.4707(6) Å and 5.4680(3) Å and b=5.4633(6) Å and 5.4532(3) Å for x=0 and 0.2, respectively) are relatively larger compared to the four layers Aurivillius (\(PbBi_4Ti_4O_{15}\) [13], a=5.4535(2) Å and b=5.4312(2) Å). The larger value a and b of these five layers Aurivillius is consistent due to the increasing of \(Pb^{2+}\)-concentration, which has higher ionic radius compared to the \(Bi^{3+}\), \(r(Pb^{2+})=1,29\) Å and \(r(Bi^{3+})=1,17\) Å [15]. The difference between the lattice parameters (b-a) of \(Pb_{2-x}Bi_{4+x}Ti_{5-x}Mn_xO_{18}\) for x=0 and 0.2 are about -0.01 Å. This value of (b-a) is close to tetragonal compared to the value of (b-a) of \(PbBi_4Ti_4O_{15}\) (-0.02 Å). These results indicate that the orthorombicity of five layers Aurivillius (\(PbBi_4Ti_4O_{15}\)).
Figure 2 Le Bail plot of XRD powder of \(Pb_{2-x}Bi_{4+x}Ti_{5-x}Mn_xO_{18}\) with x=0 and 0.2. Observed XRD intensity (circle), calculated data (solid line), and the difference of patterns, \(y_{obs}\) - \(y_{cal}\) (solid line on the bottom curve). The tick marks represent the positions of allowed Bragg reflections in the phase of B2cb.
Table 1 Cell Parameters of \(Pb_{2-x}Bi_{4+x}Ti_{5-x}Mn_xO_{18}\) (x = 0 and 0.2) refined from XRD powder with B2cb space group.
| Parameters | \(Pb_{2-x}Bi_{4+x}Ti_{5-x}Mn_xO_{18}\) | ||
|---|---|---|---|
| x = 0 | x = 0.2 | ||
| a (Å) | 5.4707(6) | 5.4680(3) | |
| b (Å) | 5.4633(6) | 5.4532(3) | |
| c (Å) | 49.545(4) | 49.607(3) | |
| \(V(\mathring{A}^3)\) | 1480.8(2) | 1479.2(1) | |
| b-a (Å) | - 0.0074 | - 0.0148 | |
| Z | 4 | 4 | |
| \(R_p\) (%) | 9.14 | 8.56 | |
| \(R_{wp}\) (%) | 11.65 | 11.07 | |
| \(\chi^2\) | 2.81 | 2.63 | |
| \(R_{exp}\) (%) | 6.96 | 6.82 | |
| \(R_{Bragg}\) (%) | 5.22 | 5.68 | |
The elemental analysis of \(Pb_{2-x}Bi_{4+x}Ti_{5-x}Mn_xO_{18}\) was performed by energy dispersive X-ray spectroscopy (EDS) and the results are shown in Figure 3. The analysis was focused on the sample with x = 0, 0.2, and 0.4 since the samples x > 0.4 did not form a single phase of five layers Auirvillius. The percentage of elemental composition based on the results of EDS analysis is compared with the percentage of elemental composition calculated by assuming the fitted
formula. The percentage composition of Pb and Bi is combined due to their energy dispersive X-ray relatively the same. From the Figure 3 can be seen that the percentage composition of elements (Ti, Mn, and Pb and Bi) for all products is relatively similar to the percentage composition of those elements calculated to base on the formula fitted. These results indicate that the molar ratio of the product is consistent with the starting mixture to be fitted to the basic formula of five layers Aurivillius.
Figure 3 Plot percentage of elementals [Mn, Ti, and (Pb,Bi)] compositon in the samples \(Pb_{2-x}Bi_{4+x}Ti_{5-x}Mn_xO_{18}\) (\(x=0,\ 0.2,\ 0.4\)) was analyzed by EDS and calculated to base on the fitted formula.
The temperature dependence of the dielectric constant for the \(Pb_{2-x}Bi_{4+x}Ti_{5-x}Mn_xO_{18}\) (x=0, 0.2, 0.4, 0.6, 0.8, and 1) at various frequencies is depicted in Figure 4. The samples with composition x=0, 0.2, 0.4, and 0.6 show broad peaks with the maximum dielectric constant (\(T_m\)) at temperature of 295, 295, 304 and 343°C (at a frequency of 2 MHz), respectively. The \(T_m\) of these samples is shift to the left with decreasing of frequency (the \(T_m\) at a frequency of 100 kHz is 290, 290, 295, and 310°C for x=0, 0.2, 0.4, and 0.6, respectively) as indication relaxor ferroelectric behavior. The \(T_m\) of these samples are close to the values observed by [3] (285°C) for \(Pb_2Bi_4Ti_5O_{18}\) synthesized by solid state technique. The sample with x=0.6 also shows the small peak around 500°C as indication of the transition phase of four layers Aurivillius (\(PbBi_4Ti_4O_{15}\)). These results correspond to the XRD powder of x=0.6 which contained impurity of \(PbBi_4Ti_4O_{15}\). Meanwhile, the samples with compositon x=0.8 and 1 show a anomaly at the higher temperature 514°C and 551°C, respectively. The anomaly from both of these compounds corresponds to the transition phase (\(T_c\)) of four layers Aurivillius phase (PbBi<sub>4</sub>Ti<sub>4</sub>O<sub>15</sub>).
Figure 4 Frequency dependence of dielectric constant of Aurivillius phases Pb<sub>2-x</sub>Bi<sub>4+x</sub>Ti<sub>5-x</sub>Mn<sub>x</sub>O<sub>18</sub> (x = 0, 0.2, 0.4, 0.6, 0.8, and 1) with variation of temperature. * = these samples do not form the single phase of five layers of Aurivillius. ** = these samples formed four layers Aurivillius. The arrow indicates shifting of the \(T_m\).
The appearance of relaxor behavior in the samples \(Pb_{2-x}Bi_{4+x}Ti_{5-x}Mn_xO_{18}\) with compositon x up to 0.6 could be correlated to the decreasing of \(T_m\) (\(\sim 300^{\circ}C\)) with the lower value compared to the \(T_c\) of four layers Aurivillius with the higher value (around 570 °C). It could also be indicated by increasing the symmetry of these samples due to the orthorombocity of these samples smaller than four layers Aurivillius as described above.
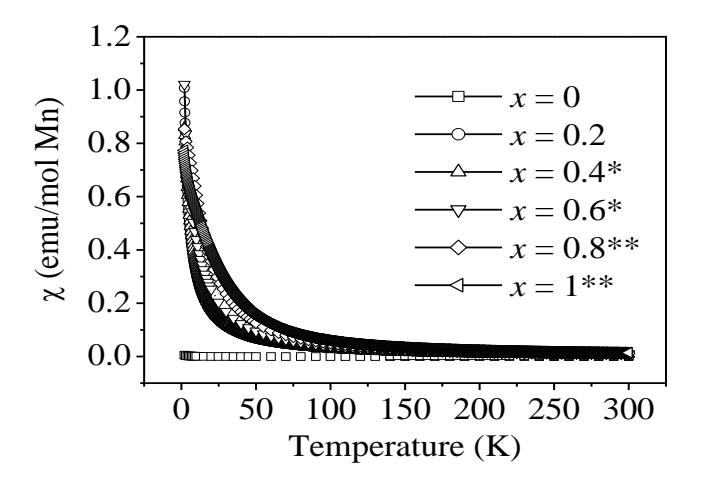
Figure 5 Magnetic susceptibility of Aurivillius phases \(Pb_{2-x}Bi_{4+x}Ti_{5-x}Mn_xO_{18}\) (x = 0, 0.2, 0.4, 0.6, 0.8 and 1) as a function of temperature. * = these samples do not form the single phase of five layers of Aurivillius. ** = these samples formed four layers Aurivillius.
The magnetic susceptibility (\(\chi\)) data against temperature (T) for Pb<sub>2-x</sub>Bi<sub>4+x</sub>Ti<sub>5-x</sub>Mn<sub>x</sub>O<sub>18</sub> is plotted in Figure 5. The results show that all of the samples containing manganese ion have the paramagnetic behavior. The susceptibility
data were then fitted by the Currie-Weiss equation, \[\chi = \frac{C}{T - \theta_{CW}}\], where C is the Curie constant and \(\theta_{CW}\) is the Curie-Weiss temperature. C and \(\theta_{CW}\) were determined by the plot of \(1/\chi\) against T. The plots of \(1/\chi\) against temperature are shown in Figure 6. For all samples, the linear extrapolation fits shows positive temperature intercepts, indicating the presence of ferromagnetic interactions. The Curie constant (C) and Curie-Weiss temperature (\(\theta_{CW}\)) values for the samples \(Pb_{2-x}Bi_{4+x}Ti_{5-x}Mn_xO_{18}\) are given in the Table 2. The effective moments (\(\mu_{eff}\)) of Mn for \(Pb_{2-x}Bi_{4+x}Ti_{5-x}Mn_xO_{18}\) were derived from the Curie constant and calculated by equation; \(\mu_{eff} = (8C)^{1/2}\) [13]. The results of Mn effective moment calculated from these sample are 4.35, 4.48, 4.49, 4.87, and 5.47 \(\mu_B\) with x = 0.2, 0.4, 0.6, 0.8, and 1, respectively. The \(\mu_{eff}\) of \(x \le 0.8\) are smaller than the \(\mu_{eff}\) of \(x \le 0.8\) are smaller than the \(x \ge 0.8\) free ion (4.9 \(x \ge 0.8\)) and close to the effective moment reported for
BiMnO<sub>3</sub> (4.69 \(\mu_B\)) calculated from the Curie constant data [13]. The smaller effective moment of these samples compared to the free ion effective moment of Mn<sup>3+</sup> indicates that these compounds contain Mn<sup>4+</sup> (\(\mu_{eff}=3.87~\mu_B\)) beside Mn<sup>3+</sup>. On the other hand, the sample with x=1 contains a mixture of Mn<sup>3+</sup> and Mn<sup>2+</sup> since the effective moment of this sample is higher than the effective moment of free ion of Mn<sup>3+</sup> and lower than the free ion effective moment of Mn<sup>2+</sup> (5.92 \(\mu_B\)).
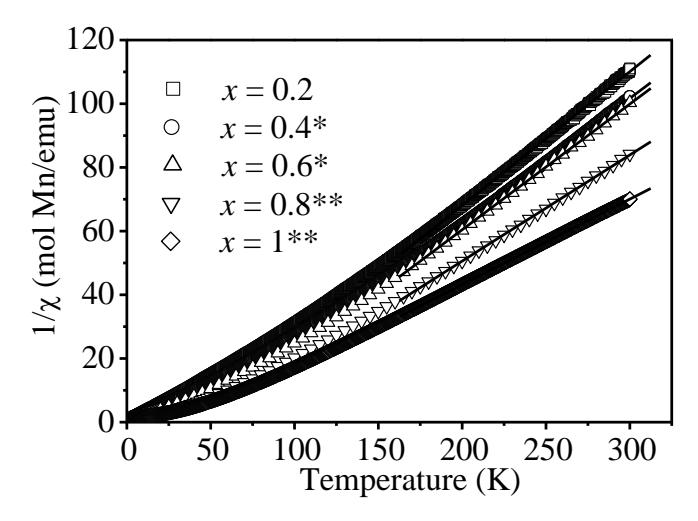
Figure 6 Variation of inverse susceptibility magnetic with temperature for Aurivillius phases \(Pb_{2-x}Bi_{4+x}Ti_{5-x}Mn_xO_{18}\) (x=0.2, 0.4, 0.6, 0.8 and 1). * = these samples do not form the single phase of five layers of Aurivillius. ** = these samples formed four layers Aurivillius. The line shows a Curie–Weiss fitting in the temperature range of 175 – 300 K.
Table 2 Data magnetic measurements of Aurivillius phases \(Pb_{2-x}Bi_{4+x}Ti_{5-x}Mn_xO_{18}\) (x=0, 0.2, 0.4, 0.6, 0.8 and 1). * = these samples did not form the single phase of five layers of Aurivillius. ** = these samples formed four layers Aurivillius.
| Sample - | Magnetic | ||
|---|---|---|---|
| \(\theta(K)\) | \(\boldsymbol{C}\) | \(\mu_{eff}(\mu_{\rm B})\) | |
| x = 0.2 | 39.80 | 2.36 | 4.35 |
| x = 0.4* | 44.34 | 2.51 | 4.48 |
| x = 0.6* | 48.05 | 2.52 | 4.49 |
| x = 0.8** | 50.37 | 2.97 | 4.87 |
| x = 1** | 38.29 | 3.74 | 5.47 |
4 Conclusions
The Aurivillius phases, Pb2-xBi4+xTi5-xMnxO18were prepared by molten-salt technique and single phase was found for x 0.2 with the space group B2cb. The samples with composition x = 0.4 and 0.6 contained impurities and it were identified as BiMnO3. Four layers of Aurivillius phase (PbBi4Ti4O15) was also observed as impurity for x = 0.6. Meanwhile the samples with composition x = 0.8 and 1 formed two phases, four layers Aurivillius and BiMnO3. The dielectric measurements showed that the samples with x = 0, 0.2, 0.4, and 0.6 exhibited relaxor behavior with anomaly (Tm) at temperature 295, 295, 304, and 343C at frequency 2 MHz, respectively. Meanwhile the samples with x = 0.8 and 1 show anomaly at 514 and 551C which is the transition phase of four layers Aurivillius. Magnetic measurement for all samples containing manganese ions showed paramagnetic properties. The ferromagnetic interactions in the paramagnetic is observed for x 0.8 since containing the mixed valence of Mn3+/Mn4+, while for x = 1 the contribution from Mn2+ is imminent.
Acknowledgments
The authors acknowledge the financial support from ITB Bandung under Program Riset ITB No Kontrak 041/K01.7/RL/2008. Zulhadjri thanks to the Ministry of National Education of the Republic of Indonesia for BPPS scholarship and sandwich program to Groningen University. We thanks Prof T.T.M. Palstra for measurement of the X-ray diffraction data.