
1 Introduction
Rice is an essential food source in Indonesia along with cassava, corn and sago. Its production and distribution has been one of major concern for government policies. Although required by almost all inhabitants, rice production is rather clustered in some areas, mainly at the Northern Coastal Region of Java. In the area, land use competition has been fairly high due to uncontrolled urban sprawl. Major driver for agricultural land conversion includes provision of industrial and housing areas.
Monitoring is then required to acquire rice production data in existing fields. Earth observation data are indispensable to this activity as the rice fields are dispersed across East, Southeast and South Asian countries. Previously, Panigrahy, et al. [1] demonstrated the application of Indian Remote Sensing Satellite IRS P6 to discriminate various agricultural crops in Orissa, India. Substantial contribution was made by Inoue, et al. [2] which studied backscatter behavior of Japanese rice under different frequencies and polarizations. Mapping large-scale rice fields was shown possible using medium resolution
MODIS data [3]. In Indonesia, remote sensing data have been studied extensively. Panuju, et al. [4], for instance, successfully identified various rice growth stages in two locations of Java using Landsat data. Another test using ALOS AVNIR-2 [5] and a next generation Indonesian micro-satellite [6] showed similar results.
Small-scale farming systems as seen in Indonesia require special consideration to the data. At the moment, there has been a few updated database on rice field at the high resolution possible in Indonesia. This is crucial to accommodate timely rice monitoring and its planning. Previous attempts to classify all agricultural commodities in Indonesia have been fairly unsuccessful due to the complexity of land uses.
Based on previous experiences, provision of high resolution rice distribution map is critical to this task. The role of low altitude aerial photograph has been replaced by high resolution satellite data such as QuickBird or WorldView-2. The latter has been one of the highest spatial resolution sensors to date. In addition, three supplementary bands were added as an aid to capture more information.
WorldView-2 was launched at Vandenberg Air Force Base, USA, in 8 October 2009. The sensor has capability to acquire 50-cm ground resolution imageries in panchromatic and multi-spectral (MS) modes. Following table provides spectral bands of WorldView-2 [7].
| Spectral band | Spectral Band Edges (nm) |
|---|---|
| Pan | 450 – 800 |
| MS1 – NIR1 | 770 – 895 |
| MS2 – Red | 630 – 690 |
| MS3 – Green | 510 – 580 |
| MS4 – Blue | 450 – 510 |
| MS5 – Red Edge | 705 – 745 |
| MS6 – Yellow | 585 – 625 |
| MS7 – Coastal | 400 – 450 |
| MS8 – NIR2 | 860 – 1040 |
Table 1 WorldView-2 Spectral Bands.
The sensor has been utilized in some applications. Zhang and Huang [8] showed that WorldView-2 data were able to distinguish various land covers in a coastal region. Using bi-temporal 2010 Haiti Earthquake WorldView-2 data, Kazama and Guo [9] provided a damage assessment by using Pair-wised Normalised Vegetation Index and Support Vector Machine. Building detection was also demonstrated by Guo and Kazama [10] which led to a research of automated
urban building delineation. Nonetheless, very limited application, if any, in rice field mapping and monitoring has been presented in literature using WorldView-2 data. This research is a step in the direction of using this dataset for rice field mapping.
This paper discusses the use of WorldView-2 high resolution data to provide high resolution rice field distribution map, especially to identify segmented rice fields. The data were then explored to examine applicability of additional three interesting bands, i.e. coastal, yellow and red edge, to discriminate various rice growth periods. To extend the application, an outlook of routine rice monitoring is also examined through decision tree analysis and image classification.
2 Methodology
2.1 Study Site
The site was situated in Subang Regency, Indonesia (Figure 1). Subang is one of the main rice producers in the country, situated in northern region of Java Island. Rice planting can be easily found throughout the region. However, most productive region in Subang has been the Northern Coastal Region (NCR). Alluvial plain which is the most preferable for rice planting is found throughout the NCR. The area is also supported by a large scale irrigation network from Jatiluhur multipurpose dam, making the area suitable for intensive planting scheme.
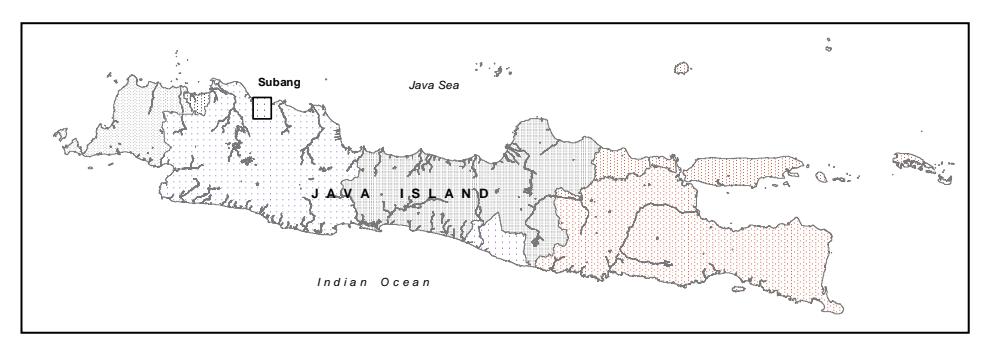
Figure 1 Subang Northern Coastal Region. Site location is indicated by a black box.
2.2 Datasets and Field Observation
The main dataset for the experiment includes WorldView-2 (panchromatic and multi-spectral) data, which was corrected according to the Indonesian Base Map (Peta Rupa Bumi Indonesia) at 1:25.000 scale. In order to assist the interpretation and analysis, additional data were exploited. Specific area
selection was assisted by a rice coverage map derived previously from highresolution multi-sensor observation, including ALOS PRISM, AVNIR-2, and SPOT-5 in 2009. The map was then validated by a thorough field observation. About 55 locations were visited during the field survey. Exact GPS positioning and rice growth conditions were recorded for each sample site.
2.3 Parcel Edge (Galengan) Identification
Capability on identifying galengan is one of primary interesting investigations in Indonesian agriculture using high remote sensing data. The role of galengan identification is to identify segmented land parcel. Higher number of galengan indicates that the agricultural region is highly segmented, which in turn reduce optimal acreage and the yield. Segmentation in smaller land parcel could signify a diversity of parcel management; consecutively create complexity in yield data acquisition.
Irregular size of galengan mostly found in Indonesia generates complication in agricultural parcel extraction from high resolution remotely-sensed images. To date, only wider galengans could be indicated from visual inspection or through quantitative methods such as edge detection. However, this is not the case of Subang, or in wider term, in Indonesia. Visual observation by means of ALOS PRISM data failed due to insufficient spatial resolution. Higher resolution data such as pan-sharpened IKONOS are capable to identify a limited number of galengan. Most of the identification scheme has been pseudo-recognition which observes galengan from different land cover (or growth stages in this case) of the adjacent parcels.
In this research, two types of galengan viz major and minor galengans were of our primary interest. For this purpose, we employed a pan-sharpened WorldView-2 data through visual inspection. To assist the identification, a collection of field dataset was utilized.
2.4 Agricultural Land Cover Mapping
In this research, all multispectral bands of WorldView-2 raw digital number format were converted into radiance using specification delivered in the header. Due to lacking meteorological dataset in the area, no radiometric correction was performed. Samples were taken throughout the area guided by field datasets, and then separated into training and testing data. To study various growth phases (i.e. fallow-dry, fallow-wet, transplanting, vegetative and generative), all training data were employed to construct spectral plot on each reflective band. Table 2 presents the size of training and testing data. Training or testing data for each class were taken at parcel level. Since the parcel size of paddy field varies, the training/testing data for each class is therefore imbalance.
The training data were fed into supervised classification employing two decision trees, namely QUEST [11] and CRUISE [12], to construct a thematic map. Previously, Pal and Mather [13] found that QUEST was quite robust in classification problem. However, literature review showed that both algorithms were rarely studied. Therefore, further research is required to assess their performances. In this research, classification performance was evaluated from testing dataset by computing the overall accuracy.
| Class names | Training | Testing | |
|---|---|---|---|
| Fallow-dry | 2026 | 2317 | |
| Fallow-wet | 2081 | 2067 | |
| Transplanting | 1107 | 521 | |
| Vegetative | 592 | 577 | |
| Generative | 501 | 668 | |
Table 2 Training and testing data (in pixels).
3 Results and Discussion
3.1 Identification of Galengans
During field visit, there were at least two types of galengan, minor and major galengans. Major galengans usually represent different land ownership, while minor galengans are generally an aide to access field center. Nonetheless, minor galengans also correspond to parcel border in some locations. Following figures present their appearances in WorldView-2 images and corresponding field photographs.
As shown, WorldView-2 data have capability to capture major galengans (width ca. 50-60 cm). Minor galengans, however, require special knowledge on local conditions. Minor galengans could only be identified if the land cover permits; that is clear discrimination of cover types, such as bare soil and preharvest, between adjacent fields. Based on the field information, capability on capturing minor galengans tends to be higher on dry fallow if the planting date between fields is quite similar. At the beginning of a new planting season where the fields are waterlogged, visual identification of minor galengans is fairly difficult. This is quite similar to our experiences using high-resolution imageries such as QuickBird or IKONOS.
Figure 2 Minor Galengans.
Figure 3 Major Galengans.
3.2 Spectral Signatures
During the field visit, data collection was carried out to acquire rice growth status. Whole data were separated into primary and testing data to avoid ambiguities in discrimination. Primary data were employed on spectral signature assessment and classification. Based on primary field data, spectral diversity of various rice growth conditions could be observed (Figure 4).
Using the extracted radiance, it is shown that dried fallow stage could be easily discriminated on all bands, except on yellow and NIR-2 bands. On the preparation of a new planting season, waterlogged rice field was easily observed from the new WorldView-2 band; that is the Coastal band. Similar condition applies to transplanting. In addition, the new yellow band is an advantage as an aid to discrimination of transplanting stage.
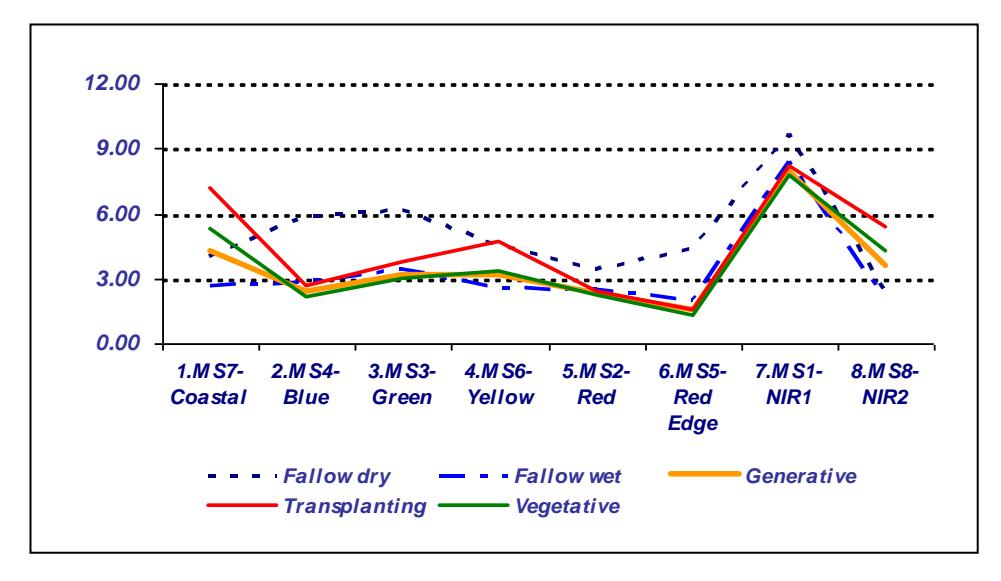
Figure 4 Extracted radiance data.
3.3 Classification Performance
Using primary dataset for training purpose, we found that decision trees derived from CRUISE and QUEST methods are slightly complex than our previous study using Landsat or ALOS AVNIR-2 data. The decision trees are presented in Figure 5 and 6. Meanwhile, Figure 7 shows classified images.
As previously indicated, the role of Yellow Band was obviously important in this case. This is reflected by primary separation node on both algorithms which used Yellow Band as the first discriminator. Separation was further made by inclusion of Red Edge Band mainly to assist discrimination of dry fields. It is shown that addition of Coastal, Yellow and Red Edge Bands in WorldView-2 data delivered enhancements to previous understanding on the problem and therefore opens a better perspective in mapping scheme.
Quantitative assessment on mapping was made through the overall accuracy. Tables 3 and 4 respectively present confusion matrix based on decision tree classifiers computed from testing datasets. The overall accuracy indicates that QUEST was slightly robust than CRUISE. This is fairly consistent with our previous finding using ALOS AVNIR-2 and Landsat TM/ETM [4,6]. Probable cause of slightly moderate accuracies was textural information which has been prominent in high resolution imageries. Despite slight inaccuracies, we found that addition of Yellow, Red Edge and Coastal Bands conveyed a positive role in rice monitoring.
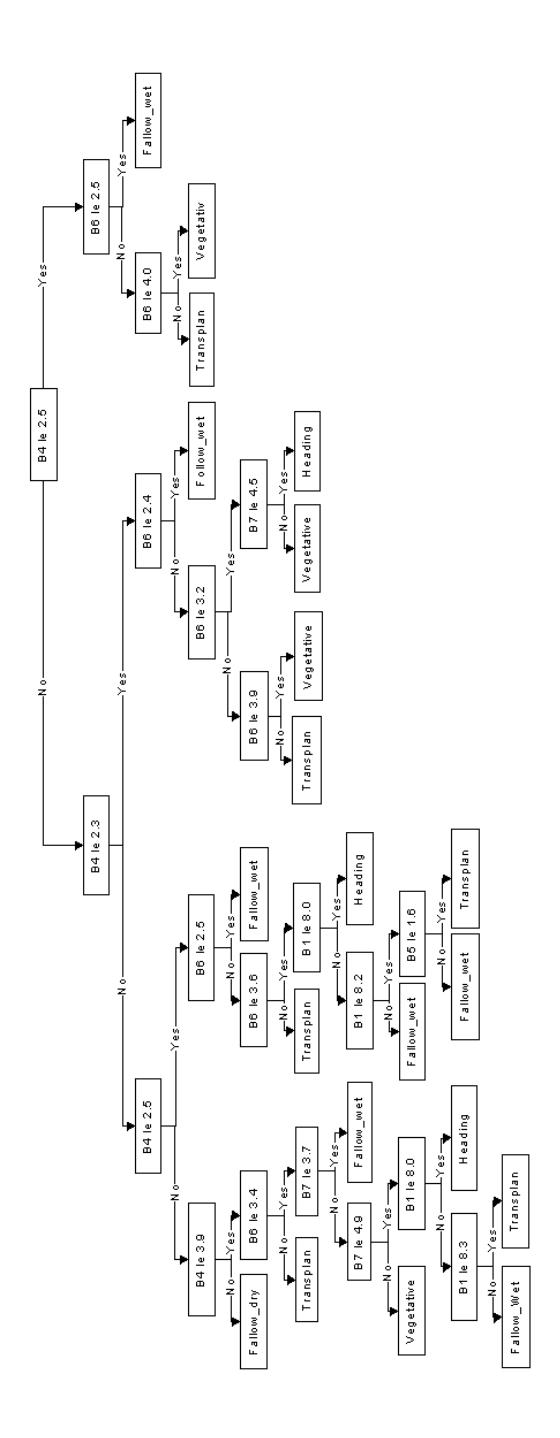
Figure 5 Class discrimination by CRUISE algorithm.
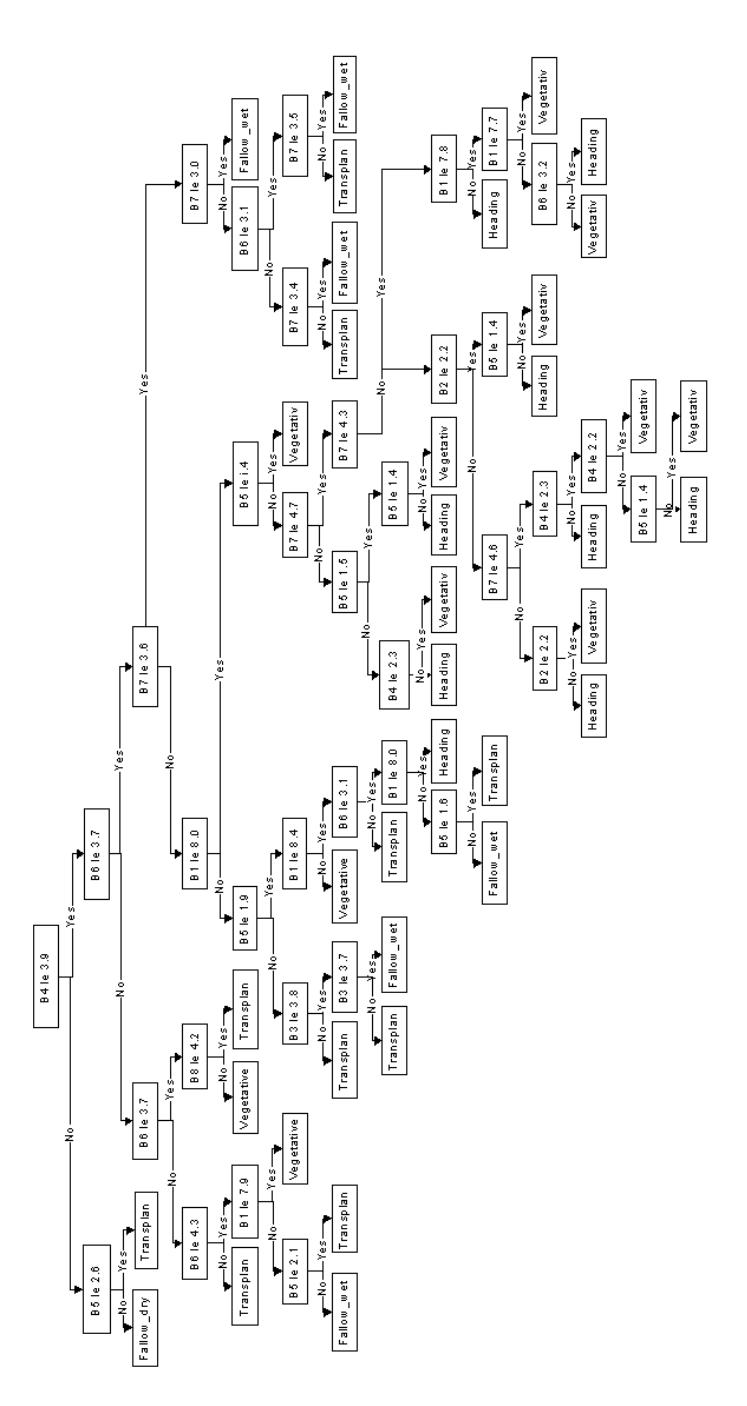
Figure 6 Class discrimination by QUEST algorithm.
Figure 7 Thematic map obtained through QUEST (left), CRUISE (middle) and color composite RGB 643 (right). Color code: fallow-dry=red; fallowwet=green; transplanting=blue; vegetative=yellow; generative=cyan.
Table 3 Confusion matrix of CRUISE. Overall accuracy is 77.00%.
| Ground Truth Data | ||||||
|---|---|---|---|---|---|---|
| fallow_dry | fallow_wet | transplanting | vegetative | generative | ||
| fallow_dry | 100 | 0.29 | 1.92 | 0 | 0 | |
| fallow_wet | 0 | 41.07 | 1.34 | 0 | 2.1 | |
| transplanting | 0 | 51.96 | 96.74 | 0 | 15.12 | |
| vegetative | 0 | 0 | 0 | 100 | 9.58 | |
| generative | 0 | 6.68 | 0 | 0 | 73.2 | |
Table 4 Confusion matrix of QUEST. Overall accuracy is 80.88%.
| Ground Truth Data | ||||||
|---|---|---|---|---|---|---|
| fallow_dry | fallow_wet | transplanting | vegetative | generative | ||
| fallow_dry | 100 | 0.15 | 1.92 | 0 | 0 | |
| fallow_wet | 0 | 50.65 | 3.65 | 0 | 2.54 | |
| transplanting | 0 | 46.78 | 94.05 | 0 | 8.83 | |
| vegetative | 0 | 0 | 0.38 | 100 | 7.34 | |
| generative | 0 | 2.42 | 0 | 0 | 81.29 | |
4 Conclusions
World-View 2 delivers a new insight on rice monitoring problems in Indonesia. The analysis indicated that inclusion of Yellow, Coastal and Red Edge Bands was substantial to discrimination of diverse growth stages. In particular, Coastal band aided separation of waterlogged stage, which indicates the beginning of a new planting season. The Red Edge band was particularly important for dry fallow identification.
Using CRUISE and QUEST decision tree algorithms, we found that sufficient thematic map could be produced. QUEST delivered a slightly better accuracy than of CRUISE, which was consistent to our previous experiments. Accuracy could be improved by insertion of textural information, which has been obvious in high resolution imageries. Implementation of classification algorithms solely based on tonal data is therefore discouraged.
Acknowledgements
The WorldView-2 dataset was obtained from Digital Globe through the 8-band Research Challenge. We would like to express our gratitude to Mr. Ian Gilbert, previously with Digital Globe, for his assistance and helpful initiatives and to Ms. Luluk Handayani who prepared some figures. Field work was partially supported by KKP3T and ALOS PP-2 Projects. We are indebted to Dr. Mahesh Pal and an anonymous reviewer for their careful reading and valuable suggestions to improve the manuscript.