
1 Introduction
Although the main sources of antibiotics are bacteria and fungi, recently there has been interest to look for new bioactive compounds from plants that are capable to partly or completely suppress microbial infections [1]. This approach represents an attractive strategy to control the spread of microbial drug resistance and it could maintain the use of existing antibiotics that are often cheaper and less toxic than new candidate antimicrobials [2]. Curcuma xanthorrhiza Roxb. is one of the herbs that are popular in Indonesian jamus [3]. The rhizomes of this plant have been known to contain terpenoid and curcuminoid compounds [4-10]. Beneficial properties of curcuminoids, such as antioxidant, anti-imflammatory, antitumor, and anticancer effects, have been investigated by many researchers for a long time [11-13]. Recently, interest in terpenoid extract and its major constituent, xanthorrhizol, as antibacterial and antifungal agents has attracted some reseachers [14-18]. These studies were motivated by the fact that synthetic antibiotics, apart from their broad and strong antimicrobial properties, are believed to have long-term side effects. In addition, pathogenic microorganisms are constantly developing resistance to these drugs [19]. As an initial study toward finding new antibacterial compounds from Indonesian plants, the present study reports antibacterial properties of an acetone extract and fractions obtained from the rhizomes of C. xanthorrhiza against eight bacteria, as well as the analysis of their constituents using the NMR method. This the first report of the use of NMR analysis, particularly using TOCSY1D (Total Correlation Spectroscopy One Dimensional) experiments, for identification of the compounds contained in an extract or fractions obtained from rhizomes of C. xanthorrhiza.
Table 1 MIC and MBC values of Cx-TA (acetone extract), Cx-H (n-hexane fraction) and Cx-C (chloroform fraction) against eight pathogenic bacteria.
| Cx-TA | Cx-H | Cx-C | Amox | Chloram | |||
|---|---|---|---|---|---|---|---|
| Bacillus subtilis | MIC | 31.2 | 62.5 | >1000 | 31.2 | 3.9 | |
| (gram +) | MB | 62.5 | 62.5 | >1000 | 62.5 | 3.9 | |
| C | |||||||
| Staphylococcus aureus | MIC | 62.5 | 62.5 | >1000 | 3.9 | 3.9 | |
| (gram +) | MB | 62.5 | 62.5 | >1000 | 3.9 | 7.8 | |
| C | |||||||
| Escherichia coli | MIC | >1000 | >1000 | 1000 | 31.2 | 3.9 | |
| (gram –) | MB | >1000 | >1000 | 1000 | 62.5 | 3.9 | |
| C | |||||||
| Enterobacter | MIC | >1000 | 500 | 1000 | 125 | 15.6 | |
| aerogenes | |||||||
| (gram –) | MB | >1000 | 500 | 1000 | 125 | 31.2 | |
| C | |||||||
| Pseudomonas | MIC | 7.8 | 7.8 | >1000 | 62.5 | 31.2 | |
| aeruginosa | |||||||
| (gram –) | MB | 15.6 | 15.6 | >1000 | 62.5 | 31.2 | |
| C | |||||||
| Shigella dysentriae | MIC | 250 | 250 | >1000 | 15.6 | 3.9 | |
| (gram –) | MB | 250 | 250 | >1000 | 15.6 | 7.8 | |
| C | |||||||
| Salmonella thypi | MIC | >1000 | >1000 | >1000 | 3.9 | 3.9 | |
| (gram –) | MB | >1000 | >1000 | >1000 | 3.9 | 7.8 | |
| C | |||||||
| Vibrio cholereae | MIC | 500 | 250 | 500 | 62.5 | 31.2 | |
| (gram –) | MB | 500 | 500 | 500 | 125 | 31.2 | |
| C | |||||||
MIC and MBC values are in g/mL; Amox = amoxicillin; Cloram = chloramphenicol.
2 Results and Discussion
Extraction of dried powder of C. xanthorrhiza with acetone resulted a dark yellow of gummy material. Liquid-liquid fractionation of the acetone extract into n-hexane, CHCl3, and EtOAc gave a viscous liquid of n-hexane, CHCl3, and EtOAc fractions. The combined weight of the first two fractions showed that practically most of the mass of the extract was soluble in these fractions. Antibacterial activities of the total acetone extract (Cx-TA), n-hexane (Cx-H), and CHCl3 (Cx-C) fractions are presented in Table 1 as MIC (minimum inhibitory concentration) and MBC (minimum bactericidal concentration) values. As shown in the table, except for S. aureus and S. thypi, all the tested bacteria were resistant to amoxicillin, while E. aerogenes, P. aeruginosa, and V. cholerae were not susceptible to chloramphenicol. Treatment with Cx-TA and Cx-H showed that they strongly inhibited the growth of P. aeruginosa at a concentration much lower than amoxicillin and chloramphenicol (MICs 7.8, 7.8, 62.5, and 31.2 g/mL, respectively). The Cx-TA and Cx-H also exhibited potent bactericidal effects on this microorganism (both have an MBC value of 15.6 g/mL). From the MIC and MBC values, Cx-TA and Cx-H showed moderate antibacterial properties against B. subtilis and S. aureus and were inactive against the remaining tested bacteria. Meanwhile, the Cx-C fraction showed no activity against all tested bacteria.
The 1H NMR data of Cx-TA, Cx-H, and Cx-C are presented in Figure 1. Analysis of these spectra showed that α-curcumene (1) and xanthorrhizol (2) were the major constituents in the Cx-H, with a mole ratio of almost 1:1, while no curcumin was detected. The aromatic proton signals of compounds 1 and 2 were easily identified from their multiplicities, while identification of the aliphatic proton signals was aided by the TOCSY-1D spectra, as shown in Figure 2. Through a detailed analysis of the HSQC and HMBC spectra of Cx-H (data not shown), the 1H and 13C NMR parameters of compounds 1 and 2 could be determined (Table 2), thus confirming the identity of these compounds as xanthorrizol (2) and α-curcumene (1), respectively. In addition to these compounds, the Cx-H also contained an unknown terpenoid compound, possibly a monoterpene. Different to the Cx-H fraction, the Cx-C fraction contained curcumin (3) as its main constituent (NMR parameters data not shown). In this fraction, xanthorrhizol (2) was also found, with a 3:2 mole ratio of about 2.3:1. This is the first study to analyze the extract and fractions using extensive 1-D and 2-D NMR methods, including TOCSY1D experiments. The presence of compound 2 in the Cx-H is interesting because an essential oil obtained from the rhizomes of this plant collected from India showed an absence of this compound [14], while a similar oil from Indonesia contained compound 2 as the major constituent [20].
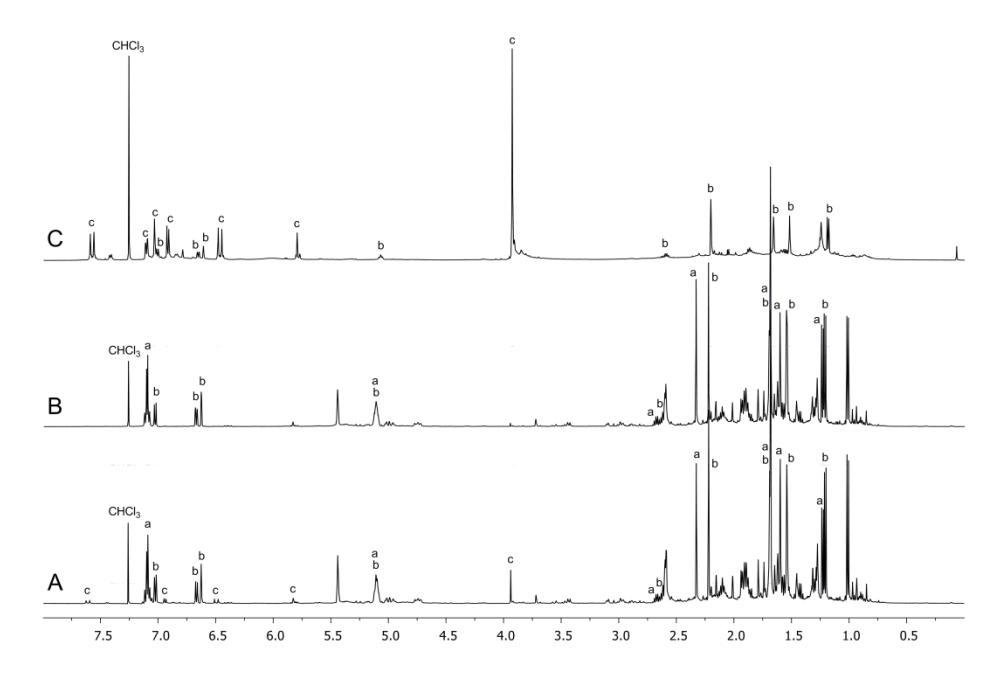
Figure 1 1H NMR spectra of the acetone extract (Cx-TA) (A); n-hexane (Cx-H) (B) and chloroform (Cx-C) (C) fractions of C. xanthorrhiza in CDCl3. a, b, and c are signals due to α-curcumene (1), xanthorrhizol (2), and curcumin (3), respectively.
Biological properties of the extracts and essential oils from C. xanthorrhiza have been studied by many researchers. They include hepatoprotective and antinocetiptive activities [21,22], antihypercholesterolemic and cancer chemoproptective effects [23,24], and antimicrobial properties [14,25,26]. However, in this study the antibacterial activities of an extract and fractions of C. xanthorrhiza against eight pathogenic bacteria were investigated for the first time. The results revealed that only the total acetone extract (Cx-TA) and the nhexane fraction (Cx-H) showed significant antibacterial activities against P. aeruginosa and moderate activities against B. subtilis and S. aureus. Weak or no activity was observed when tested to S. dysentriae, V. cholerae, E. coli, E. aerogenes, and S. thypi. On the other hand, the chloroform fraction (Cx-C) did not exhibit any activity against the tested bacteria, suggesting that the active constituent(s) of the extract is mainly contained in the Cx-H. From NMR analysis of the Cx-H, the active constituent(s) could be either α-curcumene (1), xanthorrhizol (2), or an unidentified terpenoid compound, or a combination of these compounds.
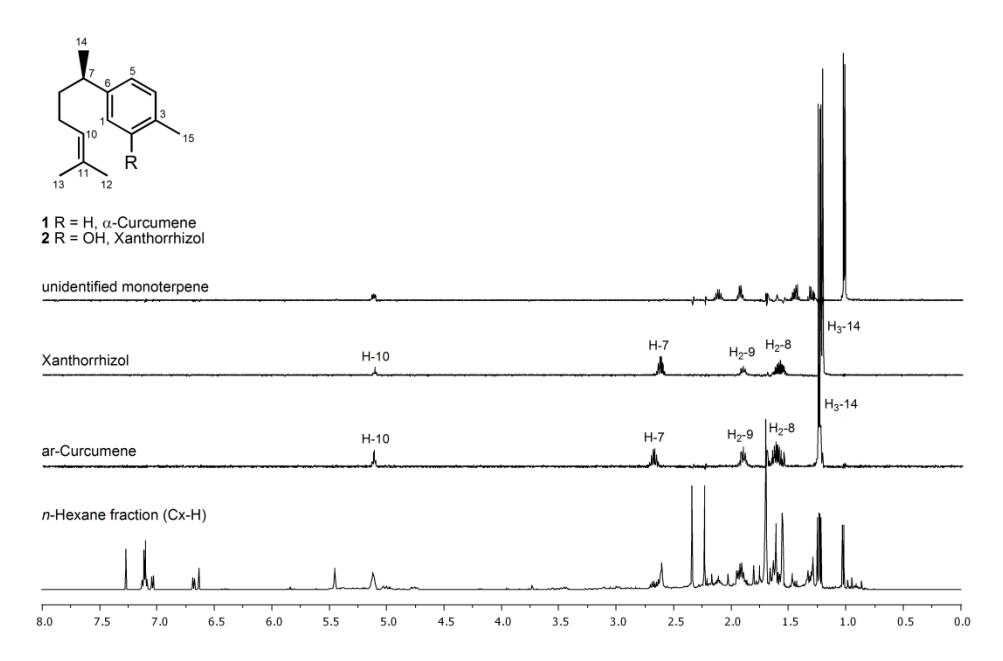
Figure 2 The 1H TOCSY-1D spectra of the n-hexane fraction showing proton signals for α-curcumene (1), xanthorrhizol (2), and an unidentified monoterpene.
To our knowledge the only biological property reported for compound 1 was antitumor activity against Sarcoma 180 Ascities in mice [27]. Its antitumor activity was higher than that of compound 2. However, compound 2 has been studied for a number of biological targets, notably for its antimicrobial [14-18] and anticancer [28-36] properties. In conclusion, this study has shown that the antibacterial capacity of C. xanthorrhiza is contained in the n-hexane fraction. By using an extensive 1-D and 2-D NMR analysis, the major components of this fraction could be identified.
3 Experimental Procedure
3.1 Plant Material
Rhizomes of C. xanthorrhiza were collected from Surakarta, Central Java, Indonesia, on March 2010, and were identified by staff of Herbarium Bandungense, School of Biological Sciences and Technology, Institut Teknologi Bandung.
3.2 Extraction and Fractionation
Dried powder of C. xanthorrhiza (100 g) was macerated with acetone (3 x 24 hours) to give a dark yellow acetone extract (7.3 g) after evaporating the solvent under reduced pressure. The acetone extract (Cx-TA) was partitioned into MeOH-n-hexane (1:1) to give n-hexane and MeOH fractions. The MeOH fraction was further partitioned into water-CHCl3 to give CHCl3 and aqueous-MeOH fractions. The aqueous-MeOH layer was extracted into an EtOAc fraction. The n-hexane, CHCl3, and EtOAc fractions were evaporated under reduced pressure to get Cx-H (5.5 g), Cx-C (1.2 g), and Cx-E (105 mg) fractions, respectively.
Table 2 1H (500 MHz) and 13C (125 MHz) NMR data of α-curcumene (1) and xanthorrhizol (2) in CDCl3
| No C | α-Curcumen (1) | Xanthorrhizol (2) | |||
|---|---|---|---|---|---|
| H (mult., J in Hz) | C | H (mult., J in Hz) | C | ||
| 1 | 7.08 (d, 8.3) | 126.8 | 6.23 (d, 1.5) | 113.5 | |
| 2 | 7.11 (d, 8.3) | 128.9 | - | 153.8 | |
| 3 | - | 135.0 | - | 121.0 | |
| 4 | 7.11 (d, 8.3) | 128.9 | 7.03 (d, 7.6) | 130.6 | |
| 5 | 7.08 (d, 8.3) | 126.8 | 6.67 (dd, 7.6, 1.5) | 119.1 | |
| 6 | - | 144.6 | - | 147.0 | |
| 7 | 2.67 (sext., 7.0) | 39.0 | 2.61 (sext., 7.0) | 39.0 | |
| 8 | 1.68-1.54 (m) | 38.4 | 1.66-1.50 (m) | 38.3 | |
| 9 | 1.85-1.95 (m) | 26.0 | 1.85-1.95 (m) | 26.1 | |
| 10 | 5.11 (tm, 7.0) | 124.8 | 5.10 (tm, 7.0) | 124.5 | |
| 11 | - | 131.0 | - | 131.3 | |
| 12 | 1.69 (brs) | 25.7 | 1.69 (brs) | 25.6 | |
| 13 | 1.60 (brs) | 17.6 | 1.55 (brs) | 17.6 | |
| 14 | 1.23 (d, 7.0) | 22.4 | 1.20 (d, 7.0) | 22.3 | |
| 15 | 2.33 (s) | 20.9 | 2.24 (s) | 15.4 | |
3.3 NMR Analysis
1H, 13C, TOCSY-1D, HSQC-DEPT, and HMBC measurements of the acetone extract, n-hexane-, and CHCl3-fractions were carried out in CDCl3 with an Agilent DD2 spectrometer operating at 500 (1H) and 125 (13C) MHz, using the standard pulses of the spectrometer.
4 Antibacterial Evaluation [37]
The eight strains of bacteria used in this study include two gram-positive bacteria (Bacillus subtilis and Staphylococcus aureus) and six gram-negative bacteria (Escherichia coli, Enterococcus aerogenes, Pseudomonas aeruginosa, Salmonella typhi, Shigella dysenteriae and Vibrio cholerae). These bacterial strains were isolated from clinical samples and were obtained from the Microbiology Laboratory, Health Polytechnique, Cimahi, Indonesia. The bacterial isolate to be tested was inoculated onto a Mueller Hinton Agar (MHA) plate and then incubated for 24 hours at 37°C. The bacteria colonies from the fresh agar plate were transferred into a sterile capped glass tube containing a sterile broth or saline solution (NaCl 0.9% b/v) using a sterile loop or cotton swab and mixed well. The suspension was adjusted to achieve a turbidity equivalent to a 0.5 McFarland turbidity standard. This resulted in a suspension containing approximately 1 x 10⁸ CFU/mL.
4.1 Determination of Minimum Inhibitory Concentration [37]
The minimum inhibitory concentration (MIC) is defined as the lowest concentration at which no visible bacterial growth is observed. Determination of the MIC was executed using broth microdilution according to the method suggested by the Clinical and Laboratory Standards Institute (CSLI) [37]. The samples were dissolved in dimethyl sulfoxide (DMSO). The samples were prepared to achieve 250 µg/mL in the first well. Two-fold dilution of samples was performed in a 96-wells microplate over a range of 1.95 to 250 µg/mL. This was achieved by filling all wells with 200 µL of Mueller Hinton Broth (MHB) medium. Then 200 µL of sample (500 µg/mL) was transferred into the first well. Two-fold serial dilution was performed by transferring 200 µL of the mixture from the first well into the next consecutive well until the end of the row. At the last well, 200 µL of the mixture was discharged so that the total volume solution in each well was 200 µL. Then 10 µL bacterial suspension was transferred into all wells. The microplate was incubated for 24 hours at 37°C. Bacterial growth was determined using a universal microplate reader. For all samples, positive and negative controls were performed in duplicate. The positive controls used in this assay were chloramphenicol and amoxycillin.
4.2 Determination of Minimum Bactericidal Concentration [37]
The minimum bactericidal concentration (MBC) is defined as the lowest concentration at which colonies fail to grow after being incubated. In order to determine the MBC, an aliquot was removed from the wells that showed no bacterial growth and streaked onto an MHA plate and incubated under the same conditions (24 hours at 37°C).
Acknowledgements
The authors are grateful to the Program Riset Desentralisasi, Institut Teknologi Bandung, 2014, for financial support.