
1 Introduction
The spread of the West Nile Virus (WNV) has been reported in Africa, Asia, and Europe for decades, and recently it has been found in North America. It was first discovered in Uganda in 1937 and in Egypt and India in 1950. Causing millions of deaths in birds and a few thousand in humans, WNV has had a tremendous impact on public health policies [1,2].
A report from the US Center for Disease Control and Prevention indicates that there were 62 human cases of encephalitis, including seven deaths in 1999 [3]. WNV is most commonly transmitted to humans by mosquitoes. Until now there has been no medication to treat WNV infection, nor are there vaccines to prevent it. Unfortunately, most people infected with WNV will have no symptoms. About 1 in 5 people who are infected will develop a fever with other
Received September 24th, 2013, 1 st Revision April 24th, 2014, 2 nd Revision October 4th, 2014, Accepted for publication October 6th, 2014.
Copyright © 2014 Published by ITB Journal Publisher, ISSN: 2337-5760, DOI: 10.5614/j.math.fund.sci.2014.46.3.7
symptoms. Less than 1% of infected people develop a serious, sometimes fatal, neurologic illness [2,3].
WNV can infect many species of living beings, such as humans, horses, and also birds, especially chickens [4]. The symptoms of WNV in chickens are not easy to see, but according to Sanne, et al. in [2], most accurate information about WNV activity can be analyzed from infection in chickens. There is an incubation period before chickens can transmit WNV to mosquitoes, i.e. 3-5 days, while the incubation period for mosquitoes is 10-12 days.
Mathematical models have been developed by many different authors to understand the interaction of WNV in animals or humans [5]. A compartment model to describe the interaction between mosquitoes and birds is discussed in Wonham, et al. [6,7]. The basic reproductive ratio of the birds as endemic indicator was shown analytically, without including demographic factors. However, Bowman, et al. in [8] found that the basic reproductive ratio is not sufficient to characterize the dynamics of WNV, they also depend on the initial number of all state variables. A differential equations model with non-delayautonomous approach was constructed by Lord and Day [9-10] in order to understand the impact of bird mortality in WNV transmission dynamics. Special interaction between female mosquitoes and birds was introduced by Cruz-Pacheco [5].
All of the mathematical models from the authors above have represented the spread of WNV between mosquitoes and birds. But according to [2], different from other birds, chickens have their incubation period after they are infected by WNV. Therefore, in this paper we introduce our mathematical model in order to understand the spread of WNV between chickens and mosquitoes. The immune effect in chicken populations is included in the model to give a better understanding of the problem.
This paper is constructed as follows. A host-vector model of WNV transmission is given in Section 2. The basic reproductive ratio and the numerical existence of an endemic equilibrium are discussed in Section 3. A dynamical analysis of the WNV transmission is performed in Section 4, to give a better understanding of the situation in the field. The conclusion is given in Section 5.
2 Host-Vector Model WNV Transmission
We have constructed a SEIR-SEI host-vector model for interaction between chicken and mosquito populations. The host population (chickens) consists of susceptible ( h S ), exposed ( Eh ), infected ( h I ), temporary immune and less
infectious (\(I_{hi}\)), and recovered (\(R_h\)) compartments, while the vector population (mosquitoes) is divided into three compartments: susceptible (\(S_v\)), exposed (\(E_v\)), and infected (\(I_v\)). The transmission scheme is given in Figure 1.
Here, we assume that the total host population \(N_h = S_h + E_h + I_h + I_{hi} + R_h\) and the total vector population \(N_v = S_v + E_v + I_v\) are constant. We give different natural death rates of mosquitoes between susceptible and infected mosquitoes [2]. According to Figure 1 and the parameter descriptions in Table 1, the dynamical equations of WNV transmission are given by System (1).
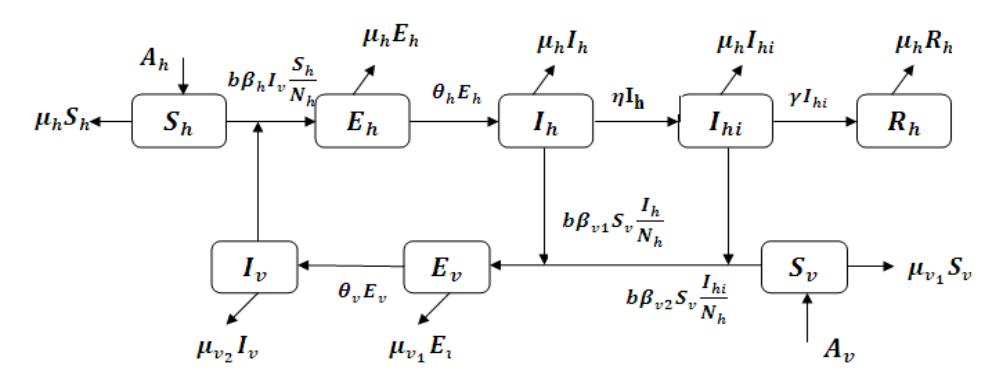
Figure 1 The scheme of host-vector WNV transmission.
WNV transmission model in Chicken-Mosquitoes interaction \[\frac{dS_{h}}{dt} = \mu_{h}N_{h} - \frac{b\beta_{h}S_{h}I_{v}}{N_{h}} - \mu_{h}S_{h} \quad \frac{dS_{v}}{dt} = A_{v} - \frac{bS_{v}\left(\beta_{v_{i}}I_{h} + \beta_{v_{2}}I_{hi}\right)}{N_{h}} - \mu_{v_{i}}S_{v}\] \[\frac{dE_{h}}{dt} = \frac{b\beta_{h}S_{h}I_{v}}{N_{h}} - (\theta_{h} + \mu_{h})E_{h} \quad \frac{dE_{v}}{dt} = \frac{bS_{v}\left(\beta_{v_{i}}I_{h} + \beta_{v_{2}}I_{hi}\right)}{N_{h}} - (\theta_{v} + \mu_{v_{i}})E_{v}\] \[\frac{dI_{h}}{dt} = \theta_{h}E_{h} - (\eta + \mu_{h})I_{h} \qquad \frac{dI_{v}}{dt} = \theta_{v}E_{v} - \mu_{v_{2}}I_{v}\] \[\frac{dI_{hi}}{dt} = \eta I_{h} - (\gamma + \mu_{h})I_{hi}\] \[\frac{dR_{h}}{dt} = \gamma I_{hi} - \mu_{h}R_{h}\] \[(1)\]
Parameters Definition Value(s) Dimension in the models Recruitment rate of chickens day-1 \(A_h\)day-1 Recruitment rate of mosquitoes \(A_{\nu}\)day-1 Biting rate (average number of b \(0 \le b \le 1\)bites per day) day-1 \(0 \le \beta_h \le 1\)Transmission rate from \(\beta_{\scriptscriptstyle h}\)mosquitoes to chickens day-1 Transmission rate from chickens \(0 \le \beta_{v1} \le 1\)\(\beta_{v_1}\)to mosquitoes day-1 \(0 \le \beta_{v_2} \le 1\)Transmission rate from immune \(\beta_{v_2}\)chickens to mosquitoes day-1 0.00014 Natural death rate of chickens \(\mu_h\)\(0.011 \le \mu_{\nu_1} \le 0.05\)Natural death rate of mosquitoes dav-1 \(\mu_{v_1}\)day-1 Death rate of infected \(0.011 \le \mu_{\nu_{2}} \le 0.04\)\(\mu_{\nu_{\gamma}}\)mosquitoes day-1 Transition rate from exposed \(0 \le \theta_b \le 1\)\(\theta_{\scriptscriptstyle h}\)chickens to infected chickens dav-1 \(0 \le \eta \le 0.143\)\(\eta\)Transition rate from infected chickens to immune chickens Transition rate from exposed \(0 \le \theta_v \le 1\)day-1 \(\theta_{.}\)mosquitoes to infected mosquitoes day-1 γ Recovery rate for chickens \(0.015 \le \gamma \le 0.1\)\(N_h\)Population size of chickens \(N_h\)Population size of mosquitoes \(N_{\nu}\)\(N_{v} = \frac{A_{v}}{\mu_{v1}}\)
Table 1 Definition and Parameter Values.
In the next section, we conduct a dynamical analysis to study the dynamics and identify the critical parameters of WNV transmission.
3 Basic Reproductive Ratio
The disease-free equilibrium of the system is given by \(E_0 = \left(S_h = \frac{A_h}{\mu_h}, E_h = 0, I_h = 0, I_{hi} = 0, R_h = 0, S_v = \frac{A_v}{\mu_{v1}}, E_v = 0, I_v = 0\right).\) Because of
\(N_h\) is constant, it means that \(\frac{dS_h}{dt} + \frac{dE_h}{dt} + \frac{dI_{hi}}{dt} + \frac{dR_h}{dt} = 0\). Therefore, from Eq. (1) we obtain \(N_h = \frac{A_h}{\mu_h}\). Meanwhile, the assumption that \(N_v\) is constant, one obtains \(\frac{dS_v}{dt} + \frac{dE_v}{dt} + \frac{dI_v}{dt} = 0\) and the lifetime of infected mosquitoes \(\frac{1}{\mu_{v2}}\) greater than the lifetime of susceptible mosquitoes \(\frac{1}{\mu_{v1}}\) (\(\mu_{v1} > \mu_{v2}\)) obtains \(N_v \ge \frac{A_v}{\mu_{v1}}\). Here, we choose \(N_v = \frac{A_v}{\mu_{v1}}\). We obtain the next generation matrix (see [11],[12]), given as follows:
\[\text{[rumus tidak dapat ditampilkan dengan baik — lihat PDF asli]}\]
The eigen values of NGM are zero of multiplicity 3 and
\[\pm\sqrt{\frac{b^{2}\beta_{h}\theta_{h}\theta_{v}\left(\left(\gamma+\mu_{h}\right)\beta_{\nu_{1}}+\eta\beta_{\nu_{2}}\right)}{\mu_{\nu_{2}}\left(\theta_{h}+\mu_{h}\right) \left(\theta_{v}+\mu_{\nu_{1}}\right) \left(\eta+\mu_{h}\right) \left(\gamma+\mu_{h}\right)}\frac{N_{v}}{N_{h}}}.\]
Therefore the basic reproductive ratio \(R_0\) is given in the form
\[R_0^2 = \frac{b^2 \beta_h \theta_h \theta_v \left( \left( \gamma + \mu_h \right) \beta_{\nu_l} + \eta \beta_{\nu_2} \right)}{\mu_{\nu_v} \left( \theta_h + \mu_h \right) \left( \theta_v + \mu_{\nu_l} \right) \left( \eta + \mu_h \right) \left( \gamma + \mu_h \right)} \left( \frac{N_v}{N_h} \right). \tag{3}\]
As shown in Eq. (3), the basic reproductive ratio of System (1) depends on all parameters of System (1), such as the ratio between mosquito and chicken population, \(\frac{N_v}{N_h}\), the biting rate, and other transition parameters. We obtain that \(E_0\) is locally asymptotically stable if and only if \(R_0 < 1\) by using the diagonal and determinant method (see [13]) from the Jacobian matrix of System (1). Here, the value of \(R_0 < 1\) represents that the new WNV infections produces less than one new infected individual during the infection period, therefore WNV infection cannot spread.
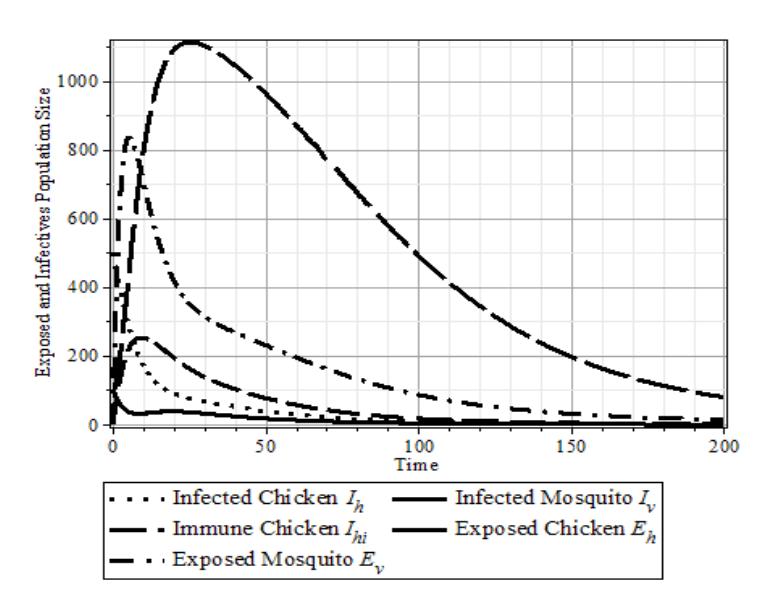
Figure 2 Existence and stability of endemic equilibrium with total population size and vital parameter data set \(\{N_h = 400, N_v = 2000, b = 1, \eta = \frac{1}{7}, \gamma = \frac{1}{10}, \theta_v = \frac{1}{8}, \beta_h = 0.01 \ \mu_{v2} = 0.04, \beta_{v1} = 0.18, \beta_{v2} = 0.1, \theta_h = \frac{1}{4}\}.\)
From numerical simulation we found that \(R_0 = 1.43\) and endemic equilibrium \(E_1 = \{S_{h^*} = 201, E_{h^*} = 1.08, I_{h^*} = 1.9, I_{h^*} = 2.7, R_{h^*} = 193.3, S_{v^*} = 1939, E_{v^*} = 16.9, I_{v^*} = 54.2\}\). We obtained \(R_0 > 1\), it means that the WNV can invade and spread into the chicken and mosquito population. Note that it is not possible to express the endemic equilibrium analytically. The numerical results indicating the stability of the endemic equilibrium are shown in Figure 2.
4 Sensitivity Analysis
We have used the Maple software to show level sets of \(R_0\) for variation parameters such as the lifetime of infected mosquitoes, the lifetime of susceptible mosquitoes, the recovery rate of the chickens, the transition rate from infected chickens to immune chickens, and the effect of different lifetimes of mosquitoes to the change the value of \(R_0\). The first level sets of \(R_0\) in Figure 3(a) show relations between the transition rate from infected chickens to immune chickens \(\eta\) and the death rate of infected mosquitoes \(\mu_{v2}\) for \(\gamma = 0.1\). The second level sets of \(R_0\) in Figure 3(b) show relations between the mortality rate of infected mosquitoes \(\mu_{v2}\) and the recovery rate of the chickens \(\gamma\) for \(\eta = 0.143\). Both figures were obtained from hypothetical data \(A_b = 500\),
\(A_{\nu} = 1000\), b = 1, and the values of the transition parameters from Sanne, et al. [2], namely \(\mu_h = 0.0014\), \(\beta_h = 0.01\), \(\theta_h = 0.25\), \(\mu_{\nu 1} = 0.048\), \(\beta_{\nu 1} = 0.18\), \(\beta_{\nu 2} = 0.1\), and \(\theta_{\nu} = 0.125\).
The third and the fourth level sets of \(R_0\) in Figure 4 are relations between the transition rate from exposed chickens to infected chickens \(\theta_h\) and the transition rate from exposed mosquitoes to infected mosquitoes \(\theta_v\). The level sets of \(R_0\) for \(\mu_{v1}=0.049>0.039=\mu_{v2}\) and the level sets of \(R_0\) for \(\mu_{v1}=0.039<0.049=\mu_{v2}\) are shown in Figure 4(a) and Figure 4(b), respectively. Both figure use hypothetical data \(A_h=10\), \(A_v=1000\), b=1 and the values of the transition parameters from Sanne, et al. [2], namely \(\mu_h=0.0014\), \(\beta_h=0.01\), \(\gamma=0.1\), \(\eta=0.143\), \(\mu_{v1}=0.048\), \(\mu_{v2}=0.039\), \(\beta_{v1}=0.18\), and \(\beta_{v2}=0.1\).
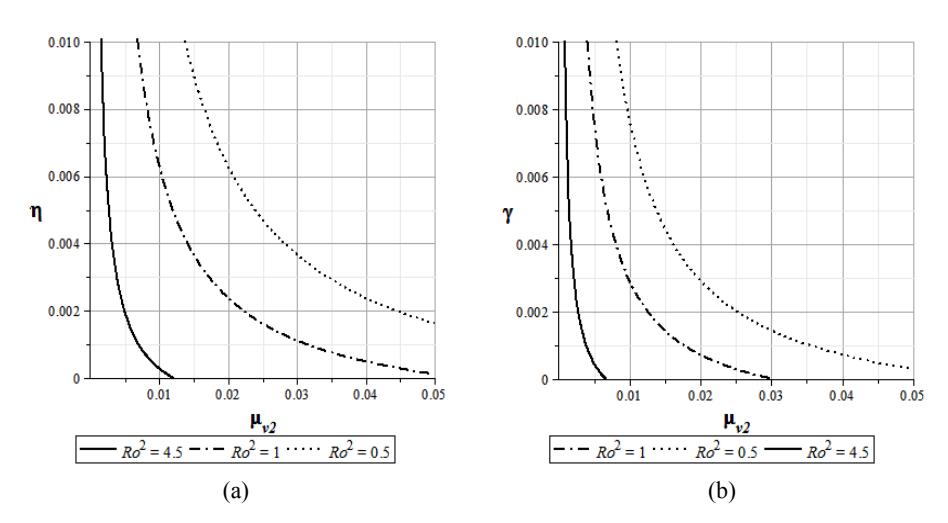
Figure 3 Level sets of \(R_0\) with respect to transition rate from infected chickens to immune chickens \(\eta\) (a), and to recovery rate of chickens to death rate of infected mosquitoes \(\mu_{\nu_2}\) (b).
Figure 3 shows that \(R_0\) decreased faster with the increase of \(\eta\) (see Figure 3(a)) as well as with the increase of \(\gamma\) (see Figure 3(b)). Suitable, from the experimental data in Sanne, et al. [2] shown that the average lifetime of mosquitoes increases due to infection (\(\mu_{v1} > \mu_{v2}\)). Also, we conclude that the basic reproductive ratio may decrease, as shown in Figure 3.
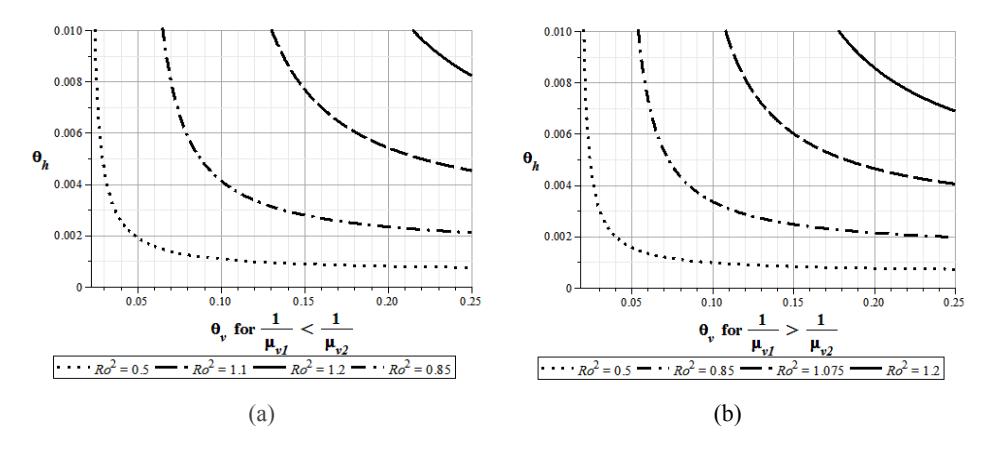
Figure 4 Relation between transition rate from exposed chickens to infected chickens \(\theta_h\), and transition rate from exposed mosquitoes to infected mosquitoes \(\theta_v\).
Next we studied the effect of the ratio between mosquitoes and chickens to the change the value of \(R_0\). Here, we have used parameter values \(\beta_h = 0.01\), \(\beta_{\nu_2} = 0.18, b = 1\), while the others parameter values from Table 1. Substituting these values in Eq. (3), we obtained the value of
\[R_0^2 = 0.64 \frac{N_v}{N_h}. (4)\]
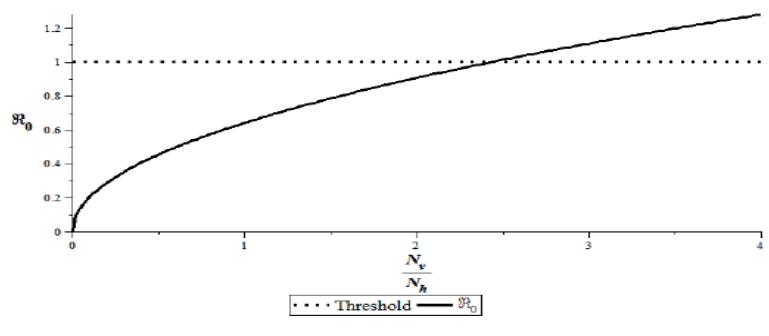
Figure 5 Magnitude of \(R_0\) against ratio \(\frac{N_v}{N_L}\)
From Figure 4, \(R_0^2\) is proportional to the ratio between mosquito and chicken population sizes. From Figure 5, we have \(R_0 \le 1\) for \(0 < \frac{N_v}{N_h} \le 2.24\) in Eq. (5).
It shows that the WNV infection cannot spread. In other words, the WNV will die out if the number of mosquitoes is smaller than 2.24 times the number of chickens. Furthermore, \(\frac{N_v}{N_h} > 2.24\) show the WNV is endemic if the number of mosquitoes is more than 2.24 times the number of chickens. The simulation of the dynamics of \(I_h\), \(I_{hi}\), and \(I_v\) is shown in Figure 6.
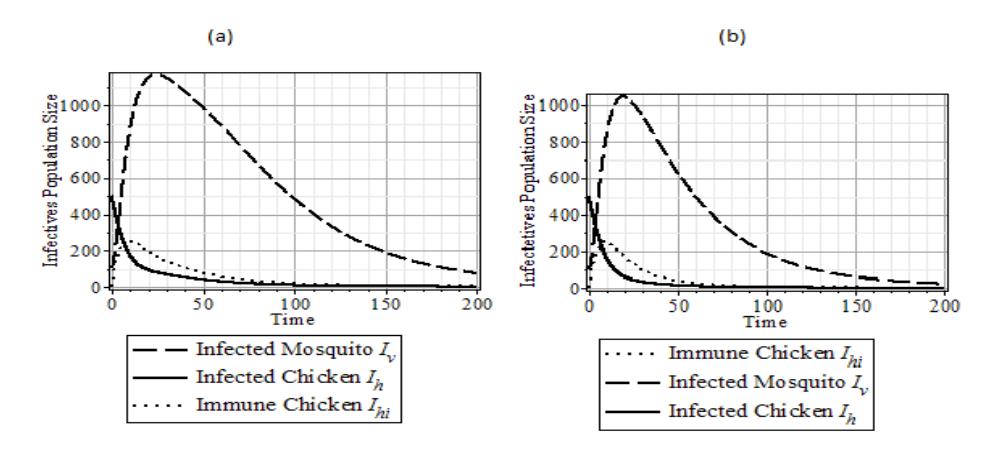
Figure 6 The dynamics of \(I_h, I_{hi}\), and \(I_\nu\) population with the following parameter data set: \(\{N_h = 400, N_\nu = 2000, b = 1, \eta = \frac{1}{2}, \gamma = \frac{1}{2}, \theta_\nu = \frac{1}{2}, \mu_{\nu_2} = 0.04, \beta_h = 0.01, \beta_{\nu_1} = 0.18, \beta_{\nu_2} = 0.1, \theta_h = \frac{1}{2}\}.\) (a) \(\mu_{\nu 1} = 0.049 > 0.039 = \mu_{\nu_2}\), and \(R_0 = 1.43\). (b) \(\mu_{\nu 1} = 0.039 < 0.049 = \mu_{\nu_2}\), and \(R_0 = 1.32\).
Figure 6 shows that the effect of the increased lifetime of WNV infected mosquitoes accelerates the increase of the number of WNV infections at the beginning of the epidemic growth and extends the outbreak period.
5 Conclusion
We have obtained a model for WNV transmission for chicken-mosquito interaction, taking into account two stages of infection before the recovered chickens and the effect of the prolongation of the lifetime of the infected chickens. The numerical results indicate that the increase of lifetime of infected mosquitoes may reduce the basic reproductive ratio.
Acknowledgments
The authors would like to thank ITB Decentralization Research Grant 2012. The authors thank the anonymous reviewers for their very helpful suggestions and comments that helped to improve the manuscript. We would also like to thank the editors for their suggestions regarding the discussion.