
1 Introduction
Several studies on earthquake precursors using geomagnetic data have shown that seismogenic activities can be identified by analyzing the variation of polarization ratio SZ/SH of the ground base magnetometer [1,2]. Various methods for signal processing and spectrum analysis have been applied to indicate the signatures associated with earthquake precursors, such as power spectrum density (PSD) and wavelets in order to analyze the polarization ratio for SZ, SH, SX and SY [3-5]. The connection between earthquake magnitude and epicenter distance to geomagnetic station consistently indicates a relationship which roughly satisfies 0.025R<M-4.5, where R is the epicentral distance [4-6]. This finding is also supported by Febriani, et al. [6], a case study conducted at Pelabuhanratu station on the south coast of Java, which showed correlations between earthquake magnitudes and detectable epicenter distances. This is relevant to the statement of Yumoto, et al. [3], who claimed that ULF emissions should have a proportional relationship to the earthquake magnitude and are inversely proportional to the distance of the earthquake source.
The relationships of earthquake magnitude and hypocenter distance to lead time of ULF emission is an interesting subject to investigate in studying earthquake precursors. In this research, we have investigated these relationships in the case of strong earthquakes that occurred in Sumatra. The geomagnetic station Kototabang (KTB), Sumatra, was utilized for this study, accompanied by two reference stations – Davao (DAV) in the Philippines and Darwin (DAW) in Australia – to ensure that the anomalous ULF emissions were truly earthquake precursors.
Several studies of Sumatran earthquake precursors, among others, [7-9], have analyzed the strong Sumatran earthquakes between 2004 and 2005. They studied the geomagnetic data on the ground-based station of Kototabang with the ground-based reference station of Biak (BIK, Papua Indonesia) as control. Two spectral density methods were used to analyze these earthquakes, i.e.: analysis of spectral density ratio SZ/SY at 32 seconds and a transfer function analysis. Using the analysis of spectral density ratio SZ/SY at 32 seconds, an increase was recorded at 10-40s before the earthquake. Saroso, et al. [9] also showed an anomaly during a series of Sumatran earthquakes through a transfer function analysis and a fractal analysis, which gives strong support to the above results. Mogi, et al. [7] and Widarto, et al. [8] also reported an anomalous earthquake precursor, using geoelectric and geomagnetic data with five cluster magnetotelluric in the Liwa segment at the southern part of the Sumatran fault system. Each reported that during the Bengkulu earthquake in 2000, the magnitude was mb > 4 with a moment magnitude of Mw = 7.9 and a distance > 250 km from the Liwa cluster station. The anomaly precursor that was found
signaled a change in electro-kinetic effect with seismic propagation around 90 s before the event. Referring to the studies of earthquake precursors conducted in Sumatra done by the abovementioned scientists, this study attempted to determine the signs and characteristics of earthquake precursors using ULF emissions in order to see their relationship to the strong earthquakes in Sumatra during 2007-2012. It was expected that the results of this study would determine the relationship between hypocenter distance, earthquake magnitude, and seismic index against lead time of anomalous ULF emissions.
2 Data
We selected 11 strong earthquakes with a magnitude larger than Mw 5 and an epicenter distance less than 550 km to the KTB station during 2007-2012. The selected reference station should cover the recording at a low latitude area, thus providing a better opportunity to observe the characteristic patterns of the ULF emissions. The selection of geomagnetic data related to earthquake precursors was done using data from quiet days. During these quiet days no global geomagnetic disturbance, including solar wind, was expected to have taken place. Two stations from the MAGDAS network, i.e. Davao (DAV, the Philippines) and Darwin (DAW, Australia), were used as reference stations. The investigated earthquakes also took place on quiet days and no earthquakes occurred simultaneously or at about the same time at both reference stations. Based on these criteria, we selected the 11 earthquakes, as listed in Table 1. Epicenter distribution of the selected earthquakes and the location of the KTB, DAV and DAW stations can be seen in Figure 1.
Table 1 Selected Earthquake Events based on the Catalog of the Meteorology, Climatology, and Geophysics Indonesian Agency (Indonesian abbreviation: BMKG) [10].
| Earthquake | Date | Lat. | Lon. | Mag. Mw | Dep th Km | Epic. Dist. (km) | Hypo. Dist. (km) |
|---|---|---|---|---|---|---|---|
| Singkarak | 3/6/2007 | -0.49 | 100.50 | 6.4 | 19 | 79 | 81 |
| Bengkulu | 9/12/2007 | -4.44 | 101.37 | 8.5 | 34 | 526 | 528 |
| Pagai Selatan | 11/10/2007 | -3.28 | 100.53 | 5.9 | 15 | 386 | 386 |
| Pagai Utara | 12/2/2007 | -2.28 | 100.45 | 5.3 | 51 | 275 | 280 |
| Sipirok | 5/19/2008 | 1.64 | 99.15 | 6.0 | 10 | 205 | 206 |
| Hibala | 1/28/2009 | -0.26 | 98.28 | 5.7 | 20 | 233 | 233 |
| Mentawai | 8/16/2009 | -1.48 | 99.49 | 6.7 | 20 | 208 | 209 |
| Padang | 9/30/2009 | -0.72 | 99.87 | 7.6 | 81 | 114 | 139 |
| Siabu | 7/24/2010 | 1.00 | 99.54 | 5.3 | 42 | 124 | 131 |
| Mentawai | 10/25/2010 | -3.61 | 99.93 | 7.8 | 10 | 424 | 424 |
| Kutacane | 6/23/2012 | 3.01 | 97.90 | 6.1 | 95 | 411 | 422 |
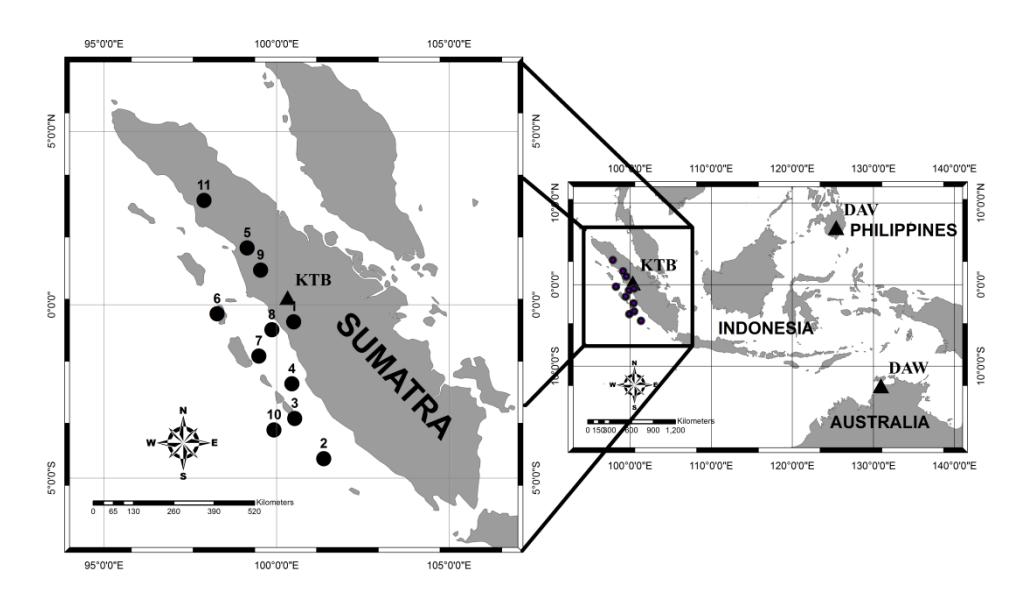
Figure 1 The Sumatran earthquakes represented in the zoomed-in figure in the left panel are possibly associated with ULF-EM during 2007-2012. The earthquake numbers in Figure 1 correspond to Table 1. The right panel shows the locations of geomagnetic station KTB (Kototabang, Sumatra) and the two MAGDAS stations used as reference stations, i.e. DAV (Davao, the Philippines) and DAW (Darwin, Autralia).
The geomagnetic disturbance storm time (Dst) index was used to monitor solar wind activities. The data were obtained from the World Data Center for Geomagnetism (Kyoto University) [11]. If the Dst index reaches -50 nT the event is considered a geomagnetic storm, if it passes -100 nT the storm is considered intense [12]. The global geomagnetic disturbances monitored by the Dst index occurred at a low latitude and served as a reference to determine disturbances and quiet days, in order to find major events that happened during quiet days [9]. Since the variations of geomagnetic disturbances differ around the equator from those at low latitude, strong earthquake data of Mw ≥5.0 around KTB (Kototabang, Sumatra) with a hypocenter distance of ≤550 km on a quiet day were used from the geomagnetic Dst Index. The goal of this technique was to observe the earthquakes when no magnetic storm or sub-storm occurred. For the reference stations, those data from DAV (Davao, the Philippines) and DAW (Darwin, Australia) were selected when no simultaneous or nearby earthquakes occurred at both stations within a radius of less than 550 km from both stations and within a period of ±10 days. Thus, the data from the reference stations were not affected either by global geomagnetic disturbance or seismogenic activity.
The seismic indices (Ks) [13] were used to determine the seismic impact towards the observed geomagnetic stations. The seismic indices represent surface magnitude (\(M_s\)) and hypocenter distance to geomagnetic station (R). The magnitudes and distances were calculated using the following formula:
\[K_s = (1 + R^{-Ms/2})^{-2.33} + \frac{10^{0.75Ms}}{10R}\] (1)
Conversion from moment magnitude \((M_w)\) to magnitude was based on the surface wave \((M_s)\) of shallow earthquake events [14].
For earthquakes less than \(M_w < 6.2\), the following equation was used:
\[M_w = 0.67(\pm 0.005)M_s + 2.07 \text{ for } 3.0 \le M_s \le 6.2\] (2)
For earthquakes with \(M_w > 6.2\) the following equation was used:
\[M_w = 0.99(\pm 0.02)M_s + 0.08 for 6.2 \le M_s \le 8.2\] (3)
3 Methods
3.1 Relevant Methods in Previous Researches
Yumoto, et al. [3] introduced a technique to study earthquake precursors, namely the polarization power ratio \(S_Z/S_H\) in a spectrum frequency period of 10-40 s. This method is used to break down the ULF emissions associated with the earthquake and other noise, such as global geomagnetic disturbances. Hattori, et al. [4] reported that the best frequency to observe seismogenic activity is 0.01 Hz. This was supported by Hirano and Hattori [15] and Han, et al. [16] who studied earthquakes in the Izu and Baso Peninsulas during the year of 2000 using a periodogram to analyze the magnetometer network with a sampling rate of 50 Hz. They also found that a spectrum frequency similar to the one stated above to be a suitable frequency to analyze the polarization ratio to indicate anomalous ULF emissions. To analyze the ULF emission spectrum, this study applied a polarization ratio method using the same frequency domain as in the aforementioned research.
The spectrum frequency that was used by Yumoto, et al. [3] and Hattori, et al. [5] among others, is based on the models built by Molchanov [17] that explicate ULF emission changes related to micro-fracturing with a spectrum frequency of less than 0.1 Hz. Molchanov and Hayakawa [18] explained in their research how to successfully determine the pattern of anomalies caused by geomagnetic disturbances from lithosphere activity [19-22]. Their data show that the polarization power ratio \((S_Z/S_H)\) abruptly decreased from the standard deviation
about one month before an earthquake happened. Prior to the present study, however, no previous research has determined the onset time pattern of anomalous ULF emission precursors.
The magnetometer used in this study had a sampling rate of 1 Hz, which affected the spectrum frequency used to analyze the ULF emission polarization ratio anomalies. The data sampling rate of the instrument was 1 Hz with nyquist frequency \(f_{Nyquist} = \frac{1}{2}v\), where v is the sampling rate, thus the maximum frequency recorded by the magnetometer used in this study was 0.5 Hz. This frequency range matches the research of Yumoto, \(et\ al.\) [3] that used the frequency ranges for the seismogenic effect having a spectrum of 10-45 seconds ranging between 0.1-0.022 Hz. Their results have been corroborated by several other studies, including Ismagulov, \(et\ al.\) [23], who found a spectrum frequency of 0.5-0.0022 Hz. Other research that also used the spectrum frequency in a similar range, below 0.1 Hz, was conducted by Hattori, \(et\ al.\) [20]. Hattori, \(et\ al.\) [21-22] and Han, \(et\ al.\) [16] also reported anomalies associated with the seismogenic ULF emission spectrum to be at f=0.01 Hz, based on research executed on the Izu and Baso Peninsulas in the Kanto region of Japan.
3.2 Polarization Power Ratio Welch Method
In order to gain a smoother quality of the noise power, the polarization ratio Welch method was used in this study. This method applies power spectrum density, which is calculated by overlapping windows and applying fast Fourier transform (FFT) to each segment (called nFFT) using a Hamming window, which is L = N + 1. In this study, the length of the window used was N = 1024.
On the basis of previous research, this study chose a frequency of 0.06 Hz or a period of 16.5 s, which is within the scope of 10-40 s. The signal processing used PSD (power spectrum density), which was analyzed using the power-Welch method (power/frequency). The purpose is to improve the quality of the noise power of the signal analyzed. Assuming that x (n) is a full signal observed along the windows in L; by using the DFT and the signal in frequency domain \(\omega\), the full signal can be written as the following power-Welch formula, as explained by Stranneby [24]:
\[S(\omega) = \sum_{n=0}^{L-1} x(n)w(n)e^{-j2\pi(\omega/\omega_s)n}\] (4)
The power of spectral density is then obtained. \(I_{xx}\) is used as the periodogram if the windows are rectangular.
\[I_{xx}(\omega) = \frac{1}{LU} |S(\omega)|^2 \tag{5}\]
Where U is a normalization factor to reduce bias caused by window w(n)
\[U = \frac{1}{L} \sum_{n=0}^{L-1} \left| w(n) \right|^2 \tag{6}\]
The Welch method is the power value estimation of divided signal window in time signal by the Q value. The Q value is the overlapping of the assumed window.
The condition Q > L therefore is divided by the signal into several segments (P). S is the overlap of segments that can be written in the formula:
\[Q = (P-1)S + L \tag{7}\]
The length of the segment is then expressed in the equation:
\[S^{(p)}(n) = w(n)x(n+pS)\] (8)
With this condition: \(0 \le n \le L\) and \(0 \le p \le P\), in order to gain the Welch equation, Eq. (7) is inserted in Eq. (4), with the DFT approach in each segment, and the following equation is obtained:
\[S^{(p)}(\omega) = \sum_{n=0}^{L-1} s^{(p)}(n) e^{-j2\pi (\frac{w}{w_s})n}\] (9)
With Eq. (2) it can be calculated that the periodogram of each segment p is as follows:
\[I_{xx}^{(p)}(\omega) = \frac{1}{LU} \left| S^{(p)}(\omega) \right|^2 \tag{10}\]
Finally, the Welch equation is determined in the following segment p:
\[I_{xx}^{w}(\omega) = \frac{1}{P} \sum_{p=0}^{p-1} I_{xx}^{(p)}(\omega)\] (11)
The onset time after PSD of each component is determined by spectrum H and Z for every day for six hours in the frequency domain and polarization power ratio pz (\(\omega\)), which is described as follows:
\[pz(\omega) = \frac{S_Z(\omega)}{S_H(\omega)} \tag{12}\] where SZ is spectrum magnitude component Z (vertical) and SH is spectrum magnitude component H (horizontal). The onset time is determined when value pz = SZ/SH has a value of pz + σ and pz - σ.
4 Results and Discussion
From the eleven earthquakes analyzed, four are discussed in this paper, i.e. the Mw = 6.4 Singkarak earthquake of March 06, 2007, at a distance of 81 km from KTB; the Mw = 6.7 Mentawai earthquake of August 16, 2009, at a distance of 209 km from KTB; the Mw = 7.6 Padang earthquake of September 30, 2009, at a distance of 139 km from KTB; the Mw = 7.8 Mentawai earthquake of October 25, 2010, at a 424 km distance from KTB station. For the case of this research, the epicenter distribution of the earthquakes investigated is shown in Figure 2, where each earthquake had a different magnitude and hypocenter distance to the KTB station.
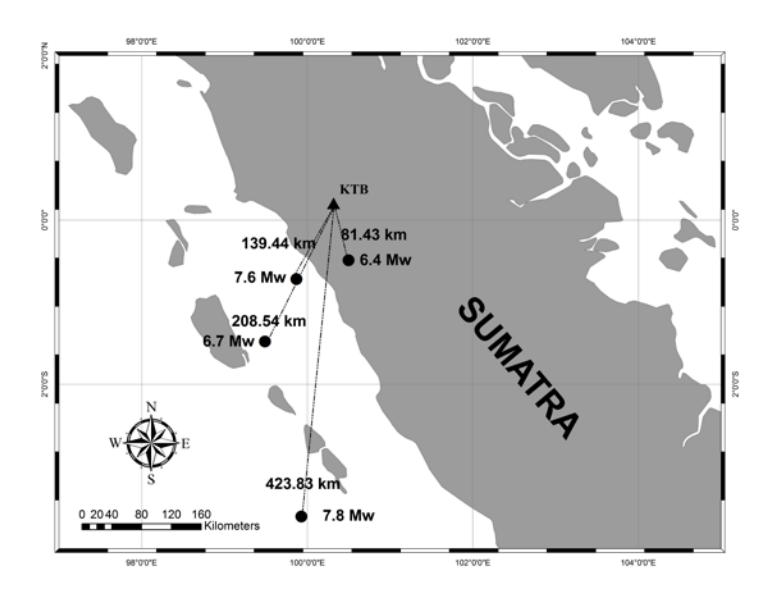
Figure 2 The four earthquakes discussed: the 2007 Singkarak earthquake with Mw 6.4; the 2009 Mentawai and Padang earthquakes with Mw 6.7 and Mw 7.6 respectively; and the 2010 Mentawai earthquake with Mw 7.8. The hypocenter distances of the four earthquakes to the KTB station were respectively: 81.43 km, 209 km, 139 km, and 424 km.
The analysis of the characteristics of the ULF emission anomalies, shown in Figures 3-6, is the result of observation of the same window for 30 days, showing data before and after each event. Earthquake precursor data are expected to appear only at the geomagnetic station nearest to KTB. To ensure that the anomalous ULF emissions were earthquake precursors, the KTB data were compared with geomagnetic data: the Dst index of WDC Kyoto University, which monitors global geomagnetic activities; and from the reference stations of Davao (DAV) and Darwin (DAW). Both reference stations were chosen as they are located far away from the epicenter examined, in areas with few seismic disturbances; they represent earthquake data from around the equator and provide continuous data.
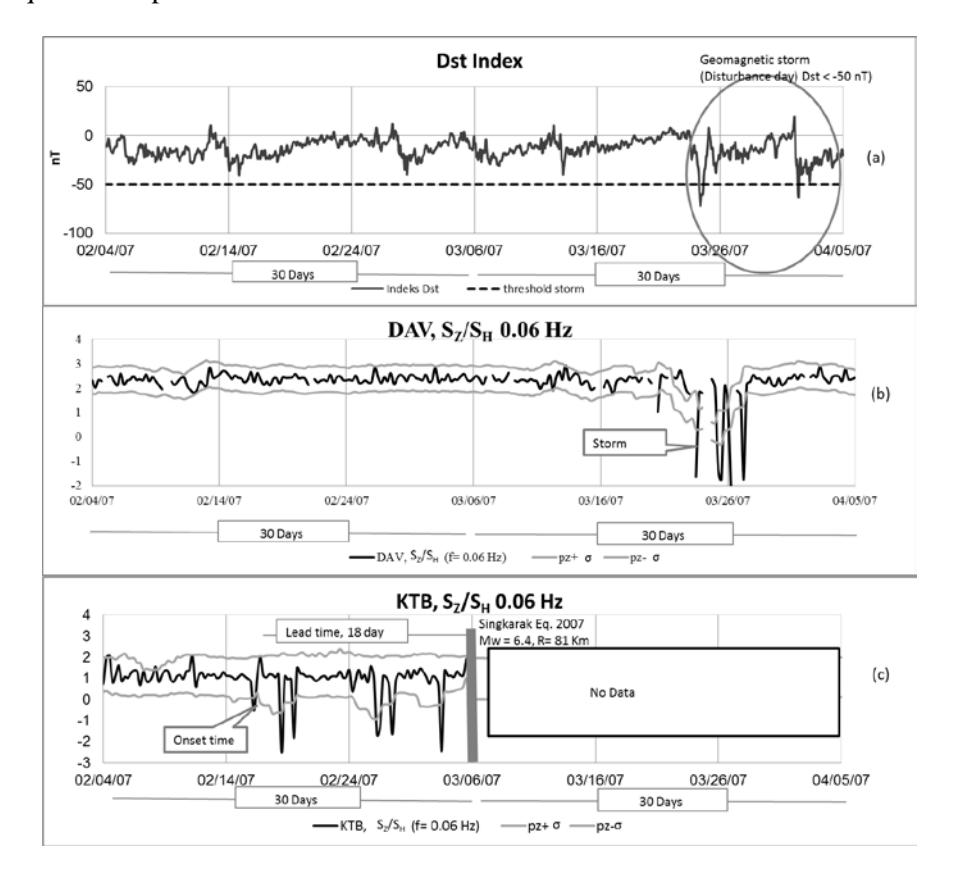
Figure 3 Anomalous ULF emissions of the Singkarak earthquake (March 6, 2007). Panel (a) represents the Dst Index from geomagnetic WDC during quiet days (Feb 06-March 20, 2007). Panel (b): During this period, DAV showed no information of anomalous ULF emission recorded at KTB. The figure only shows a geomagnetic disturbance anomaly (March 26, 2007). Panel (c) represents KTB (black line), showing an anomalous ULF emission with the onset time on February 16. The onset time is shown as the polarization ratio abruptly decreased below the threshold of the standard deviation.
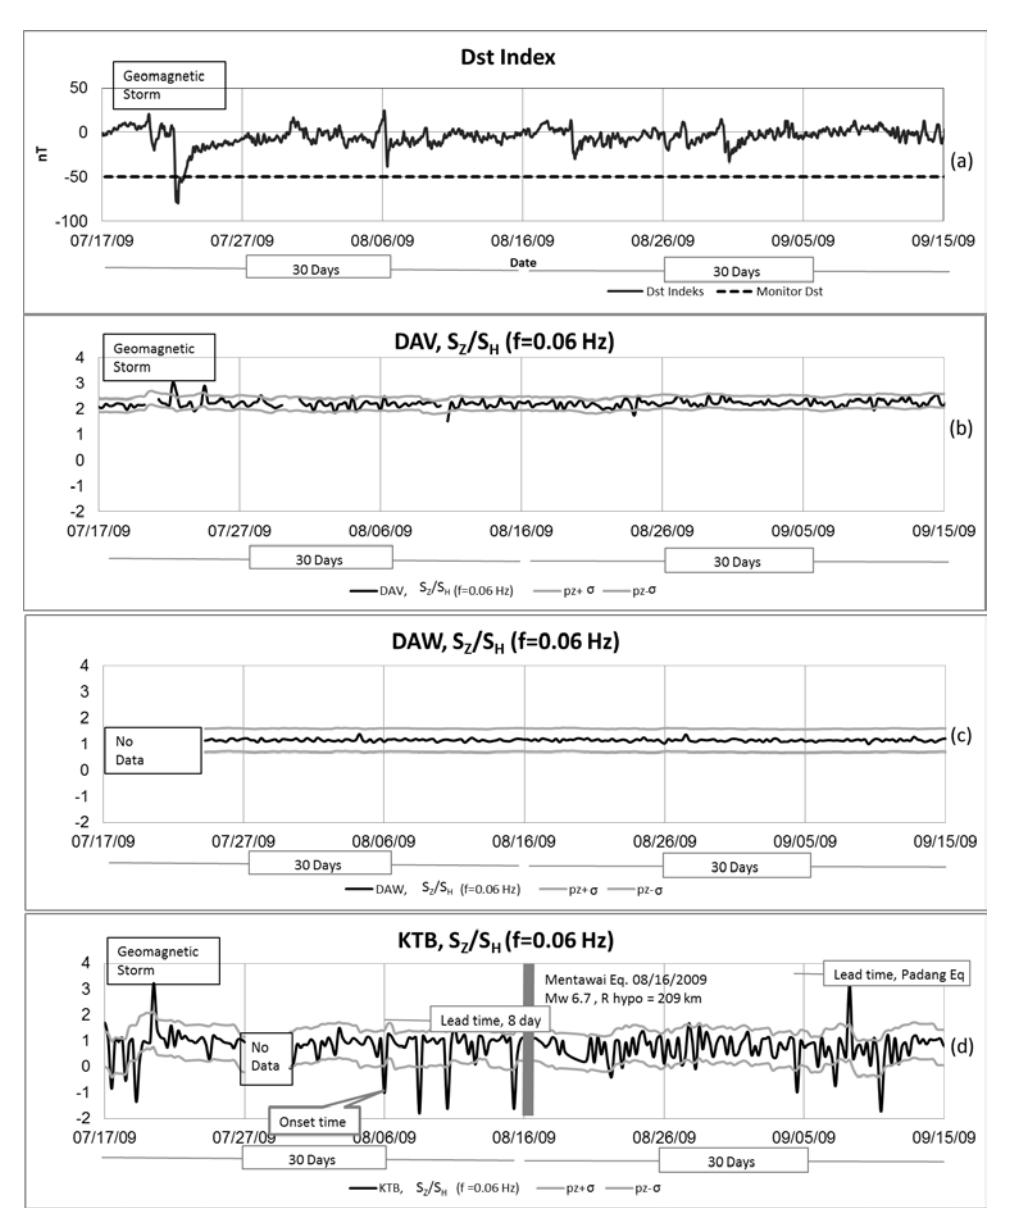
Figure 4 Anomalous ULF emissions of the Mentawai earthquake (Aug. 16, 2009). Panel (a) represents Dst index (July 17-Sept. 15, 2009) during quiet days. Panel (b) and (c) show that the DAV and DAW stations revealed no anomalous ULF emission information. Panel (d) shows an anomalous ULF emission at KTB with the onset time on August 06, 2009. This is seen by the abrupt decrease of the polarization ratio below the threshold of the standard deviation σ, shown as (pz + σ, pz - σ). The lead time was 8 days.
The 2007 Singkarak earthquake (Mw = 6.4) was caused by activities in the Singkarak segment of the Sumatran fault system. The ULF emission lead time had a long period of 18 days until the event (March 06, 2007) due to the close proximity of the earthquake hypocenter to KTB, R = 81 km, with Mw = 6.4 and a seismic index of Ks = 76. The window only showed pre-seismic ULF emission because the geomagnetic data after the main shock were damaged. The KTB data show an anomalous ULF emission with the onset time on Feb. 16, which had a lead time of 18 days prior to the event. These data show that the polarization ratio abruptly decreased below the threshold of the standard deviation = σ, which is shown as (pz+ σ, pz- σ). Due to global geomagnetic disturbances on March 21-April 05, 2007, unfortunately, the data from the DAV geomagnetic reference station showed no anomalous ULF emissions before the event. No data for those dates were available from the DAW station either.
Figure 4 shows the Mentawai earthquake (08/16/2009), with Mw = 6.7, hypo distance R = 209 km, seismic index (Ks) = 51, and lead time = 8 days. This earthquake happened 1.5 months prior to the 2009 Padang earthquake. The anomalous ULF emission of the Padang earthquake is seen here with the onset time on September 4, 2009.
Figure 5 shows the Padang earthquake (09/30/2009), with Mw = 7.6, hypocenter distance R= 139 km, and seismic index (Ks) = 358 from KTB with the onset on September 07, with lead time = 26 days before the earthquake hit. The Padang earthquake was an extremely devastating earthquakes and caused many casualties. The calculation results of the duration of the Padang earthquake show a short duration time of about 10 seconds. This short duration caused a high frequency and produced significant ground shaking in Padang City [25,26]. Information for the Mw 7.8 Mentawai earthquake of October 25, 2010 with hypocenter distance R = 424 km from KTB, and seismic index (Ks) = 59 can be seen in Figure 6. The case of this earthquake is unique because it produced a long rupture duration (~90 s), which resulted in a large tsunami that devastated the island of Pagai on the southern part of the Mentawai islands in Sumatra [27]. The earthquake was interesting to observe because it was very far from KTB (424 km) and had a seismic index of Ks = 59, which indicates that the earthquake was observed from a distance of more than 200 km. A global geomagnetic storm that occurred on October 12-13, 2010 recorded at KTB was also recorded at DAV and DAW as an anomalous ULF emission. The onset of the Mentawai earthquake was on October 14, 2010 and had a lead time of 11 days until the event. The pre-seismic activities had an SZ/SH ratio at the KTB station as shown in Figure 7.
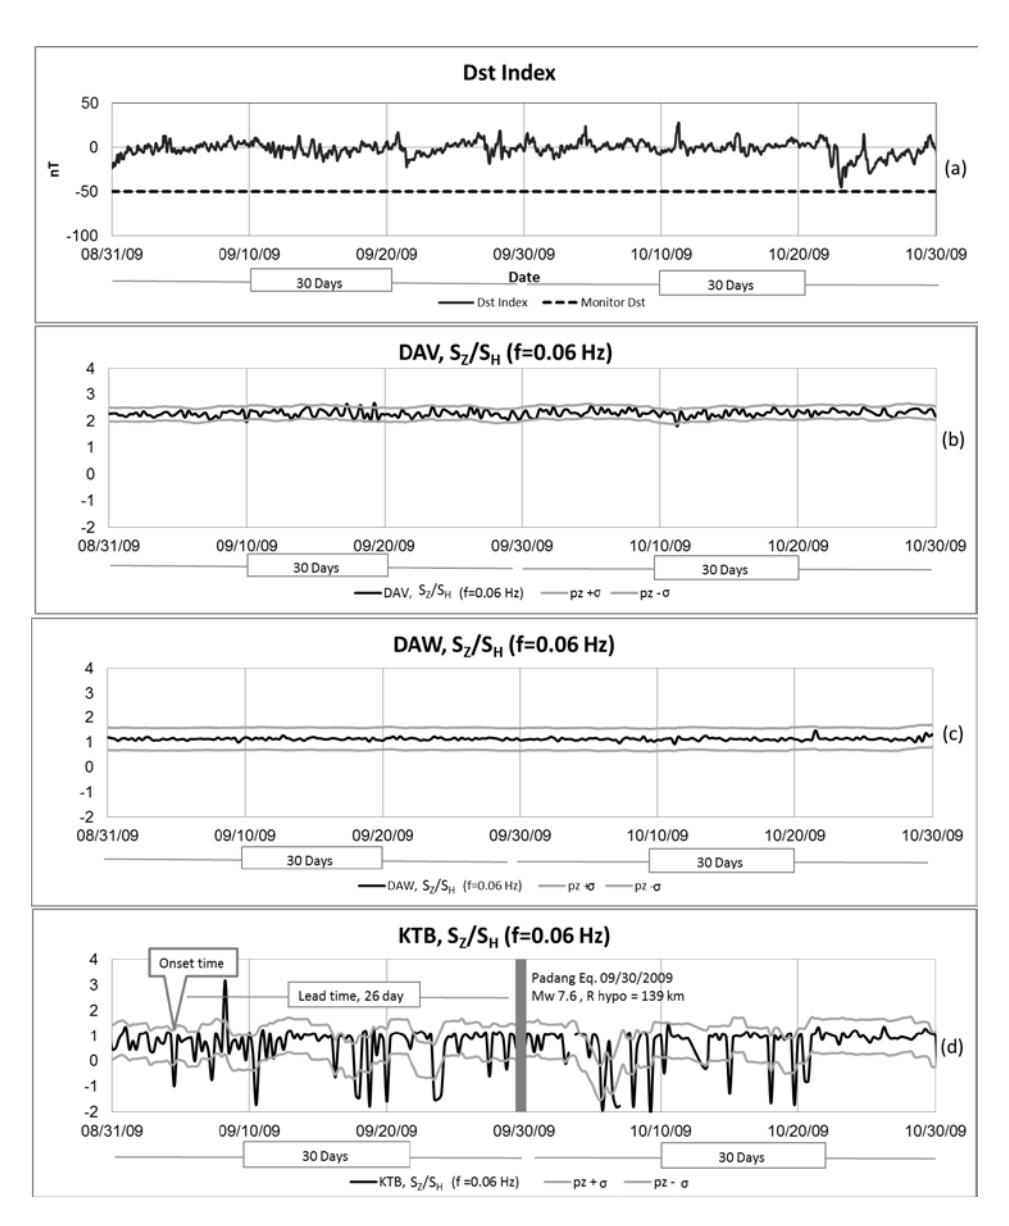
Figure 5 Anomalous ULF emissions of the Padang earthquake (Sept. 30, 2009). Panel (a) represents the Dst index (Aug. 31-Oct. 30, 2009) during quiet days. Panel (b) and (c) show DAV and DAW stations revealed no ULF emission information. Panel (d) shows an anomalous ULF emission at KTB with the onset time on Sept. 04, and lead time = 26 days prior to the event, revealed by the abrupt decrease of the polarization ratio below the threshold of the standard deviation = σ, shown as (pz + σ, pz- σ).
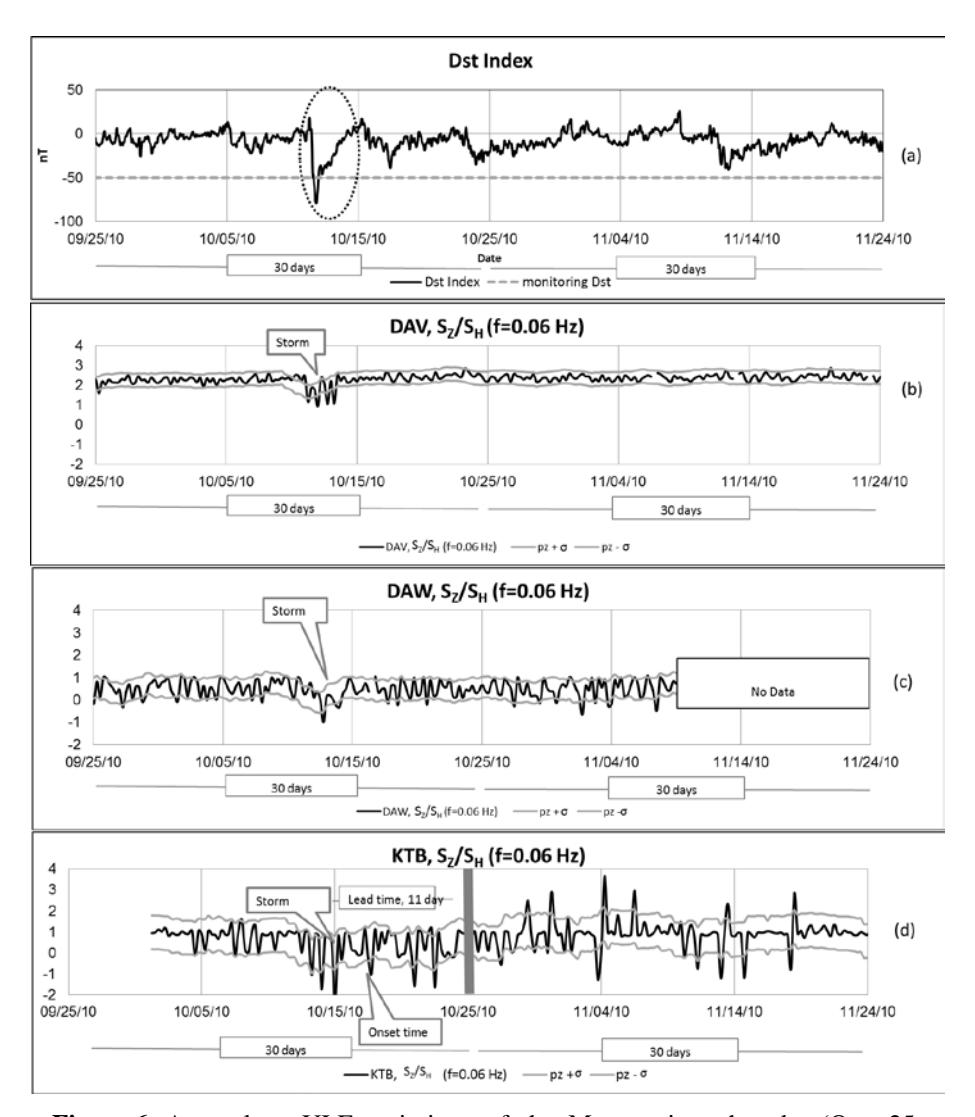
Figure 6 Anomalous ULF emissions of the Mentawai earthquake (Oct. 25, 2010). Panel (a) represents Dst index (Oct. 12-13, 2010), showing geomagnetic storm and anomalous ULF emission responses at all stations: KTB, DAV, and DAW. Quiet days (Oct. 16-Nov. 24, 2010) were recorded. Panel (b) and (c) show DAV and DAW revealed no information of ULF emission. Panel (d) shows an anomalous ULF emission at KTB with the onset on Oct. 17, revealed as an abrupt decrease of the polarization ratio below the threshold of the standard deviation.
An analysis was performed to determine earthquake precursors in Sumatra and its surrounding areas during 2007-2012. Table 2 shows the results of onset time and duration of ULF emissions.
Epic. Hypo. Lead Earth-Depth Seismic Mag. Dist. Date Lat. Lon. Dist. time Mw Index quake km (km) (km) (day) Singkarak 3/6/2007 100.50 6.4 19 79 81 76 18 0.49 Bengkulu 9/12/2007 101.37 8.5 34 526 528 454 18 4.44 100.53 5.9 15 386 386 6 Pagai 11/10/2007 6 Selatan 3.28 100.45 275 280 3 Pagai 12/2/2007 5.3 51 2.28 Utara 1.64 99.15 10 205 206 13 5 Sipirok 5/19/2008 6.0 1/28/2009 233 233 Hibala 98.28 5.7 20 6 6 0.26 8 99.49 208 209 51 Mentawai 8/16/2009 6.7 20 1.48 Padang 9/30/2009 99.87 7.6 81 114 139 358 26 0.72 99.54 Siabu 7/24/2010 1.00 5.3 42 124 131 4 4 Mentawai 10/25/2010 99.93 10 424 424 59 11 7.8 3.61 95 422 6/23/2012 3.01 97.90 6.1 411 Kutacane
Table 2 Results Lead Time (ULF Emission) and Seismic Index \((K_s)\).
Table 2 shows the results of the analytical determination of earthquake precursors with the abovementioned methods. The results show a strong relationship between lead time, earthquake magnitude, and hypocenter distance. This feature is depicted in Figure 7. The top panel (A) shows the relationship between the lead time of the ULF emission with the earthquake magnitude, which shows a positive trend (+) in coefficient correlation of 0.71. The bottom panel (B) shows the correlation between hypocenter distance and lead time, which shows a negative trend (-) in coefficient correlation of 0.2. This means that the lead time of the ULF emission influences the potential magnitude of possible future earthquakes. Figure 7 can be interpreted as follows: if the earthquake magnitude is large and the hypocenter distance is close to the observer station, the lead time period will be longer. Conversely, if the earthquake magnitude is large but the hypocenter distance is far from the observer station, the resulted lead time will be shorter, as exemplified by the Padang earthquake (2009) and the Mentawai earthquake (2010). Both earthquakes had nearly the same earthquake magnitude, but the distances were different; the Padang earthquake was at a distance of 139 km from KTB, while the Mentawai earthquake was at 424 km. This condition resulted in the lead time of the Padang earthquake to be 26 days and the lead time of the Mentawai earthquake to be 11 days. Thus the condition of the ULF emission was controlled by the scale of magnitude and hypocenter distance to the observer
station. Further, the seismic index (Ks) consists of magnitude, depth of the earthquake, and distance to station.
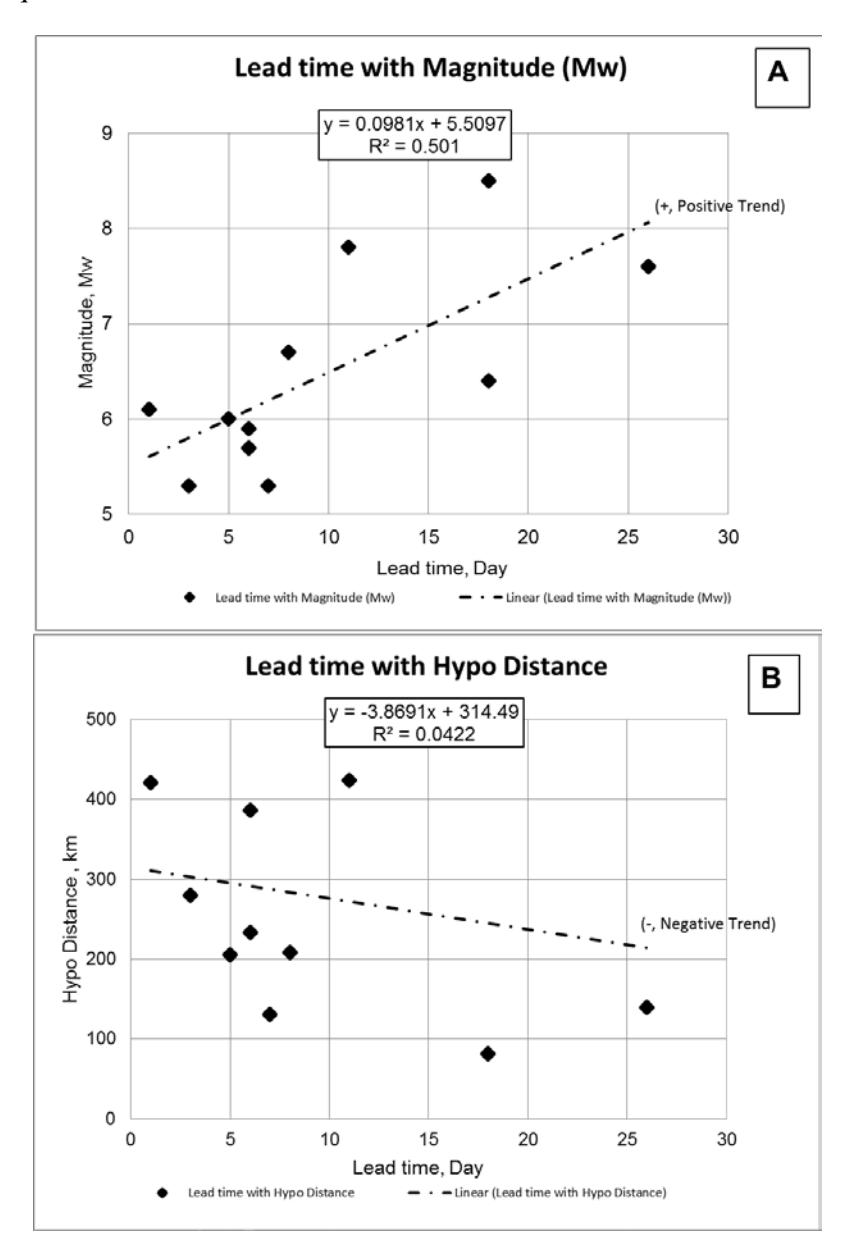
Figure 7 The top panel (A) shows a correlation between lead time of ULF emission and earthquake magnitude (Mw). The lower panel (B) shows a correlation between lead time of ULF emission and hypocenter distance.
5 Concluding Remarks
This study shows the importance of selecting the appropriate reference station as a method to avoid misinterpretation of anomalous ULF emissions caused by global geomagnetic disturbance.
From this study, we can draw several conclusions: (i) Characteristics of earthquake precursors with ULF emission show a strong conviction to indicate a sign of earthquake precursors. (ii) The onset time was determined by the presence of the abrupt decrease of the polarization ratio below the threshold of the standard deviation (pz + σ, pz - σ). (iii) The relationship between magnitude and lead time was a positive (+) trend while the relationship between the hypocenter distance and the lead time was a negative (-) trend. This is demonstrated by trend with the correlation coefficient of each being 0.71 and 0.2.
The results of this research support the results of previous studies about earthquake precursors in Sumatra using anomalous ULF emissions [4,7,8]. This study shows that there is a relationship between earthquake magnitude and hypocenter distance against lead time, further corroborating the findings of Febriani, et al. [6], who state that earthquake precursors can be observed via anomalous ULF emissions. Additionally, this study supports the findings of previous studies that used the statistical superposed epoch analysis (SEA) method, which showed a strong correlation of total TEC anomalies against epicenter distance and earthquake magnitude [22,28].
The relation between an earthquake's magnitude and its epicenter distance to the lead time becomes the fundamental idea behind the explanation for a possible association between the characteristics of ULF emissions and strong earthquakes. This understanding can be a solid basis for developing short-term earthquake predictions using statistical analysis based on earthquake precursors. This is consistent with the statements conveyed by Wang, et al. [29], who analyzed GPS data using Molchan error diagram analysis to identify false alarms [30]. They used statistical analysis of the moving rate variation (MRV) for three different places, i.e. Japan, New Zealand, and California, with shortterm earthquake forecasts. The present results strengthen this view for preseismic activities but not for post-seismic activities. In the future, in order to gain better analysis patterns of earthquake precursors, a geomagnetic cluster network will be used. Control will be done by Molchan error diagrams to detect false alarms. This model of an early warning system for earthquakes will be based on the Sumatran earthquake precursors.
Acknowledgments
The authors would like to thank ICSWSE (International Center Space Weather Science and Education Formerly SERC) Kyushu University Japan for the opportunity to conduct part of the research and for use of the MAGDAS data (JSPS Core-to-Core Program, B. Asia Africa Science Platforms). The authors would also like to thank LAPAN (National Aeronautic and Space Institute, Indonesia) and STEL (Solar-Terrestrial Environment Laboratory) Nagoya University, Japan, for Kototabang geomagnetic data. Grateful acknowledgment is given to BMKG for providing the scholarship for this Ph.D research opportunity at Bandung Institute of Technology. Special thanks to the Alfa editing team for their tireless efforts in improving the English writing quality of this paper.