
1 0BIntroduction
Recent high population numbers and land use changes have had a negative impact on the global environment. In megacities, the high population numbers and the large amount of human activities require new settlements for housing and industrial development. This can lead to environmetal issues such as the heat island (HI) effect, which is known to affect local and regional climates
[1,2]. The HI effect has a more profound impact as well when the anthropogenic heat releases from transportation and settlement energy use become more vigorous on small spatial scales [3,4].
In this perspective, Jakarta must have experienced the HI effect during the last few decades, because there are many human activities that have caused land use conversion from forest to industry and settlement. As both the number of people and their activities are increasing strongly in Jakarta, it follows that land use and cover will change significantly. These changes can alter the local climate due to increasing air temperatures in the region.
Many studies have examined the heat island effect using land use and temperature data. Tokairin, et al. [5] investigated the temperature in Jakarta in the 2000s and the 1970s. They found that the temperature in the 2000s had increased due to urbanization. Tokairin, et al. [6] have studied temperature change during the dry season in 1997-2007 and its relationship with land use changes. The result showed that during the past 30 years the temperature has risen about 1 K. Marpaung [7] utilized MODIS data and air temperature data in Jakarta for the dry season and found that the HI effect is reflected in a difference in maximum land surface temperature between downtown and in the rural areas outside of Jakarta in the range of 14K. Tursilowati, et al. [8] examined temperature data in 1971-2002 from 16 (sixteen) stations and satellite data for 1989 and 2002 and found that high temperatures (more than 30°C) in the city occurred due to significant changes in land use.
All of the abovementioned studies do not reveal the consequences of increasing air temperature trends due to the HI effect on a longer climatic time scale, nor do they meet the emerging need to validate land use and cover changes from satellite images with observational data taken during period of 1997, 2004, 2009, and 2012 from the National Agency of Land (BPN). Therefore, this research had the objective to study the HI effect induced by land use and cover changes in the categories of industry, forest, settlement, water, and open/cleared land that affect the air temperature rise and due to transportation in Jakarta and surroundings using longer time series data, covering about 27 years from the earliest year (1986) to the latest (2012). The ultimate goal of this research was to understand how land use and cover changes and transportation cause the HI effect and, on a longer time scale, the increasing air temperature trend as an important contribution to the local effects of global warming in megapolitan Jakarta. The quantitative information resulted from this study will benefit policy makers to mitigate and adapt to the abrupt changes due to recent negative environmental impacts.
2 Materials and Methods
This study categorizes 3 (three) types of sites of meteorological stations: city (Jakarta, Tanjung Priok, Serang, and Halim), suburban area (Pondok Betung, Cengkareng, Curug), and mountainous area (Bogor and Citeko), see Figure 1. Daily air temperature data were taken from the Agency of Meteorology Climatology and Geophysics (BMKG) from the period of 1986-2008 (23 years) (see Table 1 for names and location coordinates). The land use and cover change data were provided only for the Jakarta region, by the National Agency of Land (BPN), for the years 1997, 2004, 2009, and 2012 (Table 2). The minute data from the automatic weather station (AWS) located in Puspiptek Serpong were used to determine the HI effect on the diurnal temperature range during 2008-2011 and 2013 (5 years).
Figure 1 The left panel shows the study area, which is located in a strong monsoon region, and the right insert indicates the 9 (nine) meteorological stations in Jakarta and surroundings categorized by 3 (three) types of regions: city (1. Jakarta, 2. Tanjung Priok, 3. Serang, and 4. Halim), suburban area (5. Pondok Betung, 6. Cengkareng, and 7. Curug), and mountainous area (8. Bogor and 9. Citeko).
The original land use and cover change data from BPN have 10 (ten) classes. We reclassified them into 5 (five) categories: forest, industry, water, settlement, and open/cleared land, based on the physical similarities of each class using preaggregate and aggregate classification in the ArcView software. Finally, we applied post-aggregate classification to calculate the covered areas (Ha) for each category using the Quantum GIS software. The total coverage changes from year to year were calculated in order to obtain their rate for each area. We also
provide supporting data such as industry and transportation in Jakarta taken from the Center Bureau of National Statistics (BPS), covering 1986-2011.
Table 1 Air temperature data in the city, suburban, and mountainous areas.
| Station Name/ Location | Lat | Lon | Temperature | Remarks | Source |
|---|---|---|---|---|---|
| 1. Jakarta/city | -6.17 | 106,82 | 1986-2008 | Daily | BMKG |
| 2. Tanjung Priok/city | -6.10 | 106,87 | 1986-2008 | Daily | BMKG |
| 3. Serang/city | -6.11 | 106,13 | 1986-2008 | Daily | BMKG |
| 4. Halim/city | -6.27 | 106,88 | 1986-2008 | Daily | BMKG |
| 5. Pondok Betung/suburban | -6.26 | 106,75 | 1986-2008 | Daily | BMKG |
| 6. Cengkareng/suburban | -6.12 | 106,65 | 1986-2008 | Daily | BMKG |
| 7. Curug/suburban | -6.23 | 106,65 | 1986-2008 | Daily | BMKG |
| 8. Bogor/mountainous | -6.50 | 106,75 | 1986-2008 | Daily | BMKG |
| 9. Citeko/mountainous | -6.70 | 106,93 | 1986-2008 | Daily | BMKG |
Table 2 Land use and cover change data.
| No | Year | Area | Source |
|---|---|---|---|
| 1 | 1997 | Jakarta | BPN |
| 2 | 2004 | Jakarta | BPN |
| 3 | 2009 | Jakarta | BPN |
| 4 | 2012 | Jakarta | BPN |
As reported by many meteorologists, Jakarta has dominant monsoon impacts on a seasonal time scale (semi-annual and annual or 6-month and 12-month periodicity, respectively) and these signals dominate the other weaker signals in the time series [9,10]. In order to reveal the air temperature trend, we applied harmonic analysis to remove its dominant seasonal signals from the raw air temperature time series data. Further filtering treatment was performed using the moving average technique to eliminate noise or spike signals that could disrupt the trend calculation. In this paper, we used the 30-day-moving-average applied to the time series data without seasonal signal. Lastly, calculation of the Mann-Kendall statistics was used to obtain the magnitude and significance level of the air temperature trends [1].
Harmonic analysis is a technique to describe functions or signals as a combination of sinusoidal waves. The analysis is derived from Fourier transform as follows:
\[Y(t) = y_0 + \sum_{n=1}^{\infty} Y_n \sqrt{2} \sin(n2\pi f t - \varphi_n)\] (1)
where y0 = amplitude, Yn= root mean square of the harmonic component of n, f = frequency and φn = phase.
In this paper, the seasonal component was removed from the air temperature time series data by applying Eq. (1).
The Mann-Kendall test was used to calculate \(\tau\) and its significance level under the null hypothesis [11]. The formula is written as follows:
\[S = \sum_{n=1}^{n=\infty} \sum_{j=k+1}^{n} sgn(x_j - x_k)\] (2)
The annual values are denoted by \(x_i\) and \(x_k\) in years j and k, where j > k:
\[sgn(x_{j} - x_{k}) = \begin{cases} 1 & \text{if } x_{j} - x_{k} > 0\\ 0 & \text{if } x_{j} - x_{k} = 0\\ -1 & \text{if } x_{j} - x_{k} < 0 \end{cases}\] (3)
when n < 10:
\[VAR(S) = \frac{1}{18} [n(n-1)(2n+5)]\] (4)
Several tied (equal) values sometimes exist for n > 10, so to determine VAR(S), the equation should be written as:
\[VAR(S) = \frac{1}{18} \left[ n(n-1)(2n+5) - \sum_{p=1}^{q} (t_p - 1)(2t_p + 5) \right]\] (5)
The tied group is denoted by q and the total number of data values in group p is denoted by \(t_p\). When we obtain the S and VAR(S) values, we can find the Z value (shown by positive or negative sign) to detect the trend of the time series (increasing or decreasing) and its significance.
\[Z = \begin{cases} \frac{S-1}{\sqrt{VAR(S)}} & \text{if } S > 0\\ 0 & \text{if } S = 0\\ \frac{S+1}{\sqrt{VAR(S)}} & \text{if } S < 0 \end{cases}\] (6)
3 Results and Discussion
3.1 Land Use Changes and Related Impacts in Jakarta
Figure 2 shows an observational thematic map of land use and cover changes in the categories of forest, industrial, water use, people settlement, and open or cleared land at Jakarta in the years of 1997, 2004, 2009, and 2012. The changing areas for 5 (five) variables in every designated year are shown in the bar chart of Figure 3 and their values in Table 3. The average changing rate per year of those 5 (five) variables is tabulated in Table 4.
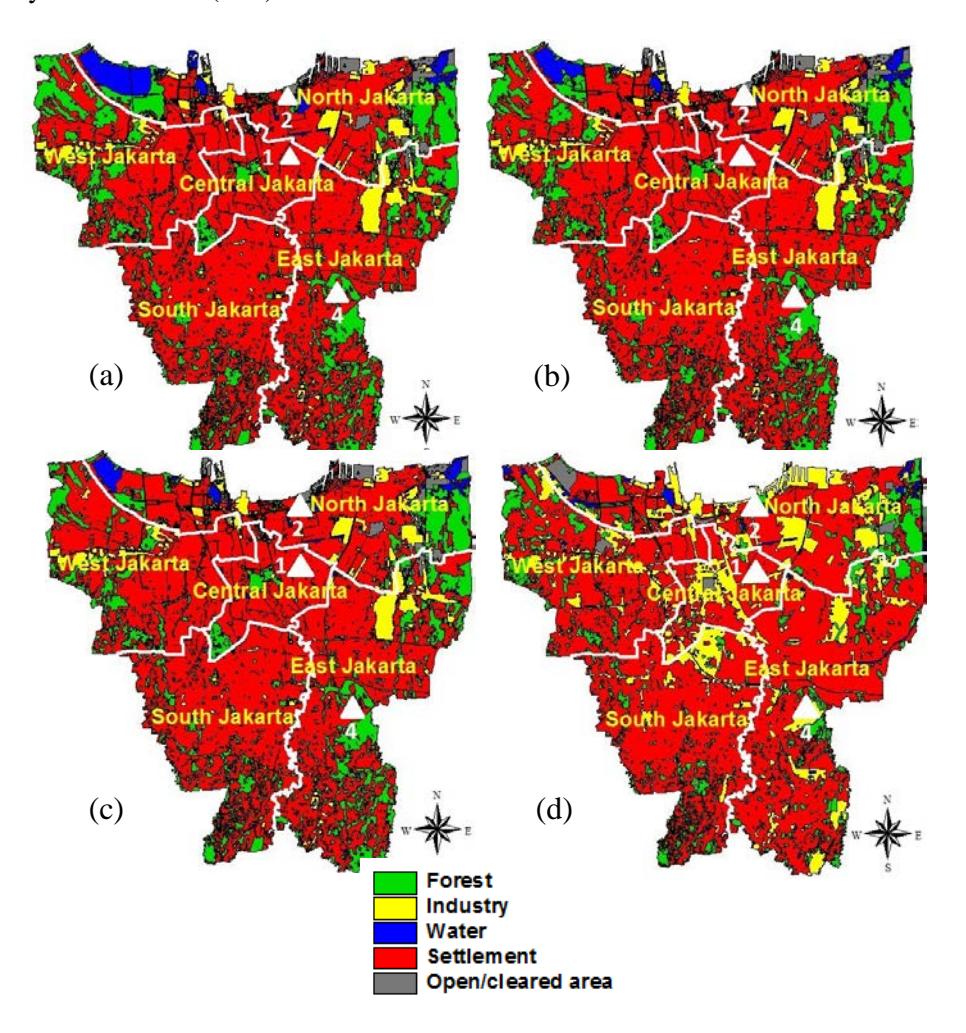
Figure 2 Land use and cover changes over forest, industry, water use, settlement, and open/cleared land in Jakarta in the period of a) 1997, b) 2004, c) 2009, and d) 2012. The variables of the designated areas are shown in the color bar. The 3 (three) white triangles indicate meteorological stations in Jakarta: 1) Jakarta, 2) Tanjung Priok, and 4) Halim.
The results indicate that industrial and settlement areas have increased in 1997- 2012 (16 years) with a growth of rate per year of around 502 ha (calculated from 3865 ha in 1997 to 9900 ha in 2012) and 46 ha (calculated from 42231 ha in 1997 to 43553 ha in 2012), the growth percentage per year being around 9.76% and 0.5%, respectively. The increase of industrial and settlement areas is in accordance with the decrease per year of forest, water use, and open/cleared land of -440 ha (from 15279 ha in 1997 to 9525 ha in 2012), -42 ha (from 2284 ha in 1997 to 1405 ha in 2012), and -74 ha (from 1599 ha in 1997 to 780 ha in 2012), the decrease percentage per year being around 2.5%, 2.5%, and 3.4%, respectively.
Industrial activities supply the largest contribution to the reduction of the coverage area of forest compared to the increased use of land for settlement and decreased areas of water and open/cleared land.
Industry is the most prominent factor in land use change over Jakarta. To see its relation with transportation, we have plotted Figure 4, which shows normalized total metal industry and number of vehicles in Jakarta in 1986-2011 (26 years). Both graphs have significantly increasing trends with some bias for the industry from 1997 to 2011. The bias could come from some errors in the data taking quality, but on the whole, the positive trends are clear in both graphs even though the total number of industries after 1997 does not reflect the industrial expansion causing the relationship bias after that year until 2011. This result implies that both industry and transportation are major factors causing land use changes and air temperature increase, affecting the local climate with warming.
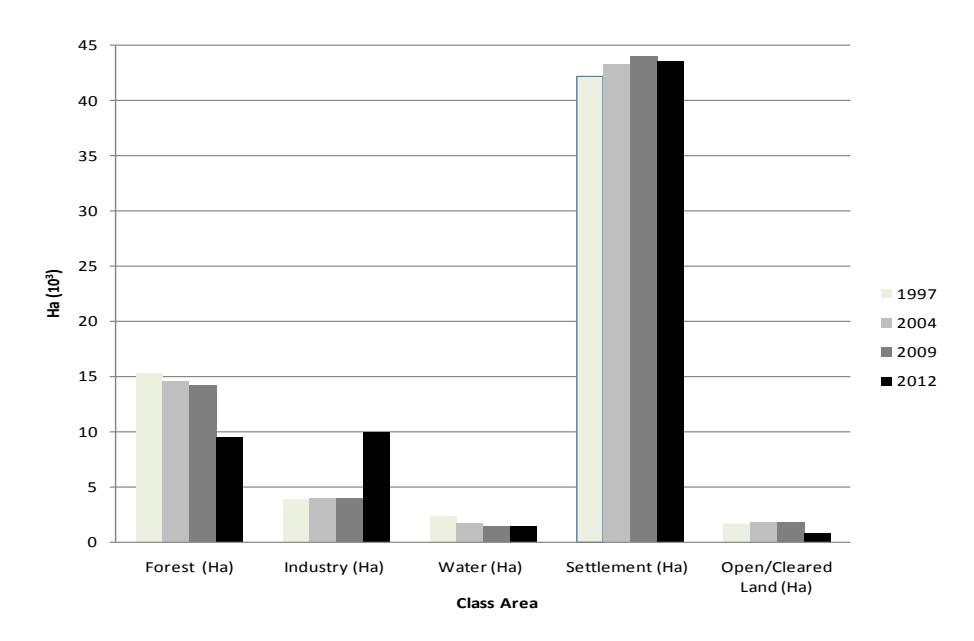
Figure 3 Bar chart of land use and cover changes: forest, industry, water, settlement, and open/cleared land during 1997, 2004, 2009, 2012.
Table 3 Land use and cover changes in Jakarta in 1997, 2004, 2009, and 2012.
| No | Year | Forest (Ha) | Industry (Ha) | Water (Ha) | Settlement (Ha) | Open/ Cleared Land (Ha) |
|---|---|---|---|---|---|---|
| 1 | 1997 | 15279 | 3865 | 2284 | 42231 | 1599 |
| 2 | 2004 | 14630 | 3883 | 1656 | 43349 | 1741 |
| 3 | 2009 | 14181 | 3883 | 1480 | 43982 | 1732 |
| 4 | 2012 | 9525 | 9900 | 1405 | 43553 | 780 |
Table 4 Land use and cover change rate in Jakarta in 1997, 2004, 2009, and 2012.
| Year | Forest | Industry | Water | Settlement | Open/ Cleared |
|---|---|---|---|---|---|
| (Ha/year) | (Ha/year) | (Ha/year) | (Ha/year) | Land (Ha/year) | |
| 1997- 2012 | -440 | 502 | -42 | 46 | -74 |
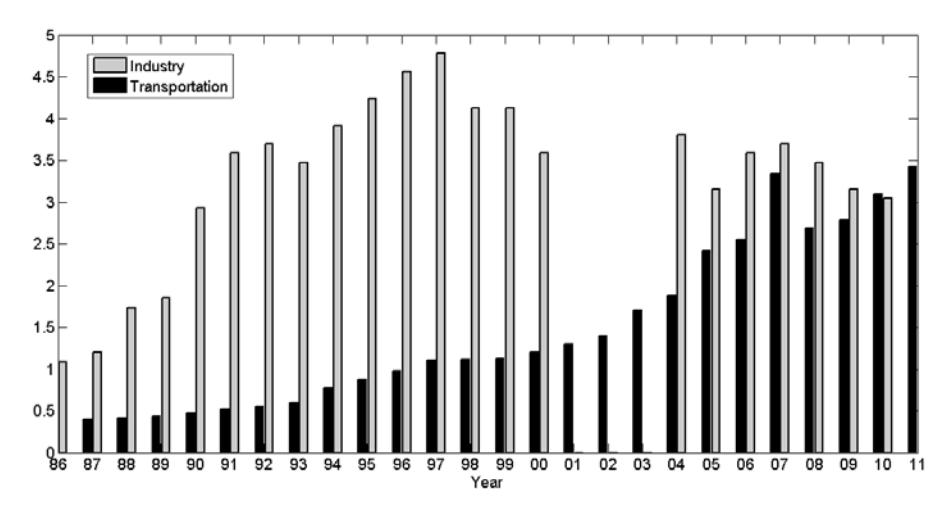
Figure 4 Normalized total number of industries and number of vehicles in Jakarta, 1986-2011.
3.2 Air Temperature Trend
Merkin [12] defined the HI effect as a contrasted difference between air temperature in the morning and its peak in the afternoon of about 3-5°C. We have plotted the snapshots of hourly averaged data from May in 2008-2011 and 2013 (see Figure 5) and found the temperature ranging by about 7°C, from 25°C in the morning at 6.30 am to 32°C at noon at 12.00. It is clear that Serpong recently has shown prominent evidence of the HI effect.
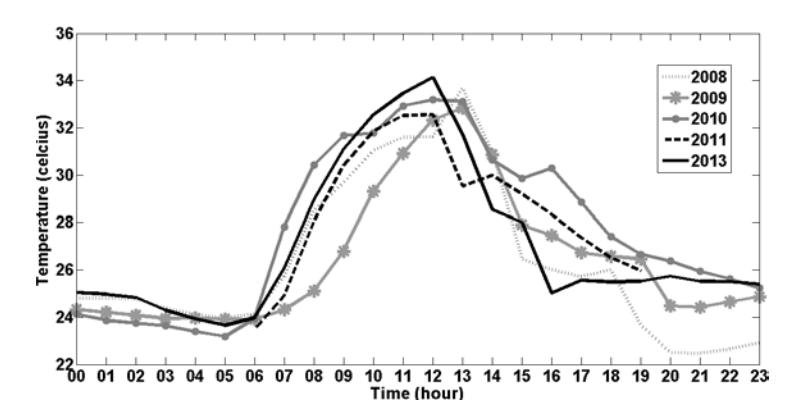
Figure 5 Snapshots hourly averaged air temperature in May at Puspiptek Serpong in 2008-2011 and 2013.
The HI effect should be reflected in an increasing air temperature trend in this region [13]. Here, we examined 9 (nine) meteorological stations in Jakarta and surroundings, including rural and mountainous regions, as shown in Table 1. Figure 6(a) illustrates raw time series data of air temperature at Jakarta station superimposed on the combined seasonal components of semi-annual and annual signals.
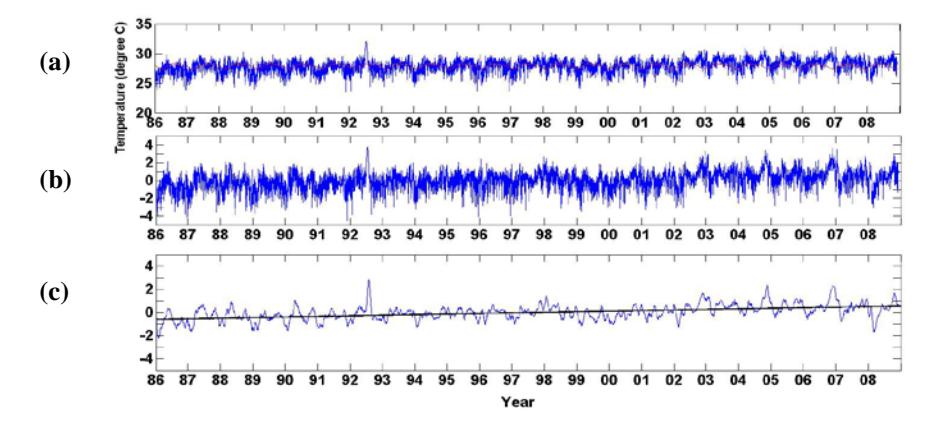
Figure 6 Air temperature time series data at meteorological station Jakarta in 1986-2008 (23 years) a) with seasonal component of semi-annual and annual signals superimposed, b) with seasonal component removed, and c) with the 30 day moving average applied. The trend equation, y = 0.117 x -0.58 with a significance level of 95% was tested by the Mann-Kendall method.
The time series does not clearly expose an increasing trend, so the seasonal component needed to be extracted from the data using harmonic analysis in order to capture the positive trend as shown in Figure 6(b). It became more significant after we took the 30-day moving average as given in Figure 6(c), which gives the linear equation of y = 0,117 x -0.58 within a significance level of 95%.
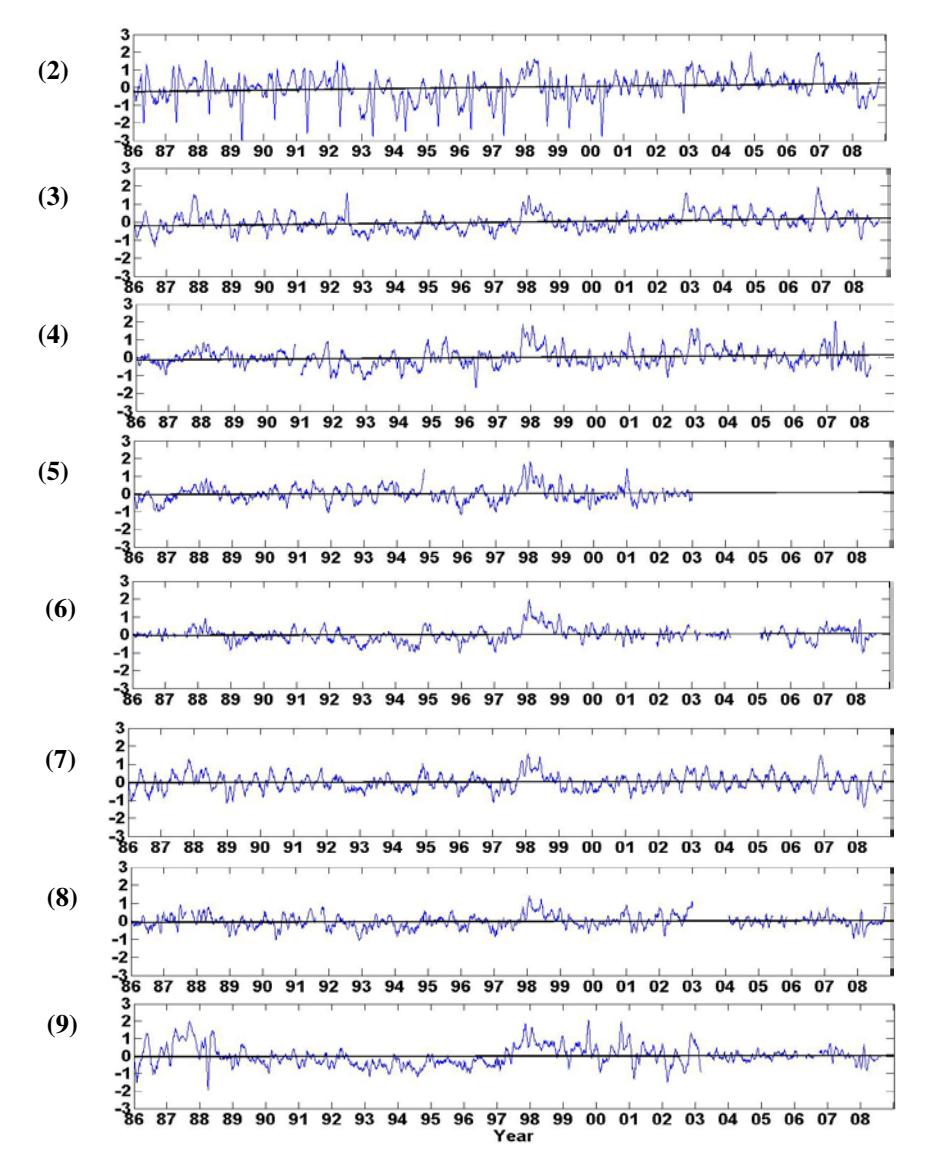
Figure 7 Air temperature time series after extracting the seasonal component and applying the 30-day moving average at meteorological stations of 2) Tanjung Priok, 3) Serang, 4) Halim, 5) Pondok Betung, 6) Cengkareng, 7) Curug, 8) Bogor, and 9) Citeko.
Figure 7 gives a sequence of air temperature series after extracting the seasonal component and applying the 30-day moving average at meteorological stations of Tanjung Priok, Serang, Halim, Pondok Betung, Cengkareng, Curug, Bogor, and Citeko. The linear equation trend for each station is tabulated in Table 5.
The linear trend for air temperature in Jakarta had the highest increase rate (0.051°C/year), followed in sequence by Tanjung Priok (0.021°C/year), Serang (0.018°C/year), Halim (0.012°C/year), Pondok Betung and Cengkareng (0.006°C/year), Curug (0.005°C/year), and Bogor with the slowest rate (0.004°C/year). It is noted here that Citeko did not show a linear trend as it was tested insignificant by the Mann-Kendall method.
| Station Name | Z | pz | pz| Trend | Type Sig. | Test Trend | Equation Temp | .Rate |
|---|---|---|---|---|---|---|---|
| 1. Jakarta | 49.39 | 1,96 | significant | increasing | 95% | y=0,117x-0,58 | 0,051 |
| 2. Tanjung Priok | 18,31 | 1,96 | significant | increasing | 95% | y=0,049x-0,25 | 0,021 |
| 3. Serang | 25,54 | 1,96 | significant | increasing | 95% | y=0,041x-0,21 | 0,018 |
| 4. Halim | 6,58 | 1,96 | significant | increasing | 95% | y=0,027x-0,13 | 0,012 |
| 5. Pondok Betung | 2,87 | 1,96 | significant | increasing | 95% | y=0,011x-0,058 | 0,006 |
| 6. Cengkareng | 4,65 | 1,96 | significant | increasing | 95% | y=0,014x-0,066 | 0,006 |
| 7. Curug | 5,20 | 1,96 | significant | increasing | 95% | y=0,045x-0,243 | 0,005 |
| 8. Bogor | 2,89 | 1,96 | significant | increasing | 95% | y=0,01x-0,056 | 0,004 |
| 9. Citeko | 1,56 | 1,96 | not significant | no trend | - | - | - |
Table 5 Linear equation for the air temperature trend.
Remarks: Sig = significance, Temp = temperature
3.3 Discussion
The industrial sector is the most dominant driving forcing behind land use changes over Jakarta and surroundings, with an increasing growth rate per year of around 502 ha from 1997 to 2012 (16 years), its percentage rate being about 9.76%. The industrial areas are most dominantly concentrated in the eastern part of the Jakarta region since the earliest observation used in this study in 1997, which did not change much until 2009 when it surprisingly increased very rapidly in the new industrial district of western Jakarta (marked yellow in Figure 2) with an increasing rate of 155% over 4 years until 2012. This implies a dramatic change in land use by industry from 2009 until recently, with a growth rate per year of about 38.8% compared to the insignificant change in increase rate of 0.04% during the previous 11 years, from 1997 to 2009.
The industrial coverage area expansion that occurred after 2009 has a strong relation with the deforestation in this region. The decrease rate of forest coverage areas per year from 1997 to 2012 (16 years) was 440 Ha, which corresponds with a decrease rate per year of 2.5%. Deforestation had a similar change pattern in land use as the industrial area expansion, with a slow decrease rate of 7% from 1997 to 2009 (13 years) but a rapid decrease rate of 33% from 2009 to 2012 (4 years), which corresponds with a decrease rate of 8.3% per year. We can infer that the decrease rate of 7% during the 16 years of observation used in this study was still lower than the decrease rate of 8.3% per year from 2009 to 2012. Since 2009, deforestation has resulted in a dramatic land use change similar to the growth of industrial areas, predominantly in the eastern part of Jakarta and new expanding areas in the western part of Jakarta, as well as northern and southern Jakarta.
The growth rate of industrial areas that occurred after 2009 had a parallel in the increase of settlement areas, which had a growth rate per year of 0.2%. This explicitly shows that industrial expansion is the more prominent factor in land use change in Jakarta and surroundings compared to new residential settlements.
The expanding areas of industry and settlement are in accordance with the decrease rate per year of water and open/cleared land areas with the same levels of change of 42 ha (2.5%) and 74 ha (3.4%), respectively, but these land use changes are secondary compared to those of the industrial and forest categories. Except for water, the open/cleared land coverage areas follow the spatial distribution changes of industrial expansion and deforestation with a decrease rate during the past 4 years (2009-2012) of around 55%, corresponding with a 13.8% decrease per year.
The land use changes that were dominantly affected by the industry, deforestation and settlement categories had a strong relation with the increasing trend in the transportation sector, as shown in Figure 4. These changes had a significant impact on the HI effect in Jakarta and surroundings, with a simple snapshot of hourly averaged temperature data at Puspiptek, Serpong in May from 2008 to 2013 recording a remarkable temperature difference from morning to noon of around 7°C, which is higher than the HI range of 3-5°C as mentioned by Merkin [12] (see Figure 5). The simplified calculation of this temperature difference as a signal of HI impact is quite straightforward, but the 7°C has a big influence on the increasing temperature trend on a longer climatic time scale. We can expect that using more comprehensive calculations and removing the bias signals from the temperature data covering 2008-2013 (5 years) the result will be smaller but still within the range of the HI indicator as defined by Merkin [12].
An impact of the HI effect on the increasing temperature trend on a longer climatic time scale has clearly occurred: the increase rate was around 0.051°C/year, 0.021°C/year, 0.018°C/year, 0.012°C/year, 0.006°C/year, 0.006°C/year, 0.005°C/year, and 0.004°C/year in the meteorological stations of Jakarta, Tanjung Priok, Serang, Halim, Pondok Betung, Cengkareng, Curug, and Bogor, respectively. Citeko did not a show a significant linear trend according to the Mann-Kendal test. The results imply that Jakarta experiences the most HI impact, which could raise the temperature with 5.1°C within a century (100 years) calculated from 2009, followed by Tanjung Priok, Serang, and Halim with around 2.1°C, 1.8°C, and 1.2°C respectively; the suburban areas of Pondok Betung, Cengkareng, and Curug with around 0.6°C, 0.6 °C, and 0.5 °C, respectively; and lastly Bogor as a mountainous area having a warming of 0.4 °C. Considering the bias from the data taken from the observations, one can predict the HI effect to cause warming in metropolitan Jakarta by roughly taking the average of the increasing trends that occurred in Jakarta, Tanjung Priok, and Halim of about 2.5°C over a period of 100 years. This is much higher compared to the warming in the suburban and mountainous areas of about 0.6 °C and 0.4 °C, respectively.
As mentioned before, there is a positive linear correlation between industrial expansion and transportation (see Figure 4), apart from the big impact of deforestation and settlement expansion causing the HI effect and the increasing temperature trend on a longer climatic time scale in Jakarta and surroundings.
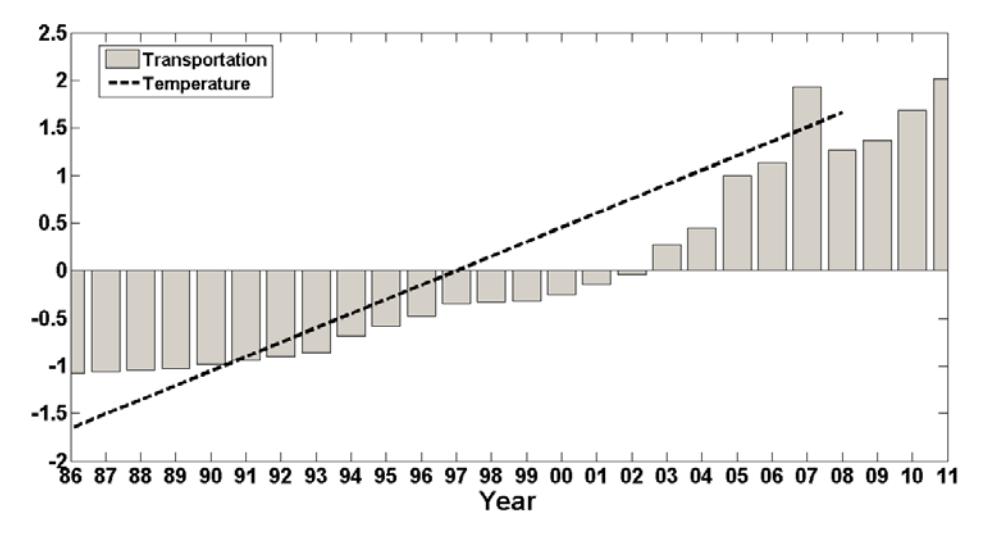
Figure 8 Normalized number of vehicles (box chart) and temperature trend (line chart) in Jakarta.
Figure 8 shows the total number of vehicles/year (public transportation, buses, private cars, and motorcycles), having a positive increasing trend from 1986 to 2011, which clearly infers a strong correlation (92.4% with 95% confidence level) between transportation growth and the increasing air temperature trend over Jakarta. This infers that industrial expansion and new settlement areas have led to land use changes that reduced forest and open/cleared land areas in Jakarta, and furthermore stimulated an increased total transportation number in Jakarta and surroundings. The land use changes have contributed to the HI effect, causing a quick temperature rise from morning to noon time, after straightforward calculation, of around 7 °C and on a longer climatic time scale, a very significant increasing air temperature trend in Jakarta that should be a very important warning signal about the deterioration of environmental conditions.
4 Conclusion
The conclusion is twofold:
- 1. Industry is the dominant driving force behind land use changes over Jakarta and surroundings with an increasing growth rate per year of around 502 ha from 1997 to 2012 (16 years) corresponding with a percentage rate of around 9.76%. Industrial areas were concentrated in the eastern part of Jakarta from 1997 to 2009 and then grew rapidly in the new industrial areas in the western part of Jakarta and in the northern and southern part of metropolitan Jakarta, with a remarkable increasing rate per year of around 38.8% during the past 4 years (2009 to 2012). The land use changes affected by industry have caused a similar spatial distribution pattern of forest and open/cleared land areas with a dramatic decrease rate per year of 8.3% and 13.8%, respectively, from 2009 to 2012. Water did not have a similar spatial distribution pattern causing land use changes, with a decrease rate per year of 74 ha, which is equivalent to 3.4% in the past 16 years (1997 to 2012).
- 2. The land use changes were dominantly affected by industry and settlement, followed by deforestation and decreasing water and open/cleared land areas. The total number of industries has a positive linear correlation with the increasing trend of transportation as a consequence of increasing human activities due to the expansion of industry and settlement areas. This has a prominent impact on the increased air temperature difference range from morning to noon of around 7°C at the location of the automatic weather station (AWS) in Puspiptek, Serpong, which is higher than the HI impact range of 3-5°C.
The heat island effect due to land use changes is clearly evidenced by the increasing air temperature trend on a longer climatic time scale, as has occurred at the meteorological stations in Jakarta, Tanjung Priok, Serang, Halim, Pondok Betung, Cengkareng, Curug, and Bogor with an increase rate per year of 0.051°C, 0.021°C, 0.018°C, 0.012°C, 0.006°C, 0.006°C, 0.005°C, and 0.004°C, respectively. Citeko did not show a significant trend as diagnosed by the Mann-Kendall test. The impact of the HI effect could raise the air temperature in the city around 5.1°C, 2.1°C, 1.8°C, and 1.2°C in Jakarta, Tanjung Priok, Serang, and Halim, respectively, within a century (100 years), calculated from 2009. This increasing trend is reduced significantly to around 0.6°C, and 0.6°C, and 0.5°C as the location changes to the suburban areas of Pondok Betung, Cengkareng, and Curug, respectively, and to rising only 0.4°C in the mountainous area of Bogor. The increasing air temperature trend in the metropolitan city of Jakarta is about 2.5°C within 100 years, which is not comparable with the warming trend in the suburban and mountainous areas of about 0.6°C and 0.4°C, respectively.
The HI effect in Jakarta and surroundings is caused by industrial expansion and new settlement areas that have caused land use changes, reducing forest, open/cleared land, and water coverage areas in Jakarta. These changes stimulate the trend of increasing transportation and a dramatic warming air temperature trend on a longer climatic time scale in Jakarta and surroundings. During the past 4 years, land use changes have been occurring very rapidly in significant numbers, causing a vast and abrupt change in environmental resilience. They should be a very important warning to policy makers in dealing with the land use categories of industry, deforestation, new settlements, open/cleared land, and water. The rapid degradation rate of environmental resilience should be mitigated by implementing better policies in metropolitan Jakarta by opening more green space areas, applying tight policies to industry, and so on. Further study on the latter issue is in urgent need to be done.
Acknowledgments
This study was supported by the graduate and postgraduate scholarship program of the Agency for Assessment and Application of Technology (BPPT). We thank BMKG, BPN, and BPS Jakarta for providing the data, and the staff of the Environmental Science Study Program, Graduate Program, University of Indonesia for administrative support.