
1 Introduction
Indonesia is the 4<sup>th</sup> largest coffee producer and exporter in the world, behind Brazil, Vietnam and Colombia [1]. The EU, Japan and the USA are major importers and have high food safety standards concerning pesticide residues. The maximum residual limits (MRLs) of pesticides imposed by importing countries significantly affect Indonesia's coffee exports. Carbaryl in Indonesian coffee was found to be higher than the MRLs set by importing countries. In some cases, Indonesia's coffee exports have been rejected by certain importers. For example, in March 2013, Lampung, a coffee-producing region in Indonesia
exported only around over 14.000 tons of robusta beans with a worth of US$ 28 million. This was a substantial drop compared to the previous month when around 24.000 tons of beans with a worth of US$ 47 million went to market [2].
In recent years, many techniques have become available for extraction and purification of pesticide residues for analytical purposes. The QuEChERS (quick, easy, cheap, effective, rugged and safe) method is a multiresidue method for the determination of pesticide residues introduced by Anastassiades, et al. [3]. They developed an original analytical methodology combining the extraction/isolation processes of pesticide residues from food matrices and clean-up processes. This method consists of two steps, i.e. extraction with acetonitrile and purification by dispersive solid-phase extraction (d-SPE). The extraction process uses MgSO4 to remove water from the organic phase, while the purification process uses primary secondary amine (PSA) SPE columns to remove various polar organic acids, polar pigments and some sugars and fatty acids; graphitised carbon black (GCB) to remove sterols and pigments such as chlorophyll; and C18 to remove non-polar interfering substances like lipids [4].
Since Anastassiades, et al. have introduced the QuEChERS method it has been validated for fruits and vegetables [5], it has been improved by using buffer for residue analysis of fruits and vegetables [6], and it is continuously being developed using gas/liquid chromatography-tandem mass spectrometry for analysis of pesticide residues in crops, especially in fruits, vegetables and cereals. An overview of publications about QuEChERS methods can be found in reference [7]. Good accuracy and precision of these methods has been obtained for all pesticides. There are three types of QuEChERS methods: original unbuffered, first published in 2003 [3]; the AOAC Official Method 2007.01, which uses acetate buffering [8]; and the European Standard Method EN 15662:2008, which uses citrate buffering [9]. All three types show excellent recovery and precision when they are used for the analysis of pesticide residues in fruits and vegetables [10]. In fruits and vegetables, QuEChERS provides a simple, rapid and realible analysis of pesticides. QuEChERS has been used successfully for multi-residue pesticide analysis of different kinds of fruits and vegetables using liquid chromatography-tandem mass spectrometry. Only in a few cases, certain pesticides showed poor recovery and were not sensitive [10- 12].
A modified QuEChERS has been reported and applied for the analysis of a large number of pesticide residues in green coffee beans using gas chromatography-negative chemical ionization mass spectrometry (GC-MS/MS) [13]. The matrix effects were >20% for all pesticide residues determined in this publication. For this reason, a matrix-based or matrix-matched calibration standard should always be used for accurate quantitation of pesticide residues in coffee beans. An example of a matrix effect case is described in the DG SANCO guideline SANCO/12495/2011 [14]. A previous study has been reported by Yang [15]. In this study, coffee samples were extracted with ethyl acetate and the extract was purified by gel permeation chromatography (GPC) combined with solid-phase extraction (SPE), i.e. an Envi-Carb SPE cartridge coupled by an NH2-LC SPE cartridge. The purification was followed by gas chromatography mass spectrometry (GC-MS) measurement for quantitative determination of 69 pesticide residues in coffee bean samples. The estimated LOQs obtained from this method were higher than the MRL required by importing countries (the EU, Japan, the USA). Therefore, this method is not recommended. Some publications on the analysis of pesticide residues in coffee beans imply that coffee beans have a matrix that is generally difficult to analyze and have not been the focus of studies on pesticide residues for a number of years.
Due to the high complexity of the matrices (fatty, acidic, low water content, high water content, high pigment) and the type of pesticides (influence of pH, degradability, planar pesticides), some modifications of the QuEChERS method have been applied, e.g. the use of a sorbent such as graphitized carbon black (GCB) for multiresidue analysis in high pigment samples like spinach [16], tea [17] and paprika [18]. With GCB as sorbent it is easy to remove pigments. However, it strongly retains planar pesticides [17]. In this study, GCB was used to remove pigment from green coffee bean samples.
A Triple Quadrupole System equipped with a collission cell integrated in an LC-ESI-MS/MS instrument enables to obtain two or more transition states and to monitor their different precursor-product pairs. This system is necessary to obtain enough identification points (IPs). A minimum of 3 IPs must be achieved for residue analysis in terms of positive result confirmation. 4 IPs can be obtained with two transitions for the same precursor ion. In this study, we further developed the QuEChERS method by modifying EN 15662:2008 and then applied it to LC-ESI-MS/MS for quantitative analysis of 14 pesticides (aldicarb, carbaryl, carbofuran, diazinon, dichlorvos, dimethoate, diuron, imidacloprid, malathion, methidathion, methomyl, profenofos, propiconazole and propoxur) in Indonesian green coffee beans.
2 Experimental Set-Up
2.1 Reagents and Chemicals
Most of the reagents and solvents were of analytical grade quality. Acetonitrile, acetic acid and formic acid were purchased from Merck (Darmstadt, Germany). Purified water was prepared by using the Milli-Q (Millipore, USA) water
purification system. Pesticide reference standards (purity > 98%) were purchased from Sigma-Aldrich/Chem Service. QuEChERS materials and EN Method were obtained commercially from Agilent. For the extraction step we used QuEChERS extract pouches, which consisted of 50-mL plastic centrifuge tubes and sealed multilayer pouches which contained 1 g sodium citrate, 0.5 g sodium hydrogencitrate sesquihydrate, 4 g magnesium sulfate and 1 g sodium cloride. For the clean-up procedure we used QuEChERS dispersive SPE, high pigment that consists of a 15-mL plastic centrifuge tube containing ceramic homogenizer, 150 mg primary secondary amine (PSA), 45 mg graphitised carbon black and 855 mg magnesium sulfate.
2.2 Standard Solutions
Standard solutions of 14 pesticides commonly used in Indonesian coffee plantations were prepared. These pesticides included aldicarb, carbaryl, carbofuran, diazinon, dichlorvos, dimethoate, diuron, imidacloprid, malathion, methidathion, methomyl, profenofos, propiconazole and propoxur. Each stock solution of the individual pesticide standards was prepared by accurately weighing 5±0.01 mg of each pesticide in 5-mL volumetric flasks, followed by dissolving in acetonitrile. These stock solutions were then stored in amber vials in a refrigerator at -4°C. Individual intermediate stock standard solutions (10 mg L<sup>-1</sup>) were prepared by diluting an appropriate volume of each individual stock standard solution with acetonitrile. Working standard solutions (1 mg L<sup>-1</sup>) were freshly prepared by diluting the intermediate standard solution with acetonitrile.
2.3 Green Coffee Bean Samples and Fortifications
A total of 181 Indonesian green coffee bean samples were obtained from farmer's fields, collectors and exporters of green coffee in different producing regions in Indonesia, i.e. Aceh, North Sumatera, West Sumatera, South Sumatera, Bengkulu, Lampung, Central Java, East Java, Bali and South Sulawesi. The samples showing no response to any of the 14 pesticides listed above were used in fortification experiments and as matrix blanks for matrixmatched calibration standards.
1 kg of sample was ground, homogenized throughout a 150-mesh sieve and subsequently slurried by adding and mixing with cold water (ratio, 1:2 (w/w)). For recovery studies, 10 g of slurry sample was weighed in a 50-mL plastic centrifuge tube, added with working standard solutions of each pesticide at the desired concentration resulting in an end concentration of 1.0 mg L<sup>-1</sup> for each
solution, shaken for 30 s, and kept at room temperature for 1 h. The latter action aims to let the analyte react with the sample matrix.
2.4 Extraction and Clean-up Procedure
10 g of slurry sample was accurately weighed and transferred into a 50-mL polypropylene centrifuge tube with screw cap. Extraction was conducted according to the EN 15662:2008 method [9]. 10 mL of 1% acetic acid in acetonitrile, 1 g sodium citrate, 0.5 g sodium hydrogencitrate sesquihydrate, 4 g magnesium sulfate and 1 g sodium cloride were added to the sample in the extraction tube. The tube was closed and shaken vigorously for 5 min and then centrifuged for 10 min at 5000 rpm. An aliquot of 4 mL of the acetonitrile phase was transferred into a 15 mL dispersive SPE tube containing ceramic homogenizer, 150 mg primary secondary amine (PSA), 45 mg graphitised carbon black and 855 mg magnesium sulfate for the clean-up procedure. Then, the tube was closed and shaken vigorously for 2 min and centrifuged for 5 min at 5000 rpm. The extract was isolated immediately, put in a new 15-mL polypropylene centrifuge tube and left in a refrigerator overnight. The extract was filtered through a 0.2 µm PTFE filter and transferred into a vial.
2.5 Liquid Chromatography
The instrument used was a Shimadzu UPLC system including an autosampler and a binary pump. Chromatographic separation was performed for all pesticides in a reverse-phase C-18 analytical column of 150 x 4.6 mm and 5 µm particle size (Ascentis, Supelco). The mobile phase consisted of water containing 0.1% formic acid (A) and acetonitrile containing 0.1% formic acid (B). The gradient elution programme (time, A/B (v/v)) was as follows: 0-5 min, 80% A/20% B; 5-10 min, 80% A/20% B – 10% A/90% B; 10-21 min, 10% A/90% B; 21-22 min, 10% A/90% B – 80% A/20% B; 22-25 min, 80% A/20% B. The injection volume was 20 µL, the flow rate was 0.4 mL min-1 and the temperature of the column was maintained at room temperature.
2.6 MS/MS Conditions
A 3200 QTRAP Triple Quadrupole Mass Spectrometer (Applied Biosystems/MDS Sciex) fitted with an electrospray chemical ionization (ESI) source operated in the positive ion mode was used. Data acquisition was performed in multiple reaction monitoring (MRM) mode. The ion spray voltage was 5 kV and the source temperature was set at 500 °C. The collision energy (CE), the declustering potential (DP), the entrance potential (EP) and the collision cell exit potential (CXP) were optimised for each target analyte.
Nitrogen gas was used as collision gas and to help the evaporation of the solvent.
2.7 Method Validation
The method's performance was evaluated by considering the following validation parameters: specificity, linearity, precision, accuracy (recovery), method limit of detection (LOD) and method limit of quantification (LOQ). For calibration, ranges of concentration levels of each pesticide depend on each analyte response to the instrument. Therefore, five concentration levels of each pesticide were prepared by mixing working standard solutions of each pesticide in different concentrations and diluting with blank extract sample. The accuracy and precision of the method were evaluated through a recovery experiment by spiking each pesticide standard into a blank green coffee bean slurry in six replications prepared separately at three different concentrations, i.e. 10, 50 and 100 µg kg-1. Method limits of detection (LODs) of each pesticide were determined by considering a signal-to-noise ratio of 3 with reference to the background noise obtained from blank sample in six replications that presented a good coefficient of variation (CV), i.e. less than 20%. The time window for determination of the S/N ratio was less than 1 min. The LOD was calculated via the formula: LOD = 3 x CV x mean concentration of blank samples. LOQ was defined as the minimum concentration of an analyte that can be identified and quantified with 99% confidence and calculated via the formula: LOQ = 10 x CV x mean concentration of blank samples.
3 Results and Discussion
3.1 Optimization of The LC-ESI-MS/MS Instrument
Some parameters of the UPLC system, interface, and mass analyzer needed to be optimized to execute the confirmatory methods. The UPLC system was optimized for important parameters, i.e. flow rate and mobile phase composition by a gradient elution program, while the column temperature was maintained at room temperature to provide optimum chromatographic performance with regard to peak shape and peak separation. The optimum flow rate was 0.4 mL min-1. The initial gradient of the mobile phase was water/acetonitrile = 80%/20% for 5 min to optimize absorption of all pesticides in the column, the desorption process was initiated with linear gradient set at 5 min and a hold at 11 min at 90% of acetonitrile and finally the system was set to equilibrium for 5 min.
Table 1 Optimization of LC-ESI-MS/MS Instrument.
| System | Optimization Parameter | Goal | |||
|---|---|---|---|---|---|
| UPLC | Flow rate, mobile phase composition, gradient program, column temperature | Obtaining the optimum chromatographic separation | |||
| Interface | Ionization process, solvent | Obtaining the optimum precursor ion of [M + H]+ of each target analyte | |||
| Mass Spectrometry | Collision energy (CE), declustering potential (DP), entrance potential (EP), and collision cell exit potential (CXP) | Obtaining the optimum of two selected product precursor ions of each target analyte | |||
Table 2 LC-ESI-MS/MS Parameters for Quantitation and Confirmation.
| Analyte | Retention time (min) | Q1 mass (m/z) | Q3 mass (m/z) | DP (Volt) | CE (Volt) | EP (Volt) | CXP (Volt) 3 | |
|---|---|---|---|---|---|---|---|---|
| Aldicarb | 12.9 | 208.1 | 116.0 | 11 | 11 | 2 | ||
| 12.9 | 88.9 | 11 | 20 | 2 | 3 | |||
| Carbaryl | 13.7 | 202.1 | 145.1 | 31 | 16 | 10 | 3 | |
| 13.7 | 127.1 | 31 | 39 | 10 | 3 | |||
| Carbofuran | 13.5 | 222.1 | 165.2 | 30 | 17 | 10 | 3 | |
| 13.5 | 123.0 | 30 | 29 | 10 | 3 | |||
| Diazinon | 17.4 | 305.0 | 169.0 | 41 | 31 | 12 | 4.5 | |
| 17.4 | 153.0 | 41 | 27 | 12 | 4.5 | |||
| Dichlorvos | 13.2 | 220.9 | 108.9 | 41 | 25 | 5.5 | 5 | |
| 13.2 | 127.1 | 42 | 27 | 5.5 | 5 | |||
| Dimethoate | 12.1 | 230.0 | 125.0 | 21 | 29 | 9.5 | 4 | |
| 12.1 | 198.8 | 21 | 13 | 9.5 | 4 | |||
| Diuron | 13.9 | 233.1 | 72.0 | 46 | 35 | 4.5 | 4 | |
| 13.9 | 46.1 | 46 | 31 | 4.5 | 6 | |||
| Imidacloprid | 12.0 | 256.1 | 175.0 | 15 | 25 | 5 | 3 | |
| 12.0 | 208.9 | 15 | 21 | 5 | 3 | |||
| Malathion | 15.1 | 331.0 | 99.0 | 26 | 31 | 10 | 3 | |
| 15.1 | 127.0 | 26 | 19 | 10 | 3 | |||
| Methidathion | 14.7 | 302.9 | 145.1 | 15 | 15 | 5 | 3 | |
| 14.7 | 85.1 | 15 | 27 | 5 | 3 | |||
| Methomyl | 11.3 | 163.1 | 88.0 | 15 | 13 | 10 | 3 | |
| 11.3 | 106.0 | 15 | 13 | 10 | 3 | |||
| Profenofos | 18.4 | 372.9 | 302.9 | 30 | 25 | 10 | 4 | |
| 18.4 | 97.0 | 30 | 43 | 10 | 4.5 | |||
| Propiconazole | 16.0 | 342.1 | 159.0 | 30 | 37 | 10 | 4 | |
| 16.0 | 69.1 | 30 | 33 | 10 | 4 | |||
| Propoxur | 13.5 | 210.1 | 111.0 | 21 | 19 | 10 | 3 | |
| 13.5 | 168.1 | 21 | 11 | 10 | 3 | |||
Electrospray ionization (ESI) requires polar solvents with good volatility, low viscosity, low surface tension and high ionic strength, so acetonitrile was used as organic solvent with reverse phase LC system. The solvents must be compatible with the interface and the analyte solubility. In this study, a mixture of water-acetonitrile containing formic acid was used as mobile phase. For target analytes studied, observed ionic species (precursor ion) and sensitivity were varied according to the nature of the solvent. Solvent (mobile phase) containing 1% formic acid was used to obtain a precursor ion of [M + H]+ in positive ESI mode ionization. The optimization of the instrument is summarized in Table 1.
In mass spectrometry, the diagnostic signal of an analyte with molecular weight M may be disturbed by an analyte with a molecular weight M1, M2, or others if they are present in high concentrations. In this case, the triple quadrupole system used a collision cell to fragment the precursor ion. Two selected product precursor ions of each target analyte were obtained by optimization of a number of parameters, i.e. collision energy (CE), declustering potential (DP), entrance potential (EP) and collision cell exit potential (CXP). The results are summarized in Table 2.
3.2 Validation Study
The method was validated according to the requirements of DG SANCO guideline SANCO/12495/2011 [14]. The specificity of the method was evaluated by analysis of blank green coffee bean samples and samples spiked with a mixture of all standard pesticides that may be present as residues. For each analyte of spiked pesticide, the chromatogram showed an increase in peak area and intensity. It also showed the specific retention time for each analyte compared to the blanks. For selectivity, "a system of identification points (IPs) was used to interpret data, based on the ion ratios of the precursor and product ions" [19]. This IP system is similar for organic compounds, but not identical to Commission Decision 2002/657/EC [19]. 4 IPs were obtained from precursor (1 IP) and product ions (1.5 IP/ion) of each analyte (see Table 2). The first transition with a higher sensitivity and a lower noise was used for quantification and the second transition was used for confirmation.
In Figure 1(A), the mass-chromatograms of 14 standard pesticides diluted in extracted blank samples obtained in +ESI are presented. All 2 transitions for each analyte could be monitored. The mass-chromatograms of 14 pesticides spiked into green coffee bean sample at 100 µg kg-1 can be seen in Figure 1(B). It is clearly displayed that there was no interference of impurities. Caffeine and other pigments may be already were removed by the graphitised carbon black (GCB).
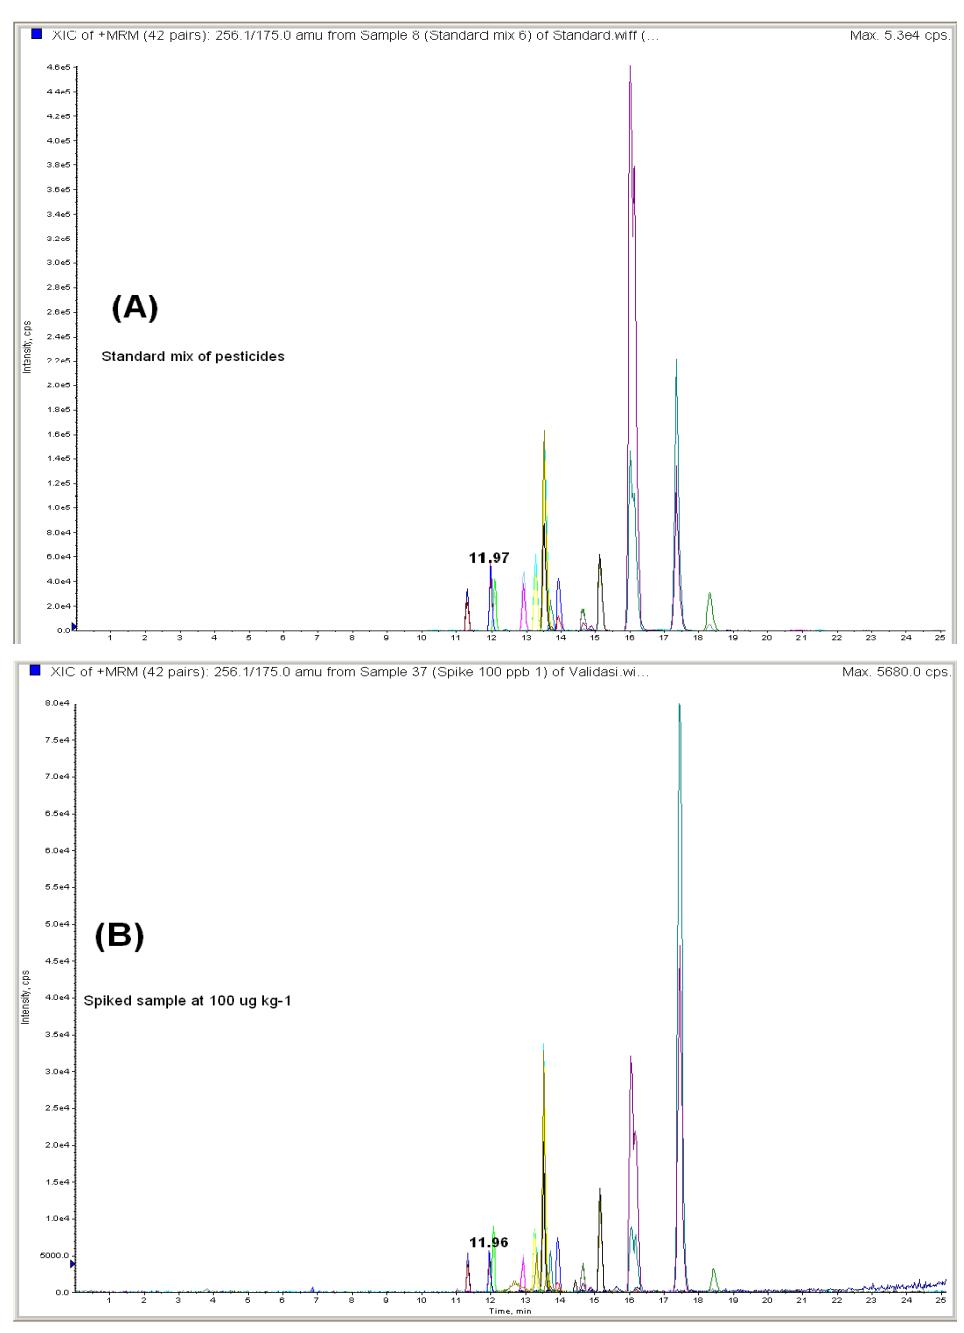
Figure 1 LC-ESI/MS/MS chromatograms of (A) pesticide standards diluted in extracted blank samples of green coffee bean sample, and (B) green coffee bean sample spiked at 100 µg kg-1.
The response linearity was evaluated by a matrix-matched calibration curve constructed by plotting peak area versus analyte concentration at five low concentration levels. The concentration ranges were 0.1-10, 0.5-20, 2.5-50 and 5-50 \(\mu\)g kg<sup>-1</sup>. These ranges depend on each analyte's response to the instrument. Good linearity was obtained with the square of linear regression coefficient (R<sup>2</sup>) higher than 0.993 for almost all analytes. Only aldicarb was slightly inferior, but still acceptable at 0.981 (see Table 3 below). For the recovery study, the concentration level was up to \(100~\mu\)g kg<sup>-1</sup>.
The accuracy and precision of all pesticide residues were evaluated through recovery experiments as described above. For this purpose, data from three spikings (10, 50, and 100 µg kg<sup>-1</sup>) of six replications (n = 6) were used. For all pesticides, good accuracy and precision were obtained. In this study, the use of 1% acetic acid in the elution solvent was effective in reducing the absorption of planar pesticides and thus improve the recoveries of those pesticides, as described in Chen [17]. As can be deduced from Table 3, all calculated mean recoveries were within the range of 70-120% and the individual calculated CVs for each analyte were below 20%. The obtained mean recoveries and CVs were in accordance with the performance criteria required by Document N° SANCO/12495/2011 [14].
Table 3 Mean Recovery, Coefficient of Variation (CVs), Linearity, Limits of Detection (LODs), Limits of Quantification (LOQs) and Maximum Residue Limits (MRLs) of 14 Pesticide Residues in Green Coffee Bean.
| Analyte | Spiked level (µg kg-1) | Linearity | LOD | 1.00 | MRL (μg kg-1) | ||||||||
|---|---|---|---|---|---|---|---|---|---|---|---|---|---|
| 10 | 50 | 100 | D | - LOD | LOQ | ||||||||
| Rec | CV | Rec | CV | Rec | CV | \(\mathbb{R}^2\) | Range (µg kg-1) | (μg kg-l) | (μg kg-l) | Japan | EU | US | |
| % | % | % | % | % | % | ||||||||
| Aldicarb | 95 | 5 | 83 | 11 | 99 | 3 | 0.981 | 2.5 - 50 | 1.5 | 4.9 | 100 | 100 | 100 |
| Carbaryl | 108 | 5 | 110 | 9 | 110 | 10 | 0.997 | 2.5 - 50 | 2.4 | 7.9 | 10 | 50 | - |
| Carbofuran | 90 | 6 | 89 | 6 | 84 | 2 | 0,999 | 0.5 - 20 | 0.3 | 0.9 | 1000 | 50 | 100 |
| Diazinon | 109 | 6 | 96 | 9 | 98 | 5 | 0.999 | 0.1 - 10 | 0.2 | 0.8 | 10 | 50 | - |
| Dichlorvos | 98 | 19 | 112 | 8 | 105 | 12 | 0.996 | 2.5 - 50 | 2.6 | 8.5 | 200 | 20 | - |
| Dimethoate | 87 | 4 | 96 | 7 | 88 | 3 | 0.994 | 2.5 - 50 | 1.1 | 3.5 | 10 | 50 | - |
| Diuron | 81 | 12 | 92 | 16 | 95 | 4 | 0.995 | 5.0 - 50 | 2.9 | 9.7 | 20 | 100 | - |
| Imidacloprid | 114 | 4 | 88 | 8 | 90 | 4 | 0.994 | 2.5 - 50 | 2.0 | 6.8 | 700 | 1000 | 800 |
| Malathion | 110 | 6 | 96 | 14 | 90 | 4 | 0.999 | 2.5 - 50 | 1.9 | 6.5 | 500 | 20 | - |
| Methidathion | 77 | 16 | 99 | 13 | 93 | 9 | 0.999 | 5.0 - 50 | 2.7 | 8.9 | 1000 | 100 | - |
| Methomyl | 118 | 1 | 95 | 10 | 89 | 9 | 0.999 | 2.5 - 50 | 1.1 | 3.7 | 10 | 100 | - |
| Profenofos | 118 | 3 | 90 | 7 | 84 | 6 | 0.997 | 5.0 - 50 | 1.6 | 5.3 | 10 | 50 | - |
| Propiconazole | 114 | 8 | 96 | 11 | 103 | 16 | 0.999 | 0.5 - 20 | 0.3 | 1.0 | 100 | 100 | - |
| Propoxur | 107 | 7 | 113 | 8 | 95 | 5 | 0.998 | 0.5 - 20 | 0.6 | 2.1 | 10 | 100 | - |
3.3 Sample Analysis
Finally, the validated QuEChERS method was applied for detection of pesticide residues that may be present in green coffee bean samples from different regions. 181 green coffee bean samples were analyzed. The analysis results revealed that no aldicarb, diuron, methomyl and propiconazole residues were detected in the samples. However, carbaryl, carbofuran, diazinon, dichlorvos, dimethoate, imidacloprid, malathion, methidathion, profenofos and propoxur residues were detected in some samples. The pesticide residue levels of the samples are presented in Table 4. Carbaryl, diazinon, dichlorvos, dimethoate, malathion and propoxur were detected in the samples at levels above the MRLs set by importing countries. Diazinon and imidacloprid were the pesticides most found in the samples.
Analyte Number of detected samples (≥LOQ) Below the MRLs set by importing countries Above the MRLs set by importing countries EU Japan US EU Japan US Aldicarb - - - - - - Carbaryl 1 1 - 3 1 - Carbofuran 4 4 4 - - -
Diazinon 32 39 - 11 4 - Dichlorvos 4 1 - - 3 - Dimethoate 3 4 - 1 - - Diuron - - - - - - Imidacloprid 11 11 11 - - - Malathion 6 4 - - 2 - Methidathion 2 2 - - - - Methomyl - - - - - - Profenofos 3 3 - - - - Propiconazole - - - - - - Propoxur 3 4 - 1 - -
Table 4 Occurance of Pesticides in Indonesian Green Coffee Beans.
4 Conclusion
A modified quantitative analytical method based on the EN 15662:2008 method was proposed for measurement of pesticide residues in Indonesian green coffee beans. The method shows good linearity, recovery and precision and hence fulfills the requirements stated in Document No SANCO/12495/2011. The method reveals LOQs that are lower than the MRLs set by importing countries. Therefore, the method described here can be applied for routine analysis of pesticide residues in green coffee beans.
Acknowledgements
This work is part of the project for monitoring pesticide residues in Indonesian green coffee beans conducted by Center for Quality Control of Goods (PPMB),
Ministry of Trade of Indonesia. PPMB established the sampling plan to provide representative samples for the analytical laboratory.