
1 Introduction
Ambon Bay is located near Ambon City, which is the center for housing, industry and transportation on Ambon Island. Geographically, Ambon Bay is separated by a shallow sill (±12 m depth) between outer and inner part. The location of Ambon Bay is near to the Banda Sea, which is strongly affected by the monsoon [1-4] and El Niño Southern Oscillation (ENSO) [4]. Consequently, it is important to analyze how the monsoon and ENSO affect oceanographic and climatic conditions in Ambon Bay. To understand these phenomena we can use ocean-temperature and salinity data.
However, such a study would be limited by the lack of continuous and long time series in-situ data for Ambon Bay. A global numerical model of ocean temperature and salinity does not have enough spatial resolution to represent the local oceanographic conditions in that specific area. However, Indonesia is home to 15% of coral reef areas in the world [5]. The huge coral resources in Indonesia can be used to solve this problem. Besides the function of coral as a habitat for marine biota, coral also serves as natural recording medium for environmental parameters such as sea surface temperature (SST) [6-9] and sea surface salinity (SSS) [10-12]. These parameters are recorded by corals in the form of geochemical proxy.
Corals grow by precipitating CaCO3 (calcium carbonate) and forming coral growth bands. Coral growth bands represent high and low densities of CaCO3 in the coral skeleton [6,11,13]. One-year of coral growth is characterized by a pair of high and low density-banding patterns [6,13]. Porites coral growth is approximately about 1 cm/year. This means that with a 1-meter coral sample we can reconstruct environmental data until a hundred years ago [11].
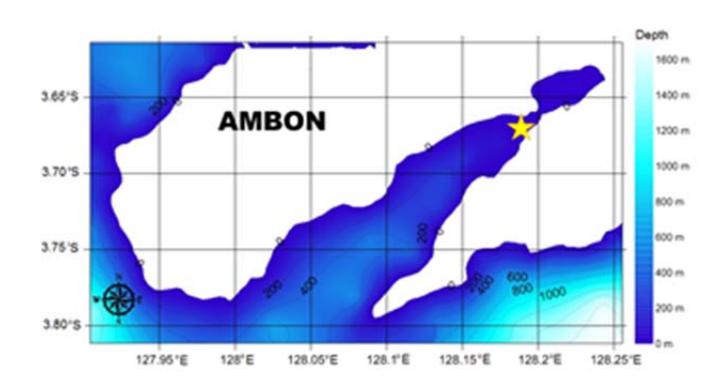
Figure 1 Bathymetry of Ambon Bay. The star symbol represents the location of the Porites coral.
One well-known geochemical proxy that records SST is the ratio of strontium to calcium (Sr/Ca) [7,14]. The substitution of strontium into calcium in coral aragonite can be stated as its distribution coefficient value (DSr). This value represents the [Sr]/[Ca] ratio in coral and seawater [8]. The DSr value is affected by SST [8]. Assuming that [Sr]/[Ca] in seawater is constant along the calibration period, then the Sr/Ca concentration ratio in coral is equal to DSr, which is affected by SST. Thus, coral Sr/Ca can be used to reconstruct SST. In this research, we reconstructed SST data based on Sr/Ca of Porites coral from
Ambon Bay. The reconstructed SST was used to analyze local oceanographic conditions in Ambon Bay. The coral sample location used in this study is shown in Figure 1.
2 Data
Some of the data used in this study were Porites coral sample, in-situ SST, a numerical model of SST, wind speed, air temperature, length of sun radiation, and ENSO index. A Porites coral sample with 20 cm length was taken from the Coast of Galala City (123.12 °E and 3.63 °S), Outer Ambon Bay, at 3 meter depth in October 2009. Coral Sr/Ca, then, was extracted from the sample and calibrated by a numerical model of the SST data to build the regression equation. This equation was used to reconstruct SST data. The reconstructed SST, then, were compared to the ENSO index and atmospheric parameters to understand the oceanographic and climatic conditions in Ambon Bay.
The time series of historical or modeled SST data covered by the growth period of the Porites coral were used when in-situ SST data from the coral site were not available or sparse. These SST data were used for coral Sr/Ca calibration. There are various numerical models of SST data with different spatial and temporal resolutions. SST data with monthly resolution from Extended Reconstructed Sea Surface Temperature version 3b (ERSST v3b) are available for 1854 to the present [15], while SST data from Simple Ocean Data Assimilation 2.2.4 (SODA 2.2.4) are available for 1871 to 2008 [16]. Spatially, ERSST has a 2° x 2° grid resolution, while the SODA data have a 0.5° x 0.5° grid resolution. In this study, ERSST data located at 128°E and 4°S and SODA 2.2.4 data located at 127.75°E and 3.75°S were used. Both SST data, then, were compared to in-situ SST data obtained from Monitoring Report of Ambon Bay, Research Center for Deep Sea, Indonesian Institute of Science (LIPI), Ambon, from May to November 2008 [17].
Atmospheric parameters were also used in this study to understand their effect on SST variability in Ambon Bay. Air surface temperatures and wind speed data were obtained from National Oceanic and Atmospheric Administration – National Center for Environmental Prediction (NOAA – NCEP) Reanalysis I for surface level [18]. Due to the limited spatial resolution, we chose 127.5°E and 2.5°S monthly NCEP grid data that are nearest to the coral sample location. In-situ data for the length of sun radiation for the 2006-2009 period, obtained from the Meteorological Climatological and Geophysical Institute (BMKG), Pattimura Station, Ambon [19], were also used in this study.
In order to understand the effect of global climatic phenomena on SST variability, we used Oceanic Niño Index (ONI) data. ONI data give information
about the intensity and time range of El Niño, La Niña, and normal conditions over a certain period. ONI 3.4 data for the 2001-2009 period, obtained from National Weather Service, Climate Prediction Center NOAA, were used. They represent SST anomalies and movements of the warm water pole area in the middle of the Pacific Ocean.
3 Methods
The methods used in this study consisted of coral sample preparation, laboratory analysis and SST reconstruction based on coral Sr/Ca data. First of all, a Porites coral sample was collected using a pneumatic drilling pistol for Sr/Ca analysis (see detailed method in [6,12]). After that, the coral sample was prepared, which included cleaning and X-ray scanning [20]. In this study, we used coral X-radiograph data to determine the coral growth axis. According to this information, we did coral sub-sampling along its growth axis (from top core to bottom core) using a 0.7 mm bit drilling machine to extract monthly coral Sr/Ca. This process yielded 80 coral powder samples, which were placed into a mini tube and numbered in ascending order from the first sample to the last. The coral powder samples were weighted for 0.267 mg and dissolved in 2 mL of 2% HNO3 solution. After that, the solutions were ready to be analyzed by Inductively Coupled Atomic Emission Spectro-Photometer (ICP-OES) in Singapore-Massachusetts Institute of Technology (MIT) Alliance for Research and Technology (SMART) to extract the coral [Sr]/[Ca]. The concentration ratio of coral Sr/Ca was then used to reconstruct SST data for Ambon Bay.
SST reconstruction was started by developing the time chronology of the coral Sr/Ca using the anchor point method. Previous studies have stated that Sr/Ca is inversely correlated to SST data [6-9,14]. Thus, anchor points are located at every minimum and maximum Sr/Ca (which represent the month of maximum SST and minimum SST respectively). The time of maximum and minimum SST are identified from climatological ERSST data. After that, the chronological development of the coral Sr/Ca was conducted using Analyseries 2.0.4. Analyseries 2.0.4 is a Macintosh based software application for conducting time series analysis [21]. By using this software, coral Sr/Ca was interpolated linearly in time and resampled to a monthly resolution. This yielded monthly Sr/Ca or twelve Sr/Ca data for each year. Finally, the linear regression of the monthly Sr/Ca and gridded SST data was calculated.
4 Results and Discussions
4.1 ERSST, SODA, and in-situ SST Data
Monthly ERSST and SODA data were compared for the period of 2000-2008 (n = 108) (Figure 2(a)). Linear correlation and data standardization were calculated. The results for both ERSST and SODA had nearly the same magnitudes (Figure 2(b)) with a descending trend of about 0.002 °C/year for ERSST and 0.001 °C/year for SODA. The ERSST and SODA data for Ambon Bay clearly showed seasonal variations, identified by maximum SST during the northwest monsoon and minimum SST during the southeast monsoon.
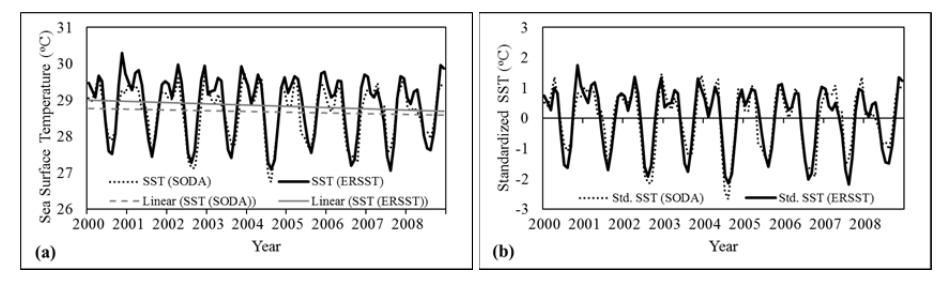
Figure 2 Monthly (a) SST, and (b) standardized SST data (monthly SST data subtracted by long-term average) for Ambon Bay from ERSST v3b and SODA 2.2.4 for the period of 2001-2009.
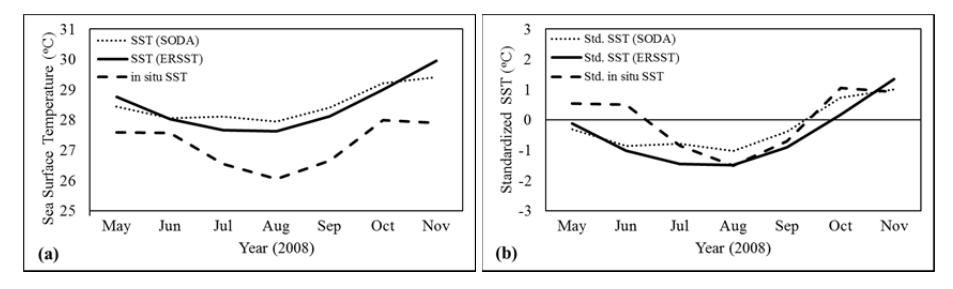
Figure 3 Comparison of monthly (a) SST, and (b) standardized SST data (monthly SST data subtracted by its long-term average) from ERSST v3b, SODA 2.2.4, and in-situ SST data in May to November 2008.
In order to confirm that ERSST or SODA represent SST in Ambon Bay, both data sets were compared to in-situ data (Figure 3). Even if there was a similar pattern in the ERSST, SODA and in-situ data, there were differences in the magnitudes. The differences were 0.45 to 2.06 °C for ERSST compared to insitu and 0.48 to 1.89 °C for SODA compared to in-situ. This led us to conclude that the magnitudes of the SODA data represented the in-situ data better than the ERSST data. However, the correlation between the ERSST and the in-situ
data (r = 0.805, n = 7, p < 0.05) was better than the correlation between the SODA and the in-situ data (r = 0.743, n = 7, p < 0.05). Hence, due to the higher correlation coefficient value and longer data availability, the ERSST data were chosen for coral Sr/Ca calibration.
4.2 SST Reconstruction based on Coral Sr/Ca
SST data were reconstructed from the coral Sr/Ca. The Sr/Ca concentration in the Ambon Porites coral varied from 8.462 to 8.807 mmol/mol (n = 80). It had a 8.618 mmol/mol mean and 0.07 mmol/mol standard deviation. The chronological development of the coral Sr/Ca using the anchor point method yielded 95 data points in a monthly resolution from June 2001 to April 2009.
The impacts of SST and air temperature on the coral Sr/Ca were analyzed by comparing coral Sr/Ca, air temperature and ERSST data. The coral Sr/Ca had a pattern similar to both the ERSST and the NCEP air temperature data (Figure 4). The correlation coefficient between coral Sr/Ca and SST was r = -0.699 (n = 95, p < 0.05), while the correlation coefficient between coral Sr/Ca and air temperature was r = -0.712 (n = 95, p < 0.05). This means that the Porites coral sample taken from Ambon Bay recorded air temperature better than SST. However, two peaks from the ERSST and air temperature data were not found in the coral Sr/Ca data. The occurrence of inaccuracies in the Sr/Ca data in recording ERSST and air temperature (NCEP) is possible due to NCEP limitations in representing the local conditions of Ambon Bay.
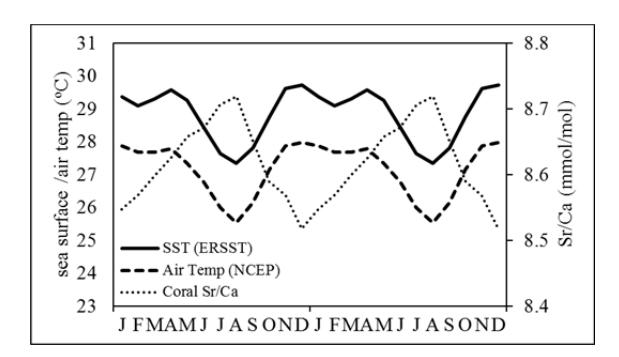
Figure 4 Standardized value (monthly data subtracted by its long-term average) of monthly mean coral Sr/Ca, sea surface temperature (ERSST v3b), and air temperature (NCEP).
In this research, the coral Sr/Ca was only calibrated to SST (ERSST) for the period from June 2001 to April 2009 (Figure 5). The linear regression equation of Sr/Ca against SST yielded a slope of Sr/Ca-SST of -0.059 mmol/mol per °C. This confirms the result of a previous study stating that the slope of Sr/Ca
against SST is in the range of -0.04 to -0.08 mmol/mol per °C [7,8,22]. The linear regression equation of coral Sr/Ca and SST for Ambon Bay can be expressed by Sr/Ca = (-0.059 x SST) + 10.32, with correlation coefficient value r = -0.699 (n = 95, p < 0.05).
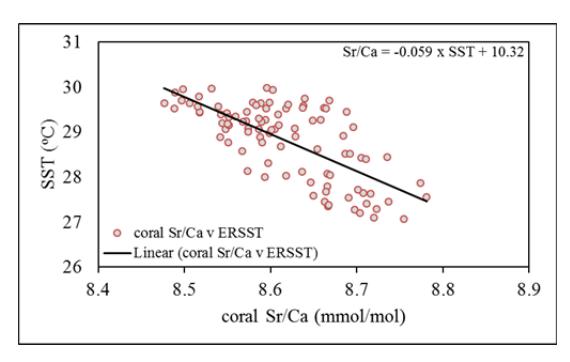
Figure 5 Coral Sr/Ca calibration using SST data from ERSST v3b.
The linear regression equation was used to reconstruct SST data. The reconstructed SST data for May-November were highly correlated to the in-situ SST data for Ambon Bay (r = 0.933, n = 7, p < 0.05). However, the magnitude of the reconstructed SST data was 1.2 to 2.5 °C higher than the in-situ SST (Figure 6). This difference can be tolerated, as it is stated in a previous study that the difference of reconstructed and in-situ SST data can vary from 2 to 4 °C [8]. Then, comparing the annual reconstructed SST with the annual gridded SST yielded a correlation coefficient of r = 0.05 (n = 9, p < 0.05). This means that the reconstructed SST data represent seasonal variability better than annual variability and also that these monthly data can be used to analyze oceanographic conditions in Ambon Bay.
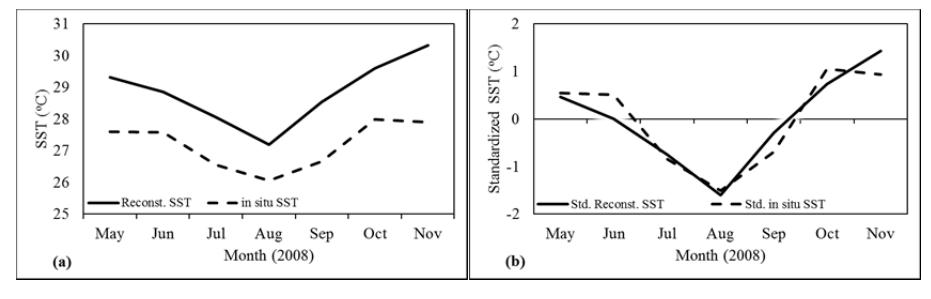
Figure 6 (a) Difference of reconstructed and in-situ SST data and (b) standardized value of reconstructed SST and in-situ SST data (monthly data subtracted by long-term average).
4.3 Oceanographic Condition of Ambon Bay
4.3.1 Seasonal Variation of SST
The monthly reconstructed SST data during the growth period of the coral sample are shown in Figure 7. Statistically, the reconstructed SST has a 28.85 °C mean and 1.12 °C standard deviation. During this period, there was a maximum SST on December 2004 at 31.24 °C and the minimum was on August 2005 at 26.08 °C. Seasonal variation is clearly shown by the maximum value in December (representing the northwest monsoon) and the minimum value in August (representing the southeast monsoon). These results are confirmed by previous studies [1,2], which state that the minimum SST in Ambon Bay is observed in August – the peak of the southeast monsoon – while the warming of the ocean surface starts in November [1,23].
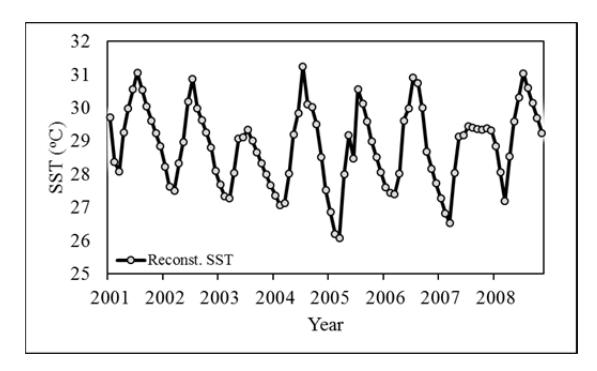
Figure 7 Reconstructed SST based on the coral Sr/Ca in the Ambon Bay.
Seasonal variation of SST data can be analyzed by comparing monthly mean of standardized reconstructed SST data to air temperature, wind speed, and length of sun radiation (Figure 8). The chart below shows that generally SST reaches its maximum on December (Northwest monsoon) coincides with maximum air temperatures, maximum length of sun radiation, and minimum of wind speeds. Conversely, SST reaches its minimum value on August (Southeast monsoon) coincides with minimum air temperature, minimum length of sun radiation, and maximum of wind speed. Solar radiation (or wind speed) are the primary source for ocean surface warming (or cooling). So that, the longer of solar radiation and the weaker of wind speeds yields the higher SST.
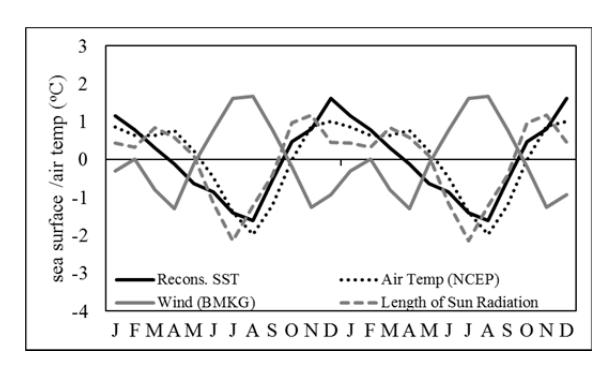
Figure 8 Standardized value (monthly data subtracted by its long-term average) of monthly mean of SST data (ERSST v3b), reconstructed SST, air temperature (NCEP), wind speed (NCEP), and length of sun radiation (BMKG).
However, there is a one-month time lag between sun radiation, air temperature, and reconstructed SST. The minimum length of sun radiation was identified in July, while the minimum air temperature and SST, and maximum wind speed were identified in August. On the other hand, the length of sun radiation decreased from December to February and increased in March. Based on the monthly mean of SST variation (Figure 8), the air temperature pattern follows the pattern of the length of sun radiation for January-March. The decrease of the length of sun radiation in February causes a decrease in air temperature in March. However, the SST dataset did not show a decrease of air temperature in March. We expect that these anomalies are caused by a delayed response of the ocean towards atmospheric changes [23] and an upwelling in the Banda Sea, which started to move into the Inner Ambon Bay on April and strengthened until August – the peak of the southeast monsoon [24]. Thus, even if the length of sun radiation was at its minimum in July, the minimum SST was identified in August.
4.3.2 Monthly variation of SST
The monthly variation of the reconstructed SST was compared to air temperature, wind speed, length of sun radiation and ENSO index to analyze the dominant factor that affects SST variation (Figure 9(a)). The correlation coefficient between SST and air temperature was r = 0.711 (n = 95, p < 0.05); SST and wind speed were r = -0.609 (n = 95, p < 0.05). The correlation coefficient between SST and length of sun radiation was r = 0.602 (n = 40, p < 0.05). This suggests that the SST anomaly was affected by wind speed and length of sun radiation. However, the correlation between SST and wind speed or length of sun radiation was not high enough.
Subsequently, the monthly SST data subtracted with their monthly mean during the period of 2001-2009 yielded positive and negative anomalies of SST in a monthly resolution. These data were then compared with the anomalies of air temperature, wind speed and ENSO index (Figure 9(b)). There were positive anomalies of SST from June 2001 to August 2002 and from March to August 2008, while negative anomalies were observed from September 2003 to July 2004 and from April to November 2005. These variations may have occurred due to the effects of ENSO on the oceanographic conditions in Ambon Bay.
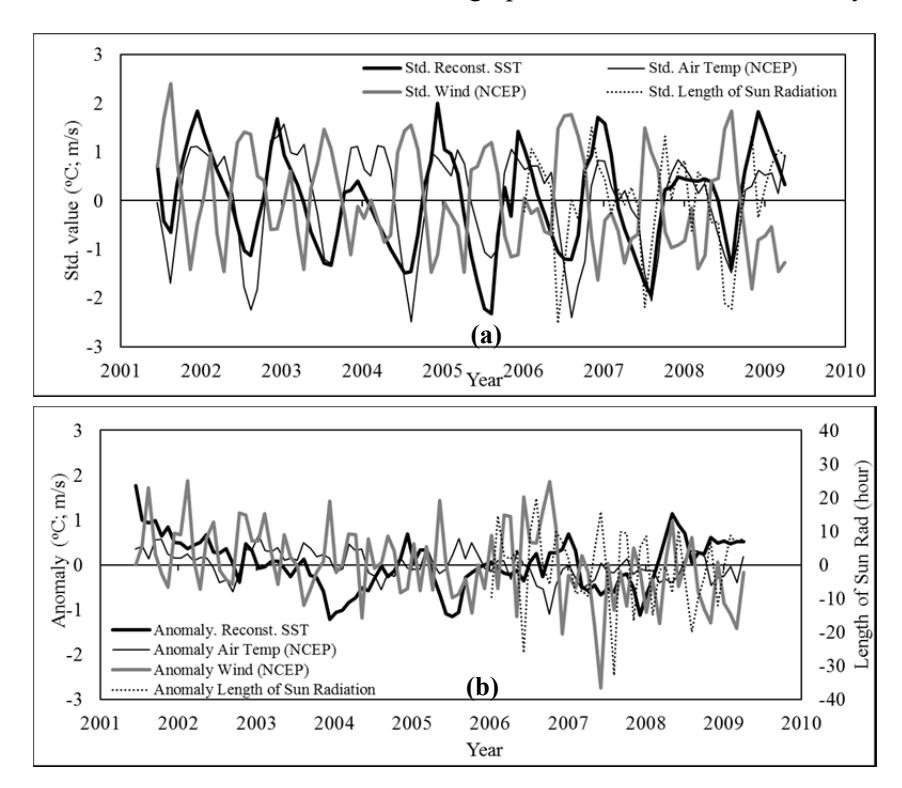
Figure 9 (a) Standardized and (b) anomalies of monthly reconstructed SST, air temperature, wind speed, and length of sun radiation.
In order to understand the effect of ENSO on the reconstructed SST, we compared the reconstructed SST data to ONI 3.4. The result was the following correlation coefficient value for a 0-month time lag: r = 0.054 (n = 95, p > 0.05). This means that there is no correlation between both data. A previous study stated that the responses of SST to ENSO in the Indian Ocean had about a 3-month lag in the area between 60°E and 150°W [25]. Using a 3-month lag between the reconstructed SST and ENSO we repeated the calculation, which yielded the following correlation coefficient for both parameters: r = -0.206 (n = 95, p < 0.05) (Figure 10).
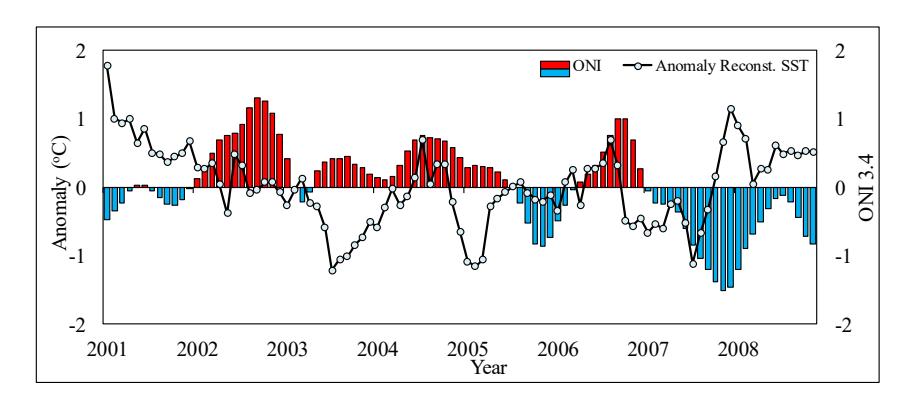
Figure 10 Comparison between reconstructed SST anomalies and ONI 3.4.
Based on the graphic information on Figure 10, during several periods positive (negative) anomalies of SST coincided with La Niña (El Niño) phenomena. The definition by NOAA states that ONI 3.4 represents normal conditions if the SST anomalies in the Central Pacific are between -0.5 and +0.5 °C; El Niño conditions if the SST anomalies are higher than +0.5 °C; La Niña conditions if the anomalies are lower than -0.5 °C [26].
The weak El Niño in 2007 coincided with a decrease of SST below its monthly mean. Conversely, La Niña in 2008 coincided with an increase in SST value above its monthly mean. It is supposed that El Niño conditions push the warm water pole to move into the Central Pacific, generating a lack of water mass in the West Pacific that is then filled by a water mass from deeper layers through upwelling processes. Upwelling phenomena make the surface water in the West Pacific have a lower temperature than in normal conditions [27]. The inverse mechanism happens in La Niña conditions, when the warm water pole is pushed into the West Pacific and causes the convergence of water masses so that SST is higher than normal.
However, if we look at Figure 10 there are anomalies. The weak El Niño from November 2004 to March 2005 and the strong El Niño from November 2002 to March 2003 did not coincide with a decrease in SST in Ambon Bay. It is suggested that the influence of local factors in Ambon Bay, e.g. wind speed, on the reconstructed SST were more dominant than the ENSO phenomena. A decrease of the wind speed during those periods could have caused a decrease in surface mixing, leading to optimum surface warming. Also, in normal conditions (September 2003-March 2004) and weak El Niño conditions (September 2004-September 2005) there was a sharp decrease in SST. This is supposed to be due to an increase in the wind speed during those periods (Figure 9(b)). Similar conditions were observed in normal conditions for
January-July 2002, when there was an abrupt increase of SST, which may have been cause by a decrease of the wind speed.
5 Conclusion
Sr/Ca of Porites coral sample taken form Ambon Bay recorded air temperature (r = 0.711, p < 0.05, n = 95) as well as SST data (r = 0.699, p < 0.05, n = 95) in Ambon Bay for the period from June 2001 to April 2009. The linear regression of the Ambon Porites coral Sr/Ca and SST from the ERSST v3b dataset was Sr/Ca = (-0.059 x SST) + 10.32. This equation was used to reconstruct SST. The correlation coefficient between the reconstructed SST and the in-situ SST data was r = 0.933 (with error value 0.05%) for the period of May to November 2008. The SST difference between the reconstructed SST and the in-situ SST was 1.5-2.5 °C, which is within the range of tolerance. Thus, the reconstructed SST could be used to fill in the gaps in the in-situ SST data for Ambon Bay.
The reconstructed SST shows a clearly seasonal variation with maximum values in December (northwest monsoon) and minimum values in August (southeast monsoon). The SST data had a positive correlation between air temperature and length of sun radiation, while there was a negative correlation with wind speed. However, in some periods (September 2003-March 2004, September 2004- September 2005, and January-July 2002) dominant effects on SST anomalies were identified caused by local wind speed, air temperature, and length of sun radiation rather than ENSO phenomena.
Acknowledgements
The authors would like to thank the Fast Track Scholarship program from the Directorate General of Higher Education, Republic of Indonesia (DIKTI), the Oceanographic Department ITB, the Research Center for Geotechnology LIPI for providing facilities during their bachelor project. Thanks also to Intan Suci Nurhati for discussion and supervision during laboratory work in SMART Singapore and for giving the permission to analyze the coral Sr/Ca samples using ICP-OES.