
1 Introduction
In earthquake hazard mitigation, the site amplification is an important factor besides the effect of the earthquake processes and the crustal structure. The site amplification is sometimes used as a reference to describe ground shaking due to the occurrence of an earthquake. Amplitude and frequency content of the ground motion due to the occurrence of an earthquake are affected by the site or medium characteristics, such as the impedance contrast and resonant frequency of the site. Several studies have shown that ground shaking not only depends on earthquake magnitude or distance but also on site conditions, such as surface geology, soil column thickness and soil nonlinearity [1-3].
Received May 11th, 2016, 1st Revision August 3rd, 2015, 2nd Revision March 2nd, 2016, Accepted for publication April 19th, 2016.
Copyright © 2016 Published by ITB Journal Publisher, ISSN: 2337-5760, DOI: 10.5614/j.math.fund.sci.2016.48.2.4
Site response characteristics give important information for analysis of site amplification factors. The spectral ratio method can be used to measure the Swave part of earthquake records to study the effect of an earthquake on ground motion [3,4]. The spectral ratio method compares observation results to results from reference rock sites. Simultaneous recording at a site and reference sites cannot be applied easily in urban areas because of high noise levels. Costly long-term deployment would be required. Nakamura therefore introduced the H/V spectral ratio (HVSR) method, which measures the horizontal to vertical spectral ratio of ambient seismic noise records [5,6]. The H/V spectral ratio method uses continuous ambient noise for its calculations. Sources of ambient noise are usually human activities or natural excitations and may be composed of body and surface wave components [7]. At low frequencies, typically less than 1 Hz, the origin of seismic noise is essentially natural with a particular emphasis on ocean waves, whose maximum energy is around 0.2 Hz. At a frequency of about 0.5 Hz, seismic noise usually exists due to the interaction between sea waves and the coastal area. At higher frequencies, more than 1 Hz, seismic noise may be associated with wind or water interaction. At much higher frequencies, seismic noise is dominantly due to human activities and the location of the source is mostly at the surface. The HVSR method consists of analysing a few minutes of noise or microtremors with three-component sensors and calculating the H/V spectral ratio [8,9]. Due to its easy measurement procedure and analysis, the HVSR method is frequently adopted in seismic microzonation studies [4,10-13]. The HVSR method is able to give information on the resonant and fundamental frequencies of a soil site, especially when the soil has a good impedance contrast [8,9,14,15]. However, the amplification factor obtained from the peak amplitude by this method is still debatable and may not give the true site amplification due to the occurrence of an earthquake [8,16]. Haghshenas, et al. in [4] indicate that the peak amplitude from this method can be considered to be a lower bound estimate of the actual amplification.
Sumatra Island is located along the Eurasian and Subducting Indo-Australian plate boundary. Along the western coast of Sumatra, the Indo-Australian plate subducts obliquely beneath the Eurasian plate. The parallel motion is accommodated by a dextral slip along the Sumatra Fault Zone. The dip subducting slab of the Indo-Australian plate is estimated about 10-15° for depths less than 40 km beneath Simeulue Island and about 13° for depths less than 30 km beneath the Mentawai Islands [17,18]. The subduction process causes high seismicity in this region. In the last decade, two devastating megathrust earthquakes occurred in the region of northern Sumatra, i.e. the 2004 MW 9.2 Sumatra-Andaman and 2005 MW 8.7 Nias earthquakes. These two earthquakes were located within 100 km from Simeulue Island. Simeulue Island, located west of the coast of Sumatra Island, is about 100 km from the subduction zone interface between the Indo-Australian and Eurasian Plates. Following the 2004 MW 9.2 earthquake, the northern region of Simeulue Island experienced an uplift of up to 150 cm, while the southern region experienced a subsidence of down to 50 cm [19,20]. The 2005 MW 8.7 earthquake caused an uplift of up to 150 cm in the southern region, while the northern part of the island remained stable [19].
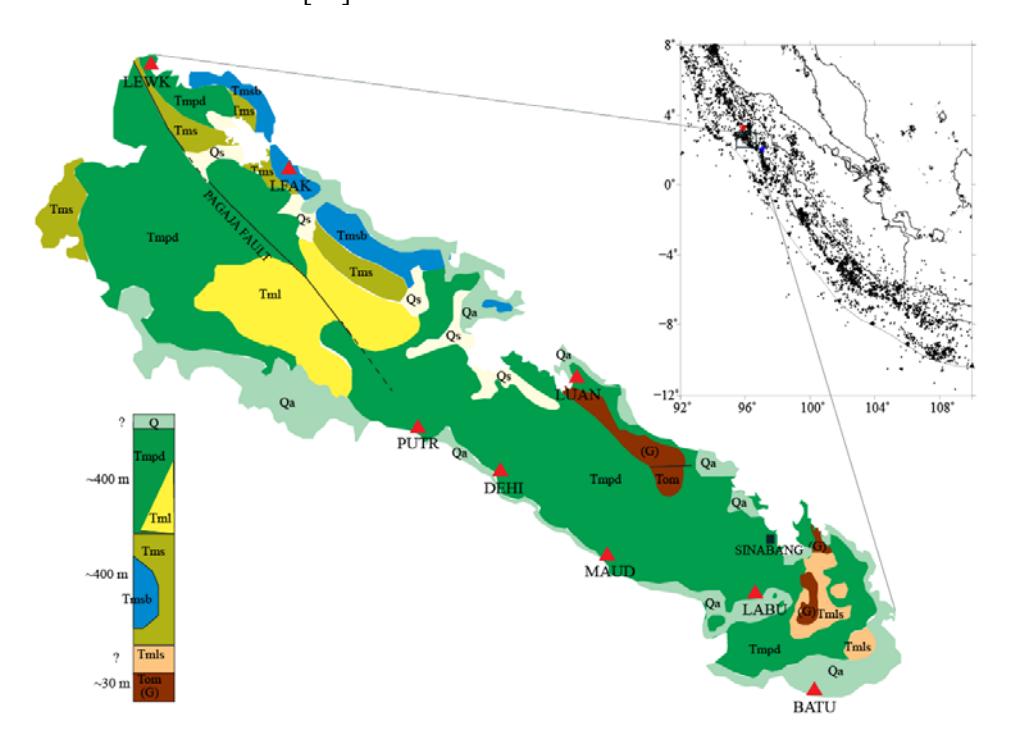
Figure 1 Geological map of Simeulue Island with major fault patterns [20]. Red triangles represent the locations of broadband seismometers used for microzonation study. The inset shows seismicity in 1960-2000 in this region with the location of Simeulue Island shown in a black square. The red and blue stars represent the 2004 MW 9.2 Sumatra-Andaman and the 2005 MW 8.7 Nias earthquake, respectively. Tmls: Lasikin Member of Sigulai Formation; Tmsb: Sibigo Formations; Tms: Sigulai Formaiton; Tml: Layabaung Formation; Tmpd: Dihit Formation; Qa: alluvium; Qs: Swam Deposits; Tom (G): Kuala Makmur Melange. Modified from Endharto and Sukido in [21]. The stratigraphic thickness was estimated based on Van Bemmelen [22] and Situmorang, et al. [23].
Simeulue Island is one of the outer forearc islands. The structures on the island represent a collision complex between the Indo-Australian and Eurasian plates. Faults trending NE-SW and NW-SE have been recognized on Simeulue Island, with a major fault (Pagaja Fault) found in the northern part. As for the geological conditions, Simeulue Island is mostly made up from a sedimentary sequence deposited during the Oligocene and Miocene epoch. A geological map of Simeulue Island is shown in Figure 1. There are five main strata of sedimentary rock found on the main island, i.e. Lasikin Member of Sigulai Formation Tmls (conglomerate), Sigulai Formation Tms (bedded marl and quartz sandstone), Sibigo Formation Tmsb (corraline limestone), Layabaung Formation Tml (tuffaeous sandstone), Dihit Formation Tmpd (arenite sandstone intercalated with siltsone and claystone) [20].
Geological processes of sedimentation, tectonic uplift and faulting have resulted in the complex geological outcrop shown in Figure 1. Although the Dihit Formation (Tmpd) is the dominant unit on Simeulue Island, other formations are also found on the island. Due to the geological conditions found on Simeulue Island, we suggest that spatial differences in ground response can be expected on the island. In this study, we investigated possible site-specific amplification factors and resonant frequencies from eight stations installed on Simuelue Island based on the H/V spectral ratio calculated from continuous ambient noise records.
2 Data and Processing
Eight three-component broadband seismometers (Guralp CMG-6TD) were installed on Simeulue Island during the period of December 2005–March 2006 [17]. In view of accessibility, the stations were installed near coastal roads in pits of about 60 cm depth [24]. Table 1 shows the location of each broadband seismometer installed on Simeulue Island for this study. The data were recorded at a sampling rate of 50 Hz. A one-hour period was selected for the continuous ambient noise recording and the records were manually inspected to avoid instrumental glitches and earthquake signals. Instrumental glitches may cause signal saturation in the selected window, which may affect the Fourier Transform. The selected periods of the records are given in Table 1.
| Station Code | Latitude (°N) | Longitude (°E) | Elevation (m) | Observation Period (UTC) |
|---|---|---|---|---|
| BATU | 2.3444 | 96.4087 | 32.7 | 2005/12/19 22.00 |
| LABU | 2.4223 | 96.3633 | 15.3 | 2005/12/26 22.00 |
| MAUD | 2.4674 | 96.2181 | 20.3 | 2005/12/19 22.00 |
| LUAN | 2.6284 | 96.2048 | 19.3 | 2006/01/10 11.00 |
| PUTR | 2.5809 | 96.0488 | 15.3 | 2005/12/19 22.00 |
| DEHI | 2.5479 | 96.1115 | 11.6 | 2005/12/19 22.00 |
| LFAK | 2.8216 | 95.9309 | 35.9 | 2005/12/19 22.00 |
| LEWK | 2.9236 | 95.8041 | 37.3 | 2005/12/19 22.00 |
Table 1 Broadband station locations on Simeulue Island used in this study.
The continuous ambient seismic noise records were analyzed using the Horizontal to Vertical (H/V) Spectral Ratio method. Processing of the data was carried out using the open source GEOPSY software [25]. The one-hour long records were used to compute the final average of the H/V spectral ratio and standard deviation.
We followed the procedure from SESAME (Site Effects Assessment using Ambient Excitations) for processing the ambient seismic noise records [9]. First, instrument effects were removed from the seismic records. In addition to the manual selection of the one-hour period, the STA/LTA anti-trigger algorithm was applied to remove non-stationary signals. The STA/LTA antitrigger algorithm was used to select windows without energetic signals caused by earthquakes or human activities. The procedure is to calculate the ratio of STA/LTA. The STA (short term average) is the average signal amplitude over a short time period, while the LTA (long term average) is the average signal amplitude over a longer period. In this study, 1 s and 30 s window lengths for STA and LTA respectively were selected. The STA/LTA ratio was set between 0.2 and 2.5. Windows with an STA/LTA ratio less than 0.2 or more than 2.5 were rejected to avoid ambient noise with abnormally low or very high amplitude. Thus, the rejected windows were not used for further processing.
The Fourier amplitude spectra of each component were calculated with a 25 s window length after applying a 5% cosine taper. The amplitude spectra were smoothed using the Konno-Ohmachi algorithm [26]. Next, the two horizontal component amplitude spectra were averaged and the H/V spectral ratio for each window and the average H/V spectral ratio were calculated. The H/V spectral ratio was computed in the 0.5-20 Hz range. Because a time window length Iw of 25 s with 5% overlap was used, this satisfies the criterion of having a minimum of 10 windows down to a frequency of 0.5 Hz [9]. The following criteria for reliable conditions of H/V spectral ratio measurement were used: the H/V peak frequency fo at a given window length Iw should be larger than 10/Iw, the number of significant cycles for the selected noise window should be larger than 200, and the standard deviation of the H/V amplitude at peak frequency fo should be less than the threshold values of 2.0 (fo > 0.5 Hz) and 3.0 (fo < 0.5 Hz) [9].
3 Results and Discussion
The calculated H/V spectral ratios from the eight locations are shown in Figure 2. It was observed that the amplitudes of the H/V ratio were generally above 2.0, which is considered a clear amplitude [9,12]. From Figure 2, it can be seen that the peak amplitudes of the H/V spectral ratios in the central part (LUAN, PUTR and DEHI) and the southern part of Simeulue Island (BATU, LABU and
MAUD) were lower than the peak amplitudes of the H/V spectral ratios in the northern part of the island (LFAK and LUAN). The BATU site is located on an alluvium (Qa), which is generally expected to show a strong peak in the H/V spectral ratio (Figure 1). However, this site showed a relatively low peak amplitude in the H/V spectral ratio, which indicates a lack of impedance contrast beneath the site. We suggest that this could be caused by the presence of hard rock beneath the alluvium layer. Teves-Costa, et al. in [27] measured the H/V spectral ratio on an alluvium layer with thickness varying up to 20 m, overlaying hard rock. They observed that the peak amplitude decreased with the increasing thickness of the alluvium layer.
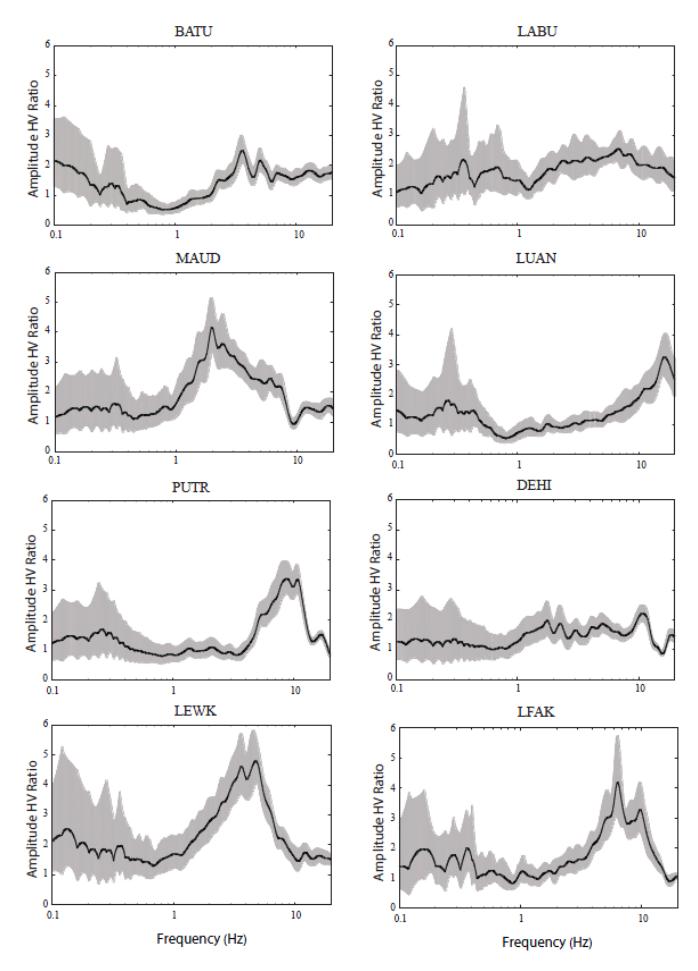
Figure 2 Observed H/V spectral ratios on Simeulue Island. The thick black line represents the mean H/V spectral ratio and the grey shaded area represents the standard deviation.
The LABU, MAUD, PUTR, DEHI, LUAN and LEWK sites are located on the Dihit Formation (Tmpd) (Figure 1). This formation is characterized by bedded arenite intercalated with siltstone and claystone [21]. The formation is expected not to amplify the ground motion. At these sites, the amplitudes of the H/V spectral ratio were observed to be generally less than 4.0. At the LABU and DEHI sites, the H/V spectral ratios were relatively flat as was to be expected from a hard rock formation [9,12]. A relatively flat spectral ratio may also indicate the lack of a sharp impedance contrast at depth [4,9]. However, the MAUD, PUTR, LUAN and LEWK sites showed strong peaks in the H/V spectral ratios. We suggest that these strong peaks may be attributed to the presence of a layer beneath the sites that causes a strong impedance contrast. The strong peaks in the observed H/V curves may also indicate that the sites are sitting on top of a soft layer overlaying bed rock [8,12]. It is also noted that the LEWK site is located on top of a small hill and may undergo amplification related to the surface topography for this reason [4].
The LFAK site showed a strong peak in the calculated H/V spectral ratio. This site is located on the Sibigo Formation (Tmsb), which is characterised by coralline limestone, calcarenite and calcirudite intercalated with sandstone [21]. The sandstone was developed in the lower part of the formation alternating with calcareous claystone to marl [21]. It is expected that the Sibigo Formation does not amplify the ground motion much. However, the occurrence of claystone in the formation may affect the ground motion, which manifests itself as strong peaks in the calculated H/V spectral ratio. At this site, also multiple peaks of the H/V spectral ratio were observed that are similar to those of the BATU, PUTR, LEWK, and LFAK sites at frequencies higher than 3.0 Hz. Multiple peaks in the H/V spectral ratio curves suggest the presence of a highly-weathered soil/clay layer on top of a compact medium [12].
The H/V peak frequencies (fo) from the measurements ranged between 2.0 Hz and 16.4 Hz (Figure 3). It has been estimated that the peak frequencies for thin soils – which indicate the fundamental frequency of the soil sites – range between 1.7 Hz and 9.0 Hz. For hard rock sites the peak frequencies are estimated higher than 10 Hz [10]. The DEHI and LUAN sites are located on the Dihit Formation of arenite sandstone and showed an fo higher than 10.0 Hz, which is expected from hard rock sites. Other sites located on the Dihit Formation (MAUD, LEWK, LABU, and PUTR) have an fo ranging between 2.0 and 8.7 Hz. We suggest that this characteristic may be influenced by the presence of thin soil overlaying the formation. A similar characteristic was observed at the LFAK site located on the Sibigo Formation, which showed an fo of about 6.0 Hz. The BATU site located on alluvium showed an fo of about 4.0 Hz as expected from thin soil [10].
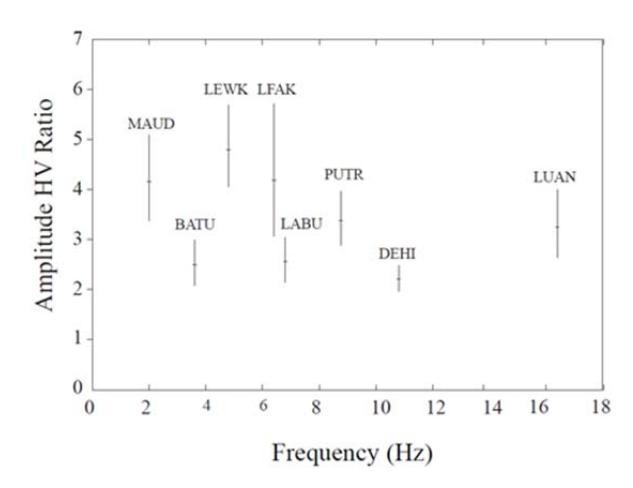
Figure 3 The observed amplitudes of H/V spectral ratio as a function of peak frequency. The vertical lines represent the standard deviation of the observed amplitude of the H/V spectral ratio.
To get a more comprehensive understanding of the characteristics and spatial distribution of the amplitude of the H/V peaks and fo, we plotted them on the map of Simeulue Island (Figure 4). At the sites located in the central part (LUAN, PUTR, and DEHI) and the southern part (BATU, LABU, and MAUD) of the island, it was observed that the amplitudes of the H/V ratio were mostly less than 4.0, except at the MAUD site. At the sites located in the northern part of the island (LFAK and LEWK), we observed that the amplitudes of the H/V ratio were mostly higher than 4.0 (Figure 4(a)). From this figure it can be seen that the peak amplitudes of the H/V spectral ratios at the sites in the central and the southern part of the island were lower than the peak amplitudes of the H/V spectral ratios at the sites located in the northern part.
The observed H/V peak amplitudes were generally smaller than the actual amplification, although in some cases the H/V peak amplitude was higher than the actual amplification [4]. Although the H/V peak amplitude could not be assumed to be the true amplification due to ground motion, this may indicate the lower bound of the site amplification due to the occurrence of an earthquake [4,28]. The difference between the actual amplification and the H/V peak amplitude may be caused by the different composition and proportion of the body and surface wave from the wave sources. Based on the peak amplitude distribution map, we suggest that the northern part may experience more soil amplification than the southern part of the island when an earthquake hits the area. It is also suggested that the interpretation of H/V ellipticitiy (H/V curve around peak frequency) may be valid only beyond peak frequency and only when the noise source is nearby and the impedance contrast is large, as discussed in [7]. From the results of the numerical analyses it can be seen that the amplitude of the H/V peaks is mostly contributed from the body waves in the case of nearby seismic noise sources and limited impedance contrast [7].
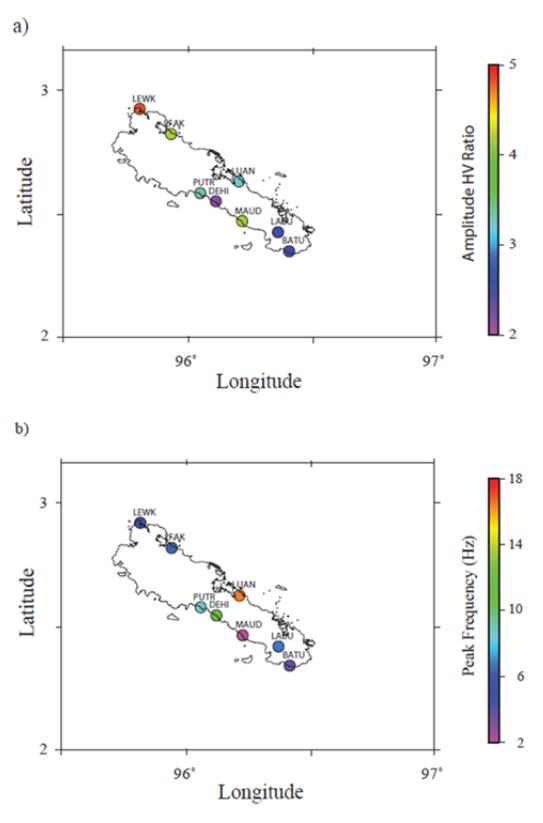
Figure 4 Spatial distribution of (a) amplitude of H/V peaks and (b) peak frequencies, fo, from H/V measurements on Simeulue Island.
It has been shown that the H/V spectral ratio method may provide useful information on the fundamental frequency of rock sites [10,12,29]. Malischewsky, et al. in [29] carried out analytical studies to obtain the correlation between the H/V spectral ratio and Rayleigh ellipticity assuming a noise wavefield consisting of Rayleigh waves [29]. They found that the frequency peak on the H/V spectral ratio curve corresponds to the shear wave resonance in the medium layer. In this study, we determined the fundamental frequency based on the highest amplitude of the H/V ratio. We observed three distributions of H/V peak frequency (fo) on Simeulue Island. At the sites located in the southern part of the island (BATU, LABU, and MAUD), fo varied between 2.0 Hz and 6.7 Hz. At the sites located in the northern part (LFAK and LEWK) fo ranged between 4.9 Hz and 6.4 Hz. In the central part of the island (sites LUAN, PUTR, and DEHI), fo ranged between 8.8 Hz to 16.4 Hz. Areas with peak frequency above 10 Hz are considered to be rock sites [10]. From the distribution of peak frequencies, we suggest that the sites in the central part of Simeulue Island may sit on a rock site. The sites in the central part are mainly located on an outcrop of the Dihit Formation. At the BATU, LABU and DEHI sites it was found that it is quite difficult to determine a clear peak that identifies the fundamental frequency, even though the H/V curves were relatively unflat. This may be caused by a lack of sharp impedance contrast. Some studies have suggested that due to its dependence on the contrast impedance of the layer, the H/V spectral ratio method works very well on soft deposits overlaying hard bedrock but are less effective on thick deposits [4,30].
4 Conclusions
Information was extracted from the H/V spectral ratio measured by 8 broadband seismometers installed on Simeulue Island. Applying the H/V spectral ratio method to one-hour data of continuous ambient seismic noise data, information on peak frequencies and the amplitude of H/V peaks was retrieved. This provided information on the fundamental frequencies of the soil sites and the lower bound of the amplitude of the amplification factor. The fundamental soil frequencies observed on Simeulue Island ranged between 2.0 Hz and 16.4 Hz. It was obtained that the observation sites may generally sit on thin soil with a fundamental frequency ranging from 1.7 Hz to 9.0 Hz. However, the DEHI and LUAN sites showed fundamental frequencies higher than 10 Hz, which means that these sites may be related to hard rock. The fundamental frequencies derived from the H/V spectral ratio measurement provided information on the soil structure to assess the soil amplification. Detailed microzonation studies with denser network coverage in this region may give a better understanding of the ground vulnerability due to earthquake occurrence.
Acknowledgements
This work was funded by the Indonesian Institute of Sciences through Competitive Research Grant No. 3408.005.001.011. The broadband seismometers were provided by SeisUK (loan 800). Data were available through the IRIS Data Management Center. The facilities of IRIS Data Services and specifically the IRIS Data Management Center were used for access to waveforms, related metadata, and/or derived products used in this study. IRIS Data Services are funded through the Seismological Facilities for the Advancement of Geoscience and EarthScope (SAGE) Proposal of the National Science Foundation under Cooperative Agreement EAR-1261681. We thank the reviewers for their constructive comments. Some figures were prepared using the Generic Mapping Tools (GMT) by Wessel and Smith (1991). Lastly, we benefited from discussions with J. Julio.