
1 Introduction
The human immunodeficiency virus type 1 (HIV-1) is a retrovirus that infects the cells of the immune system expressing receptor CD4 and co-receptor CCR5 on their surfaces [1]. When HIV enters into the individual's body via epithelium mucosa, it attacks target cells such as Langerhans cells and CD4<sup>+</sup>T cells in the genital mucosal. The spread of the HIV infection in the genital tract can occur through cell-to-cell contact or virus-to-cell contact [2].
Highly active anti-retroviral therapy (HAART) is one of the HIV treatment strategies that is effective through suppressing the viral load. It has a combination of one or more reverse transcriptase inhibitors (RTIs) as well as protease inhibitors (PIs). RTI drugs prevent infection of target cells, while PI drugs prevent active infected target cells from producing infectious virus particles [3].
A number of in-host HIV-1 infection dynamic models have been developed to study the effects of antiretroviral (ARV) therapy and theoretically associating it to the development of treatment strategies for HIV-infected individuals [4-10]. A simple dynamic model of RTI monotherapy was proposed by Srivastava, et al. [6], classifying the infected CD4<sup>+</sup>T cells into two categories, namely the class of infected CD4<sup>+</sup>T cells in the process of acquiring a pre-RTI drug and the class of infected CD4<sup>+</sup>T cells having fully acquired the RTI drug. Their results suggested that the HIV infection is cleared when the drug efficacy exceeds a critical value. De Leenheer [7] employed a standard model incorporating treatment by using a piecewise constant periodical signal to approximate drug efficiency. The results of the study showed that HIV infection is cleared more quickly when the drug is more efficient and effective over a longer time period.
A similar model incorporating RTI and PI therapies is proposed in [8] in order to assess the impact of therapy on the dynamics of the disease due to imperfect adherence and emergence of drug resistance to the treatment regime. The efficacy functions were modeled by bang-bang and single-dose pharmacokinetic type. The average drug efficacy formulated from the single-dose pharmacokinetics model was used to investigate the outcome of HIV infection during ARV treatment under different scenarios. The results of the study suggested that PIs are more efficient than RTIs when used as monotherapy and that a combination of RTIs and PIs is more effective than monotherapy. Using a simple model of ARV therapy with constant efficacy, Perelson [10] revealed the dynamics of the HIV viral load and provided insight in the development of drug therapies. The study focused only on CD4<sup>+</sup>T cells as target cells for HIV.
Chirove, et al. [11] have proposed an in-host HIV-1 infection model that captures the interaction between the free virus, Langerhans cells and CD4<sup>+</sup>T cells during early HIV infection. The results from their study showed that viral degradation slows down the progression of the HIV infection, whereas viral lysis increases the HIV infection. Sutimin, et al. [12] modified the model in [11] to incorporate a combination of RTI and PI drugs administered periodically. For periodical drug dosing, a pharmacokinetics profile of the drug concentration was used by considering steady state pharmacokinetics. The results from the study suggested that suboptimal adherence and drug resistance cause treatment failure.
More realistic models need to capture drug efficacy as a function of periodic pharmacokinetics with multi-dosing. This enables one to realistically capture
drug accumulation in the plasma before administering the next dose. Pharmacokinetics of drugs in the body during drug administration varies over time due to the processes of drug absorption, distribution and metabolism in the body, which take place at variable rates [13]. Thus, the drug concentration in the body is also determined by the drug content in the body before administering the drug for the next drug dosing. The continuous uptake of HAART was met with a number of challenges. It was proved that there is rapid waning of adherence by the patients. This is associated with increased myocardial infarction rates, putting individuals at risk of coronary artery disease or accelerated liver disease due to metabolic effects of HAART. On the other hand, high medical costs impede efforts to increase the efficacy of HAART. One of the strategies to avert the aforementioned effects is the introduction of drug holidays. There are two types of drug holidays, namely time-dependent holidays and CD4 count-dependent holidays. CD4 count-defined holidays have been extensively used, whereas little attention has been given to time-dependent holidays, even though they have the potential to optimize ARV therapy [14]. The safety and efficacy of time-dependent drug holidays still remains to be determined.
Available evidence reflects that HIV transmission occurs on different immune cells. Focusing on CD4+ T cells only may underestimate the actual impact of the HIV infection. Furthermore, various transmission mechanisms of infection such as cell-to-cell transmission also contribute to HIV invasion of the immune system [2,9].
In this paper, we use the model from [12] and emphasize the importance of using pharmacokinetics as a realistic way to capture the effects of RTIs and PIs. Unlike in [12], our objective was to investigate the impact of multiple drug dosing, incorporating drug accumulation with drug holidays in combined RTI and PI therapies on HIV-1 infection. We considered that the drugs are only effective on wild-type virus and do not take into account drug-resistant mutant strains, mutants due to copying errors, or mutants due to the virus changing its genome. We have carried out analysis of the uninfected steady state and investigated numerically the consequences of different treatment scenarios and their impact on the evolution of both the host cells and the free virus.
2 Model Incorporating Combined RTI and PI Treatment
We used the model from Sutimin, et al. in [12], introducing the following modifications: (i) introducing RTI and PI treatments in multiple drug dosing with drug holidays, and (ii) introducing additional viral production by Langerhans cells and death of Langerhans cells due to viral lysis. Each population of the target cells is divided into two subclasses that do and do not
react to drugs, a scenario clarified by the hapten and p-i concepts on drug action and drug reaction by immune cells [15,16]. The model involves nonlinear ODEs of state variables relating to the populations of susceptible Langerhans cells (L) that do not react to active drugs, susceptible CD4<sup>+</sup>T cells (T) that do not react to active drugs, susceptible Langerhans cells in the process of acquiring active drugs (\(T_d\)), susceptible CD4<sup>+</sup>T cells with active drugs (\(T_d\)), infectious Langerhans cells (\(T_d\)), infectious CD4<sup>+</sup>T cells (\(T_d\)), and the free virus (\(T_d\)). The model is given as follows:
\[\dot{L} = \lambda_l - \mu_l L - \frac{\beta_1 V L}{A + L} - \frac{\beta_2 L (L_i + T_i)}{A + L} - \sigma_1 L \tag{1}\]
\[\dot{T} = \pi - \mu T - (\beta_3 L_i + \beta_4 T_i + \beta_5 V) T - \sigma_2 T \tag{2}\]
\[\dot{L}_{d} = \sigma_{1}L - \mu_{l}L_{d} - \frac{\beta_{1}(1 - \delta\epsilon_{RTI})VL_{d}}{A + L_{d}} - \frac{\beta_{2}(1 - \delta\epsilon_{RTI})L_{d}(L_{i} + T_{i})}{A + L_{d}}\] \[(3)\]
\[T_{d} = \sigma_{2}T - (1 - \epsilon_{RT})(\beta_{3}L_{i} + \beta_{4}T_{i} + \beta_{5}V)T_{d} - \mu T_{d}\] (4)
\[\text{[rumus tidak dapat ditampilkan dengan baik — lihat PDF asli]}\]
\[\frac{\beta_2 L(L_i + T_i)}{A + L} + \frac{\beta_2 (1 - \delta \epsilon_{RT}) L_d(L_i + T_i)}{A + L_d} \tag{5}\]
\[T_{i} = (\beta_{3}L_{i} + \beta_{4}T_{i} + \beta_{5}V)(T + (1 - \epsilon_{RTI})T_{d}) - (\mu + \alpha)T_{i}\] (6)
\[V = \alpha \left(1 - \epsilon_{p_I}\right) NT_i + \rho \left(1 - \epsilon_{p_I}\right) ML_i - \frac{\phi V \left(L + L_d\right)}{A + L + L} - \mu_v V \tag{7}\]
The parameters of \(\epsilon_{RTI}\) and \(\epsilon_{PI}\) \((0 \le \epsilon_{RTI}, \epsilon_{PI} \le 1)\) represent RTI and PI drug efficacies, respectively, where \(\delta \epsilon_{RTI}\) \((0 \le \delta \le 1)\) is the effectiveness of RTI in preventing the infection of Langerhans cells due to the longer-lived infection and the more complex infection pathways of Langerhans cells compared to CD4<sup>+</sup>T cells [2,17].
Eqs. (1) and (2) describe susceptible Langerhans and CD4<sup>+</sup>T cells. We assume that they are produced in the body at constant rates \(\lambda_l\) and \(\pi\), respectively. HIV infection of Langerhans cells is inhibited by the degradation mechanism in the
Langerhans cells with half-saturation constant A. The Langerhans and CD4<sup>+</sup>T cells diminish by natural death at constant rates \(\mu_l\) and \(\mu\), respectively. Susceptible Langerhans cells can be infected by the free virus and by infected Langerhans and infected CD4<sup>+</sup>T cells at constant rates \(\beta_l\), \(\beta_2\), respectively. Healthy CD4<sup>+</sup>T cells can be infected by infected Langerhans cells, by infected CD4<sup>+</sup>T cells and by the free virus at constant rates \(\beta_3\), \(\beta_4\), \(\beta_5\) respectively. We used a mass-action type model to describe the infection of CD4<sup>+</sup>T cells by infected Langerhans cells, infected CD4<sup>+</sup>T cells and the free virus.
Once the treatment has started, susceptible Langerhans and CD4<sup>+</sup>T cells that acquire active drugs move to new classes \(L_d\) and \(T_d\) at constant rates \(\sigma_1\) and \(\sigma_2\), respectively. Eqs. (3) and (4) describe the populations of Langerhans and CD4<sup>+</sup>T cells that acquire active drugs. They diminish due to natural death at constant rates \(\mu_l\) and \(\mu\), respectively. Once target cells acquire the active drugs, the infection rates of the Langerhans cells caused by the free virus, and by both infected Langerhans and infected CD4<sup>+</sup>T cells are reduced to \(\beta_1(1-\delta\epsilon_{RTI})\) and \(\beta_2(1-\delta\epsilon_{RTI})\), respectively, due to the effect of the drugs preventing the infection of target cells. The infection rates of susceptible CD4<sup>+</sup>T cells caused by infected Langerhans cells, by infected CD4<sup>+</sup>T cells and the free virus are reduced to \(\beta_3(1-\epsilon_{RTI})\), \(\beta_4(1-\epsilon_{RTI})\) and \(\beta_5(1-\epsilon_{RTI})\), respectively. We assume that the populations of target cells (i.e. Langerhans and CD4<sup>+</sup>T cells) with active drugs grow proportionally to the number of each healthy target cell with a constant of proportionality \(\sigma_1\) (for the Langerhans cell population) and \(\sigma_2\) (for the CD4<sup>+</sup>T cell population).
In Eq. (5), the population of infected Langerhans cells is produced from both susceptible Langerhans cells and Langerhans cells in the process of acquiring active drugs that become newly infected cells. It diminishes due to the natural and viral lysis death at constant rates \(\mu_{l}\), \(\rho\), respectively. In Eq. (6), the population of infected CD4<sup>+</sup>T cells is generated from both susceptible CD4<sup>+</sup>T cells and CD4<sup>+</sup>T cells with active drugs that become newly infected cells, and diminishes due to natural and viral lysis death at constant rates \(\mu\), \(\alpha\), respectively. Eq. (7) describes the free virus population. The death of target cells due to viral lysis induces the free virus production of infected target cells that supplies the free virus population. Once the target cells acquire active drugs, the average of the infectious virus production by actively infected CD4<sup>+</sup>T cells and infected Langerhans cells is reduced to \(\alpha (1 - \epsilon_{p_I}) N\) and \(\rho (1 - \epsilon_{p_I}) M\)respectively, due to PI drug action in blocking infectious virion production. The free virus population decreases due to degradation of healthy Langerhans cells and Langerhans cells with active drugs at constant rate \(\phi\), and it dies at constant rate u...
3 Model Analysis
We recall that the basic reproductive number, \(\Re_0\), is the average number of secondary infections of target cells that are generated when one infected cell or virus is introduced into a susceptible cell population. The next generation matrix [18] of the model Eq. (1) – Eq. (7) is given by
\[G = \begin{bmatrix} 0 & \frac{\beta_2 \Theta_3}{\Theta_1} & \frac{\beta_1 \Theta_3}{\phi \Phi_2 + \mu_\nu} \\ \frac{\beta_3 \Theta_4}{\Theta_2} & 0 & \frac{\beta_5 \Theta_4}{\phi \Phi_2 + \mu_\nu} \\ \frac{\rho (1 - \epsilon_{p_I}) M}{\Theta_2} & \frac{\alpha (1 - \epsilon_{p_I}) N}{\Theta_1} & 0 \end{bmatrix}, \tag{8}\] where, \[\Theta_{3} = (1 - \delta \epsilon_{RTI}) \Phi_{1} + \Phi, \qquad \Theta_{4} = T_{1} + (1 - \epsilon_{RTI}) T_{d_{1}},\] \[\Theta_{1} = \mu + \alpha - \beta_{4} (1 - \epsilon_{RTI}) T_{d_{1}} - \beta_{4} T_{1}, \qquad \Theta_{2} = \mu + \rho - \beta_{2} (1 - \delta \epsilon_{RTI}) \Phi_{1} - \beta_{2} \Phi,\] \[\Phi = \frac{L_{1}}{A + L_{1}}, \quad \Phi_{1} = \frac{L_{d_{1}}}{A + L_{d_{1}}}, \quad \Phi_{2} = \frac{L_{1} + L_{d_{1}}}{A + L_{1} + L_{d_{1}}}, \quad L_{1} = \frac{\lambda_{1}}{\mu_{1} + \sigma_{1}}, \quad T_{1} = \frac{\pi}{\mu + \sigma_{2}}\] \[L_{d_{1}} = \frac{\sigma_{1} \lambda_{1}}{\mu_{1} (\mu_{1} + \sigma_{1})} \quad \text{and} \quad T_{d_{1}} = \frac{\sigma_{2} \pi}{\mu (\mu + \sigma_{2})}. \quad \text{The basic reproduction number } \Re_{0} \text{ is}\] defined as the spectral radius of G. The threshold number \(\Re_0\) cannot be obtained from the analytical calculation. Thus, we estimate this number using an alternative reproduction number \(\Re_1\) that provides a significant biological interpretation. The characteristic polynomial of matrix G is \(F(X) = X^3 - A_1 X - A_0\), where
\[\begin{split} A_{\mathbf{l}} &= \frac{N\alpha\Theta_{4}\left(1-\epsilon_{PI}\right)\beta_{\mathbf{5}}}{\left(\phi\Phi_{2}+\mu_{\nu}\right)\Theta_{\mathbf{l}}} + \frac{M\rho\left(1-\epsilon_{PII}\right)\left(\left(1-\delta\epsilon_{RTI}\right)\Phi_{\mathbf{l}}+\Phi\right)\beta_{\mathbf{l}}}{\left(\phi\Phi_{2}+\mu_{\nu}\right)\Theta_{2}} + \frac{\left(\left(1-\delta\epsilon_{RTI}\right)\Phi_{\mathbf{l}}+\Phi\right)\Theta_{4}\beta_{2}\beta_{\mathbf{3}}}{\Theta_{\mathbf{l}}\Theta_{2}}\,,\\ A_{\mathbf{0}} &= \frac{\Theta_{4}\left(1-\epsilon_{PII}\right)\left(\left(1-\delta\epsilon_{RTI}\right)\Phi_{\mathbf{l}}+\Phi\right)\left(M\rho\beta_{2}\beta_{\mathbf{5}}+N\alpha\beta_{\mathbf{l}}\beta_{\mathbf{3}}\right)}{\Theta_{2}\left(\phi\Phi_{2}+\mu_{\nu}\right)\Theta_{\mathbf{l}}}\,. \end{split}\]
Following the analysis in [11], the parameter \(\Re_1\), where \(\Re_1 > 0\), as an alternative reproduction number is determined from F(X) = 0 that satisfies F(1) = 0. By defining \(\Re_1^2 = A_1 + A_0\), the quantity \(\Re_1^2\) can be represented as a linear combination of four cycles of infection as follows,
\[\mathfrak{R}_{1}^{2} = \mathfrak{R}_{T_{i} \to V \to T_{i}} + \mathfrak{R}_{T_{i} \to L_{i} \to T_{i}} + \mathfrak{R}_{T_{i} \to V \to L_{i} \to T_{i}} + \mathfrak{R}_{T_{i} \to L_{i} \rightleftharpoons V \to T_{i}}, \tag{9}\]
\[\begin{split} \text{where} & \quad \Re_{T_i \to V \to T_i} = \frac{\left(1 - \epsilon_{PI}\right) N \alpha \Theta_4 \beta_5}{\Theta_1 \left(\phi \Phi_2 + \mu_v\right)} \,, \qquad \quad \Re_{T_i \to V \to L_i \to T_i} = \frac{\beta_3 \beta_1 \alpha N \left(1 - \epsilon_{PI}\right) \Theta_4 \Theta_3}{\Theta_2 \Theta_1 \left(\phi \Phi_2 + \mu_v\right)} \,, \\ \Re_{T_i \to L_i \to T_i} &= \frac{\Theta_3 \beta_2 \beta_3 \Theta_4}{\Theta_2 \Theta_1} \,, \quad \Re_{T_i \to L_i \rightleftarrows V \to T_i} = \frac{\left(1 - \epsilon_{PI}\right) \Theta_3 \rho M \left(\Theta_4 \beta_2 \beta_5 + \Theta_1 \beta_1\right)}{\Theta_2 \Theta_1 \left(\phi \Phi_2 + \mu_v\right)} \,. \end{split}\]
We note that the quantities \(\frac{1}{\Theta_1}\), \(\frac{1}{\Theta_2}\) represent the average time periods when actively infected CD4<sup>+</sup>T cells and actively infected Langerhans cells spread the virus, respectively. These quantities should be positive values, thus we assume that the quantities \(\Theta_1\), \(\Theta_2\) are positive.
As described in [11], the sub-reproduction number, \(\Re_{T \to W \to T}\), is the cycle of infection that interprets the average number of newly infected CD4<sup>+</sup>T cells generated by an infected CD4<sup>+</sup>T cell that replicates new infectious virus particles (affected by blocking of PIs). Subsequently, viruses infect the susceptible CD4<sup>+</sup>T cells to become newly infected CD4<sup>+</sup>T cells. The subreproduction number \(\Re_{T \to L \to T}\) interprets the average number of new infections of target cells propagated by one infected CD4<sup>+</sup>T cell that infects susceptible Langerhans cells to become newly infected Langerhans cells (due to the RTI drug not being responded by all target cells). Next, these infected cells transmit the infection to susceptible CD4<sup>+</sup>T cells to become the new infections of CD4<sup>+</sup>T cells. The sub-reproduction number, \(\Re_{T \to V \to L \to T}\), interprets as the average number of newly infected target cells caused by one infected CD4<sup>+</sup>T cell that replicates new infectious virus particles (affected by PI blocking), which infect susceptible Langerhans cells to create new infections of Langerhans cells. In turn these infected Langerhans cells infect susceptible CD4<sup>+</sup>T cells to create new infections of CD4<sup>+</sup>T cells. \(\Re_{T_i \to I_i \rightleftharpoons V \to T_i}\), interprets as the average number of newly infected target cells caused by one infected CD4<sup>+</sup>T cell that infects Langerhans cells producing infectious virus particles, where these viruses infect other Langerhans cells to become newly infected Langerhans cells that produce viruses. In turn these viruses infect susceptible CD4<sup>+</sup>T cells becoming new infections of CD4<sup>+</sup>T cells. In the next section, we show the use of the alternative reproduction number to analyze the local stability of the uninfected steady state of the model. Unlike in [11], the additional drug active classes make the computation of the endemic equilibrium point complicated and difficult to express in closed form. We used the instability conditions of the disease-free equilibrium to infer the existence of the endemic equilibrium point.
3.1 Stability of the Uninfected Steady State
When the virus is not detected in the plasma or fully suppressed in the body during ARV treatment, the system possesses an uninfected steady state. The uninfected steady state of the model is given by \(E_0 = (L_0, L_{d_0}, 0, T_0, T_{d_0}, 0, 0)\). This disease-free status is typical of the virus being suppressed below detection while the individual still has to take drugs for protection. Otherwise, when the drug is stopped the individual may actually get to a completely disease-free, drug-free state or return to the endemic status where virus, infected Langerhans cells and infected CD4<sup>+</sup>T cells are present in the body. We analyze the stability of the disease-free equilibrium for the model. The following theorem expresses the local stability of \(E_0\) that is determined by threshold number \(\mathfrak{R}_1\).
Theorem 3.1 The disease-free equilibrium \(E_0\) is locally asymptotically stable when \(\Re_1 < 1\) and \(\Theta_1 > \Theta_2\), and unstable when \(\Re_1 > 1\).
Proof. The Jacobian matrix of the model Eq. (1) – Eq. (7) at \(E_0\), \(J(E_0)\) is given by
\[\begin{bmatrix} -\mu_{l} - \sigma_{1} & 0 & 0 & 0 & -\beta_{2}\Phi & -\beta_{2}\Phi & -\beta_{1}\Phi \\ 0 & -\mu_{l} - \sigma_{2} & 0 & 0 & -\beta_{3}T_{0} & -\beta_{4}T_{0} & -\beta_{5}T_{0} \\ \sigma_{1} & 0 & -\mu_{l} & 0 & \beta_{2}(\delta\epsilon_{RTI} - 1)\Phi_{1} & \beta_{2}(\delta\epsilon_{RTI} - 1)\Phi_{1} & \beta_{1}(\delta\epsilon_{RTI} - 1)\Phi_{1} \\ 0 & \sigma_{2} & 0 & -\mu & \beta_{3}(\epsilon_{RTI} - 1)T_{0} & \beta_{4}(\epsilon_{RTI} - 1)T_{0} & \beta_{5}(\epsilon_{RTI} - 1)T_{0} \\ 0 & 0 & 0 & 0 & -\Theta_{2} & \beta_{2}\Theta_{3} & \beta_{1}\Theta_{3} \\ 0 & 0 & 0 & 0 & \beta_{3}\Theta_{4} & -\Theta_{1} & \beta_{5}\Theta_{4} \\ 0 & 0 & 0 & 0 & \rho(1-\epsilon_{PI})M & \alpha(1-\epsilon_{PI})N & -\phi\Phi_{2} - \mu_{v} \end{bmatrix}\]
The eigenvalues of \(J(E_0)\) are \(\lambda_1 = -\mu_1\), \(\lambda_2 = -\mu_2\), \(\lambda_3 = -(\mu + \sigma_2)\), \(\lambda_4 = -(\mu_1 + \sigma_1)\), the others satisfy the equation
\[\lambda^{3} + a_{2}\lambda^{2} + a_{1}\lambda + a_{0} = 0\] \[a_{2} = \mu_{v} + \phi\Phi_{2} + \Theta_{1} + \Theta_{2}, a_{0} = (\phi\Phi_{2} + \mu_{v})\Theta_{1}\Theta_{2}(1 - \Re_{1}^{2}),\] \[a_{1} = (\phi\Phi_{2} + \mu_{v})(\Theta_{1}(1 - \Re_{1}^{2}) + \Theta_{2}) + \Theta_{1}\Theta_{2}(1 - \Re_{1}^{2}) + \frac{z_{1}}{\Theta_{2}} + \frac{z_{2}}{\phi\Phi_{2} + \mu_{v}},\] \[z_{2} = \Theta_{4}\alpha N(1 - \epsilon_{p_{1}})(\beta_{5}\Theta_{2} + \beta_{1}\beta_{3}\Theta_{3}) + \Theta_{3}\rho M(1 - \epsilon_{p_{1}})(\beta_{1}\Theta_{1} + \beta_{2}\beta_{5}\Theta_{4}),\] \[z_{1} = \Theta_{3}\Theta_{4}(\beta_{2}\beta_{3}(\phi\Phi_{2} + \mu_{v}) + (1 - \epsilon_{p_{1}})(\beta_{1}\beta_{3}\alpha N + \beta_{5}\beta_{2}\rho M)) + (1 - \epsilon_{p_{1}})(\Theta_{1} - \Theta_{2})M\rho\Theta_{3}\beta_{3}.\]
We see that \(a_2 > 0\), \(a_0 > 0\) if \(\Re_1^2 < 1\). Next, we prove that \(a_2 a_1 - a_0 > 0\). By manipulating the calculation for the condition \(a_2 a_1 - a_0\), we obtain that
\[a_{1}a_{2} - a_{0} = \Theta_{1} \left( \left( \phi \Phi_{2} + \mu_{v} \right)^{2} + \left( \Theta_{1} + \Theta_{2} \right) \left( \phi \Phi_{2} + \Theta_{2} + \mu_{v} \right) \right) \left( 1 - \Re_{1}^{2} \right) +\] \[a_{2} \left( \phi \Phi_{2} + \mu_{v} \right) \Theta_{2} + \frac{a_{2}z_{1}}{\Theta_{2}} + \frac{a_{2}z_{2}}{\phi \Phi_{2} + \mu_{v}} \cdot\]
It is clear that \(a_2a_1-a_0>0\) when \(\mathfrak{R}_1^2<1\) and \(\Theta_1>\Theta_2\). The Routh-Hurwitz stability criteria are satisfied if \(\mathfrak{R}_1^2<1\) and \(\Theta_1>\Theta_2\). We note that for \(0<\mathfrak{R}_1\), we have \(\mathfrak{R}_1^2<1\) if \(\mathfrak{R}_1<1\). Thus the disease-free equilibrium is locally asymptotically stable if \(\mathfrak{R}_1<1\) and \(\Theta_1>\Theta_2\). On the other hand, if \(\mathfrak{R}_1>1\) then \(\mathfrak{R}_1^2>1\). This implies that \(a_0<0\). When \(a_0<0\), there is one sign change in Eq. (10). By Descartes' rule of signs, there is exactly one positive zero of Eq. (10). We conclude that there is exactly one positive eigenvalue if \(\mathfrak{R}_1>1\). Thus the disease free equilibrium is unstable if \(\mathfrak{R}_1>1\).
In the next section, we study the drug pharmacokinetics in the body when the drug is administered periodically and orally, and also formulate the drug concentration as a periodic function of the pharmacokinetics model.
3.2 Time-varying Drug Efficacy of Multiple Dose Pharmacokinetics
Pharmacokinetics is the concept that explains the kinetics of absorption, distribution and elimination of drugs inside the body. We describe the plasma concentration of the drug assuming that the body is a one-compartment model. In dosing the drug orally, the drug concentration in the body rises rapidly, which is characterized by absorption and distribution in the body. After achieving its maximum, it decreases slowly due to elimination from the body [3,19]. We define the drug concentration in an initial single dose as follows,
\[C(t) = \begin{cases} C(0) + \frac{\left(C_{\text{max}} - C(0)\right)\left(1 - e^{-t}\right)}{1 - e^{-T_{\text{max}}}}, & t \in [0, T_{\text{max}}] \\ C_{\text{max}} e^{-k(t - T_{\text{max}})}, & t \in [T_{\text{max}}, \tau] \end{cases}\] (11)
where \(\tau\) is the drug dosing interval, \(t_{1/2}\) is the serum half-life, \(t_{1/2}\), and
\(T_{max}\) is the time when the drug achieves peak concentration. In multiple dosing, the drug concentration in the body at the next dose is higher due to drug accumulation from previous doses. We use the concentration function in Eq. (11) to formulate the drug concentration in the body in multiple dosing. By using the superposition principle, the actual drug concentration in the body in the \((n+1)^{\text{th}}\) dosing cycle, n=0,1,2,3,... is given by \(C_n(t)=\Phi_n(t)+F_n(t)\), where
\[\Phi_{n}\left(t\right) = \frac{C_{\max} e^{-k(\tau - T_{\max})} \left(1 - e^{-nk\tau}\right)}{1 - e^{-k\tau}}, t \in [n\tau, (n+1)\tau],\]
\[F_{n}(t) = \begin{cases} C(0) + \frac{\left(C_{\max} - C(0)\right)\left(1 - e^{-(t-n)\tau}\right)}{1 - e^{-T_{\max}}}, & t \in [n\tau, T_{\max} + n\tau] \\ C_{\max} e^{-k(t-n\tau - T_{\max})}, & t \in [T_{\max} + n\tau, (n+1)\tau] \end{cases}.\]
We define the drug efficacy function [19] as \(\epsilon(t) = \frac{C(t)}{IC_{50} + C(t)}\), where C(t) is the drug concentration and \(IC_{50}\) is the drug concentration required for inhibiting viral replication by 50%.
The concentration and efficacy evolutions for each RTI and PI drug in the body in multiple drug dosing are presented in the next section.
4 Simulation Results
We performed numerical simulations to describe the implications of RTI and PI treatments modeled by pharmacokinetic type with respect to the dynamics of free virus load, Langerhans and CD4<sup>+</sup>T cells for early HIV-1 infection.
| Drugs | Dosage | Cmax (µM) | Tmax (h) | t1/2 (h) | IC50 (μΜ) |
|---|---|---|---|---|---|
| RTIs | |||||
| DLV | 400 mg,12 h | 35 | 1.3 | 3.3-8.3 | 0.001-0.69 |
| EFV | 600 mg, 24 h | 12.9 | 3-5 | 52-76 | 0.001-0.11 |
| NVP | 200 mg, 24 h | 5.58 | 4 | 16.5 | 0.01-0.1 |
| PIs | |||||
| APV | 1,200 mg, 8 h | 20.7 | 1-2 | 7.1-10.6 | 0.012-0.08 |
| IDV | 800 mg, 12 h | 12.63 | 0.8 | 1.5 | 0.025-0.08 |
| DOTT | (00 101 | 110 | 2.4 | 2.5 | 0.0000 0.154 |
Table 1 Pharmacokinetic parameters (cf. [8]).
Note: DLV: delavirdine, EFV: efavirenz, NVP: nevirapine APV: aprenavir, IDV: indinavir, RTV: ritonavir.
In this section, we explore the outcomes of the effects of structured treatment interruption (drug holidays) in varying strategies. Firstly, we present the evolution of the concentration and efficacy of both RTI and PI drugs under perfect adherence in accordance with the recommendations. Secondly, we illustrate the time course of the concentration and effectiveness of both RTI and PI during continuous drug administration followed by a 1-day drug holiday. Thirdly, we investigate numerically the outcomes of combined RTI and PI drug-holiday treatments for various scenarios in drug administering during 160 days. The values of the pharmacokinetic parameters are given in Table 1. The parameter values of the model were taken from [11] and are given in Table 2.
Table 2 Parameter descriptions of the model.
| Parameters | Descriptions | Values | Units | Sources |
|---|---|---|---|---|
| \(\lambda_l\) | Production rate of Langerhans cells | (100,110) | cells/day | [11] |
| \(\pi\) | Production rate of CD4+T cells | 103 | cells/day | [22] |
| A | The half-saturation constant of the infection process in Langerhans | 1500 | cells/mm3 | [11] |
| \(\mu_I\) | Natural death rate of Langerhans cells | (0.111,0.333) | 1/day | [23] |
| μ | Natural death rate of CD4+Tcells | 0.1 | 1/day | [24] |
| \(\mu_{v}\) | Natural death rate of free virus | 2.4 | 1/day | [26] |
| \(\sigma_1, \sigma_2\) | The constant rates of target cells acquiring the drugs | (0,1) | 1/day | varies |
| \(\beta_I\) | Langerhans infection rate by free virus. | (0.0094, 0.156) | 1/day | [25] |
| \(\beta_2\) | Langerhans infection rate by infected cells. | (0.0001, 0.02) | 1/day | [11] |
| \(\beta_3\) | CD4+T cells infection rate by infected Langerhans cells. | (0.0001, 0.01) | 1/day | [11] |
| \(\boldsymbol{\beta_4}\) | CD4+T cells infection rate by infected CD4+T cells. | (0.00001, 0.01) | 1/day | [11] |
| \(\beta_5\) | CD4+T cells infection rate by free virus. | \((2x10^{-5}, 0.005)\) | 1/cells day | [27,28] |
| \(\phi\) | Constant degradation rate by Langerhans cells | (2,9) | 1/day | [29, 30] |
| α | Constant lysis death rate of CD4+T cells | 0.24 | 1/day | [22] |
| ρ | Constant lysis death rate of Langerhans cells | 0.025 | 1/day | [34] |
| δ | Ratio of infection in CD4+T cells to infection in Langerhans cells. | (0.3,1) | - | [2] |
| N | The average number of virions produced by infected CD4+T cells | (100,1000) | virions/ cells day | [31,32, 33] |
| M | The average number of virions by infected Langerhans cells | 63.5 (10,100) | virions/ cells day | [34] [35] |
Langerhans cells endocytose HIV-1 into cytoplasm for several days, from 1 day up to 3 days, leading to Langerhans infection, while infection of CD4<sup>+</sup>T cells occurs in 1 day [2]. Parameter \(\delta\) is computed as the ratio of time duration of infection of CD4<sup>+</sup>T cells to the duration of infection of Langerhans cells. The value of \(\delta\) ranges from 1/3 to 1. In the simulations we chose \(\delta = 1\).
The initial conditions for the simulations were \(T(0) = 850 \text{ cells/mm}^3\) \(T_i(0) = 41 \text{ cells/mm}^3\), \(V(0) = 3.76 \text{ virions/mm}^3\) [36], and we chose \(T_d(0) = 0 \text{ cells/mm}^3\). The number of healthy Langerhans cells in an HIV-infected individual is 685 up to 1600 cells/mm<sup>3</sup>, whilst the proportion of infected Langerhans cells is 5% up to 25% of Langerhans cells [37,38]. In the simulations we chose \(L(0) = 850 \text{ cells/mm}^3\), \(L_i(0) = 50 \text{ cells/mm}^3\), and \(L_d(0) = 0 \text{ cells/mm}^3\).
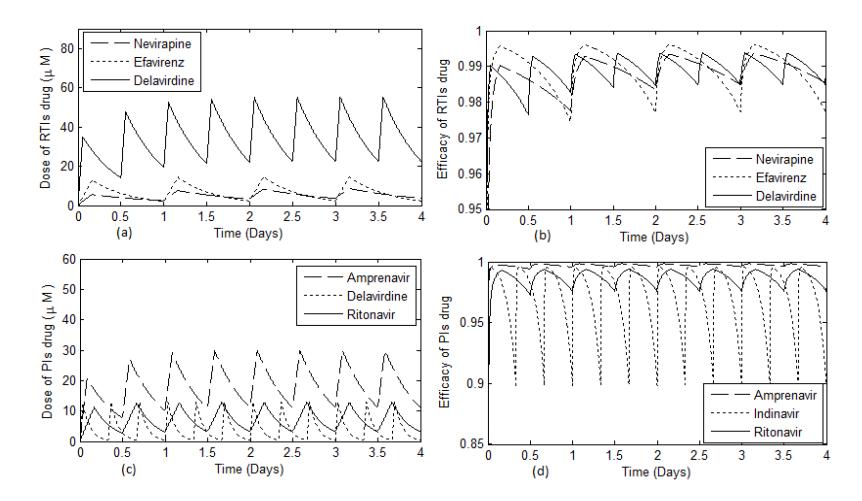
Figure 1 Time evolution of concentration and efficacy of RTI and PI drugs.
Figure 1 shows that in RTI class, the concentration of delavirdine reached the steady state condition after a longer time compared to the other drugs. In the PI class, the amprenavir concentration achieved the steady state condition after a longer time period compared to the other drugs. We see that efavirenz had higher effectiveness compared to delavirdine, despite the fact that the concentration of efavirenz was lower. In Figure 2, we observe the outcomes of treatment interruption of both RTI and PI associated with their concentration and effectiveness. In this case, we consider the cycles of treatment involving 5 days continuous treatment followed by a 1-day drug holiday.
Figure 2 shows that, in the RTI class, the effectiveness of efavirenz decreased more quickly compared to the other drugs, whilst in the PI class, the effectiveness of indinavir decreased more sharply compared to the other drugs.
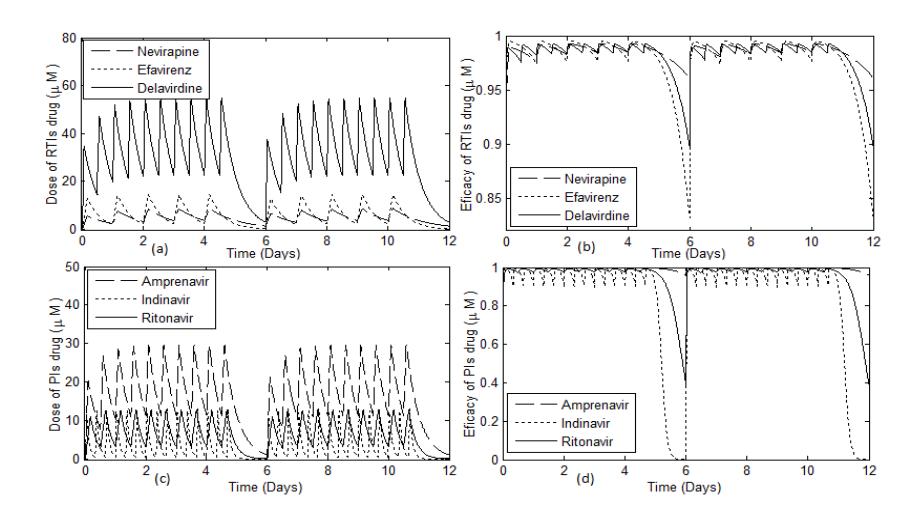
Figure 2 Time evolution of the concentration and effectiveness of RTI and PI drugs in 5 days on and 1 day off drug administration.
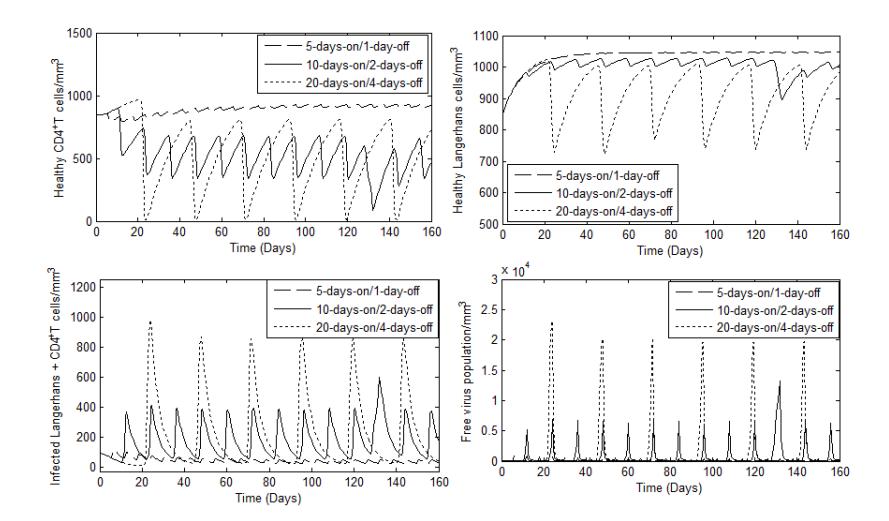
Figure 3 Evolution of Langerhans, cells and free virus over time when delavirdine and ritonavir drugs were administered in a drug holiday treatment, with A = 1500, π = 103, λ1= 105, μ = μl= 0.1, μv= 2.4, σ1= σ2= 0.2, ϕ = 2, β1= 0.01, β2= 0.002, β3= 0.0005, β4= 0.0001, β5= 0.00042, α = 0.24, ρ = 0.025, δ = 1, N = 350, M = 50. CD4 T
Next, we studied the outcome of ARV therapy under different drug-holiday strategies in drug administration during 160 days. The average drug holiday of the different treatment strategies was about 24 days. The treatment scenarios can be described as follows. Firstly, therapy involving cycles of treatment with a combination of delavirdine and ritonavir administered continuously for 5 days followed by a 1-day interruption. Secondly, therapy involving cycles of treatment with a combination of delavirdine and ritonavir administered continuously for 10 days followed by a 2-day interruption. Lastly, treatment with a combination of delavirdine and ritonavir administered continuously for 20 days followed by a 4-day interruption and the cycle of the treatment being repeated continuously.
Figure 3 shows that in the treatment cycles involving a 1-day interruption, the number of healthy target cells still increased. The treatment cycles involving a 4-day interruption led to the number of healthy target cells decreasing rapidly with oscillations (see Figure 3(a) and Figure 3(b)). The decrease is associated with the increase of the number of infected target cells and of the free virus in an oscillatory manner (see Figure 3(c) and Figure 3(d)).
5 Conclusion
In this paper, the impact of multiple drug dosing incorporating drug accumulation with drug holidays in combined RTI and PI therapies on HIV-1 infection was investigated. A model incorporating some of the target cells for HIV encountered during early HIV infection, i.e. Langerhans cells and CD4+ T cells was constructed. Mathematical analysis of the infection-free equilibrium point was done using an alternative threshold that provided conditions under which the infection may progress, i.e. when the infection-free equilibrium is unstable. This instability condition was used to come up with a representative scenario of infection progression and under this scenario we numerically investigated the outcomes of drug-holiday treatments in early HIV-1 infection considering that the drugs are administered orally and periodically. A pharmacokinetics model was used to calculate the drug efficacy of RTI and PI drugs as a periodic time-varying function. The evolution of the drug concentrations for multiple drug dosing was modeled more realistically by considering the drug accumulation in the body before the next dose was administered.
Also, the drug pharmacokinetics were modeled to formulate the drug concentration in the body and the effects of various treatment regiments on the outcome of early HIV-1 infection corresponding to the number of Langerhans cells, CD4 T cells, and viral load. It is important to know the time duration of the drug holidays during ARV therapy. Our results provide insight for administration of drugs using drug-holiday strategies during early HIV infection. Our results suggest that periodic drug holidays are more effective if the time duration of the drug holidays is shorter, when the drugs are administered continuously for 5 days followed by a 1-day interruption. Our
results are supported by other studies, such as [20], although the authors recommend 5-day on and 2-day treatment interruptions. Benson [21] suggests that safe treatments may require short interruptions, although he does not specify precisely what duration of interruption. The concept of periodic drug efficacy according to pharmacokinetic type provides insight into ARV therapies in prognosis of HIV-1 infection. This study can be further developed to explore the optimum control problems, including structured treatment interruptions, as an important strategy for antiretroviral therapy to suppress virus replication.
Acknowledgements
This work was partly funded by a grant from the Directorate General of Higher Education, Indonesia (DIKTI).